You are not logged in.
This means you
CAN ONLY VIEW reports that were published prior to Monday, April 14, 2025.
You
MUST UPGRADE YOUR MEMBERSHIP if you want to see any current reports.
AFTER MARKET UPDATE - WEDNESDAY, JULY 25TH, 2012
Previous After Market Report Next After Market Report >>>
|
|
|
|
DOW |
+58.73 |
12,676.05 |
+0.47% |
|
Volume |
783,494,730 |
-3% |
|
Volume |
1,698,343,810 |
+1% |
|
NASDAQ |
-8.75 |
2,854.24 |
-0.31% |
|
Advancers |
1,631 |
52% |
|
Advancers |
1,433 |
56% |
|
S&P 500 |
-0.42 |
1,337.89 |
-0.03% |
|
Decliners |
1,398 |
44% |
|
Decliners |
1,002 |
39% |
|
Russell 2000 |
+1.56 |
769.31 |
+0.20% |
|
52 Wk Highs |
89 |
|
|
52 Wk Highs |
23 |
|
|
S&P 600 |
+1.02 |
432.15 |
+0.24% |
|
52 Wk Lows |
73 |
|
|
52 Wk Lows |
84 |
|
|
 |
Major Indices Tally Mixed Session With Little Leadership
Kenneth J. Gruneisen - Passed the CAN SLIM® Master's Exam
Markets remained volatile into the closing bell on Wednesday. The volume totals were mixed, just lighter on the NYSE, but slightly higher on the Nasdaq exchange versus the prior session totals. Advancing issues led decliners by an 8-7 margin on the NYSE and by 7-5 ratio on the Nasdaq exchange. The total number of new 52-week highs led new 52-week lows on the NYSE, however new lows solidly outnumbered new highs on the Nasdaq exchange again. There were 9 high-ranked companies from the CANSLIM.net Leaders List made new 52-week highs and appeared on the CANSLIM.net BreakOuts Page, up from the prior session total of 7 stocks. There were gains for 9 of the 13 high-ranked companies currently included on the Featured Stocks Page.
The Dow Jones added 59 points in the session to close at 12,676. The S&P 500 Index gave up less than a point to end at 1,338, and both indexes are fighting to stay above their respective 50-day moving average (DMA) lines.
Stocks pared their advance as investors digested a bevy of corporate earnings and a weaker-than expected reading on June new home sales. Speculation on Fed stimulus was also a factor in the session following a Wall Street Journal report that stated the Federal Reserve could look to supply stimulus as early as next week.
Sector performance was tied heavily to corporate profit tallies. Industrials moved higher after (CAT +1.44%) and Boeing Co (BA +2.78%) posted better-than-expected results in the quarter. Tech stocks were the worst performers. A decline in Apple Inc (AAPL -4.32%) weighed heavily on the tech sector following their disappointing earnings report. Also among earnings, Pepsi (PEP +2.20%) advanced and Netflix Inc (NFLX -25.02%) fell $20.11 to $60.28 following their results.
Turning to bonds, Treasuries were little changed. The benchmark 10-year note was down 3/32 to yield 1.40% and the 30-year unchanged yielding 2.46%.
Damaging distribution coupled with waning leadership has cut short the market's latest confirmed rally and arguably put the major averages back into a "correction". In terms of the M criteria, investors will need to watch for the major averages to halt their slide and subsequently produce a new follow-through day to again confirm that odds are favorable for new buying efforts. In the meanwhile, investors are reminded to ALWAYS limit losses if ever any stock falls more than -7% from their purchase price to steadfastly protect precious capital. Following strict selling rules forces investors to reduce their market exposure and raise cash levels during market downturns.
In August we will begin providing all currently upgraded members access to new monthly webcasts! A new "Market's Leading Groups" archives tab will also soon be added on the Premium Member Homepage. These changes are aimed at satisfying member requests and improving the service. If you have questions, comments or suggestions please let us know via the inquiry form here. The most recent WEBCAST (Q2 2012) is available "ON DEMAND" - CLICK HERE.
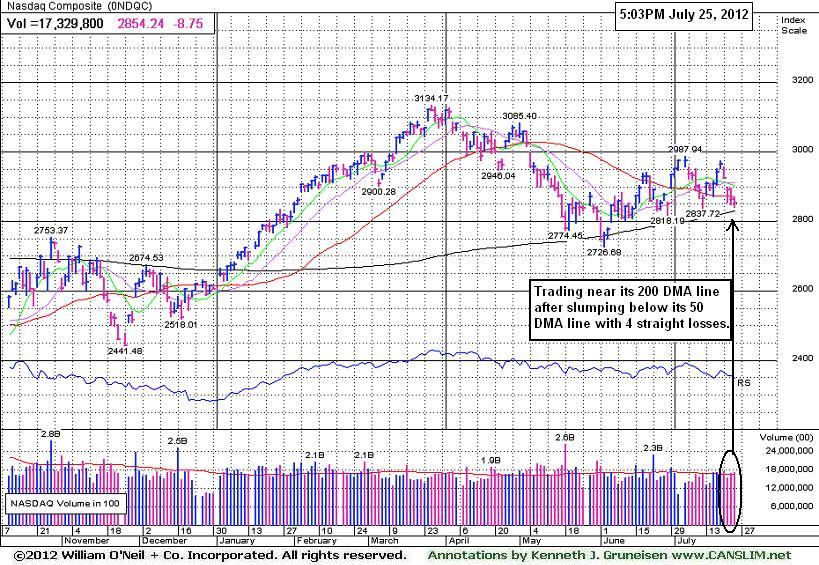
PICTURED: The Nasdaq Composite Index shed 9 points to finish at 2,854 after briefly turning positive in mid-session trading. It has slumped below its 50-day moving average (DMA) line with a streak of 4 consecutive losses. The 200 DMA line defines an important long-term support level well above its June 4th low.
|
 Kenneth J. Gruneisen started out as a licensed stockbroker in August 1987, a couple of months prior to the historic stock market crash that took the Dow Jones Industrial Average down -22.6% in a single day. He has published daily fact-based fundamental and technical analysis on high-ranked stocks online for two decades. Through FACTBASEDINVESTING.COM, Kenneth provides educational articles, news, market commentary, and other information regarding proven investment systems that work in good times and bad.
Comments contained in the body of this report are technical opinions only and are not necessarily those of Gruneisen Growth Corp. The material herein has been obtained from sources believed to be reliable and accurate, however, its accuracy and completeness cannot be guaranteed. Our firm, employees, and customers may effect transactions, including transactions contrary to any recommendation herein, or have positions in the securities mentioned herein or options with respect thereto. Any recommendation contained in this report may not be suitable for all investors and it is not to be deemed an offer or solicitation on our part with respect to the purchase or sale of any securities. |
|
 |
Healthcare Group Stumbles
Kenneth J. Gruneisen - Passed the CAN SLIM® Master's Exam
The Gold & Silver Index ($XAU +2.77%) posted a standout gain. Energy-related shares were not as decisive as the Oil Services Index ($OSX -0.49%) edged lower and the Integrated Oil Index ($XOI +0.24%) inched higher. The Retail Index ($RLX -1.27%) lost ground and created a drag on the major averages, however there was a slightly positive bias shown by financial stocks as the Bank Index ($BKX +0.45%) and Broker/Dealer Index ($XBD +0.71%) posted modest gains. There were solid gains from the Networking Index ($NWX +1.25%), Biotechnology Index ($BTK +1.31%), and the Semiconductor Index ($SOX +1.92%), but the Internet Index ($IIX -0.21%) lagged the tech sector with a small loss.
Charts courtesy www.stockcharts.com
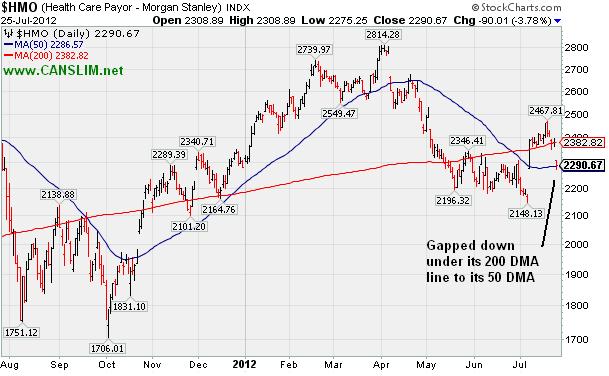
PICTURED: The Healthcare Index ($HMO -3.78%) gapped down under its 200-day moving average (DMA) line to its 50 DMA line. It had been making good progress in July, but the group is encountering pressure again.
| Oil Services |
$OSX |
210.19 |
-1.04 |
-0.49% |
-2.82% |
| Healthcare |
$HMO |
2,290.67 |
-90.01 |
-3.78% |
+0.40% |
| Integrated Oil |
$XOI |
1,163.81 |
+2.77 |
+0.24% |
-5.31% |
| Semiconductor |
$SOX |
367.13 |
+6.90 |
+1.92% |
+0.74% |
| Networking |
$NWX |
187.73 |
+2.32 |
+1.25% |
-12.75% |
| Internet |
$IIX |
288.85 |
-0.60 |
-0.21% |
+2.52% |
| Broker/Dealer |
$XBD |
80.36 |
+0.57 |
+0.71% |
-3.49% |
| Retail |
$RLX |
602.42 |
-7.73 |
-1.27% |
+15.14% |
| Gold & Silver |
$XAU |
147.08 |
+3.97 |
+2.77% |
-18.58% |
| Bank |
$BKX |
44.66 |
+0.20 |
+0.45% |
+13.41% |
| Biotech |
$BTK |
1,461.02 |
+18.83 |
+1.31% |
+33.86% |
|
|
|
 |
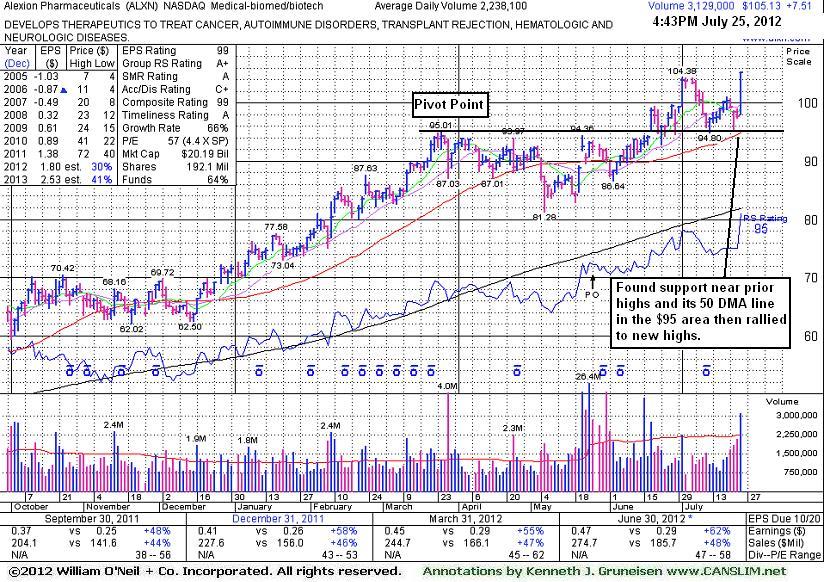
Gain to New High With +40% Above Average Volume on Earnings News
Kenneth J. Gruneisen - Passed the CAN SLIM® Master's Exam
Alexion Pharmaceuticals (ALXN +$7.51 or +7.69% to $105.13) hit a new all-time high with a considerable gain today backed by +40% above average volume, getting extended from its prior base. It reported earnings +62% on +48% sales revenues for the quarter ended June 30, 2012 versus the year ago period. It had recently been consolidating above prior highs in the $95 area and its 50-day moving average (DMA) line defining important chart support. No resistance remains due to overhead supply.
The stock was last shown in this FSU section with an annotated graph on 6/29/12 under the headline, "Confirming Gains With Volume Would Be Reassuring Sign". A gain with the bare minimum +40% above average volume meets the threshold to trigger a technical buy signal, and its rally after earnings news may be considered a confirming gain and welcome reassurance. However, 3 out of 4 stocks tend to go in the direction of the major averages and they recently entered another correction (as noted in the Market Commentary portion of the After Market Update. The M criteria argues against all new buying efforts again until there is a solid follow-through day from at least one of the major averages.
ALXN completed a new Public Offering on 5/25/12. The Medical - Biomed/Biotech industry group has demonstrated leadership and still earns the best possible rank, 99, for its Group Relative Strength Rating, a reassuring sign concerning the L criteria. ALXN's Relative Strength Rank (95) remains high. It easily satisfies the C and A criteria with a very strong quarterly and annual earnings history which has earned it a highest possible 99 Earnings Per Share rank. The number of top-rated funds owning its shares rose from 842 in Mar '11 to 1,156 in Jun '12, a reassuring sign concerning the I criteria of the fact-based investment system. With the help of underwriters, its latest Public Offering may very likely have helped it attract additional ownership interest from the institutional crowd.
|
|
|
Color Codes Explained :
Y - Better candidates highlighted by our
staff of experts.
G - Previously featured
in past reports as yellow but may no longer be buyable under the
guidelines.
***Last / Change / Volume data in this table is the closing quote data***
Symbol/Exchange
Company Name
Industry Group |
PRICE |
CHANGE
(%Change) |
Day High |
Volume
(% DAV)
(% 50 day avg vol) |
52 Wk Hi
% From Hi |
Featured
Date |
Price
Featured |
Pivot Featured |
|
Max Buy |
ALXN
-
NASDAQ
Alexion Pharmaceuticals
DRUGS - Drug Manufacturers - Other
|
$105.13
|
+7.51
7.69% |
$105.32
|
3,182,980
142.22% of 50 DAV
50 DAV is 2,238,100
|
$104.38
0.72%
|
5/1/2012
|
$91.73
|
PP = $95.11
|
|
MB = $99.87
|
 Most Recent Note - 7/25/2012 5:00:17 PM
G - Finished near the session high with a considerable gain backed by +40% above average volume. Color code is changed to green after rallying well above its "max buy"level. Reported earnings +62% on +48% sales revenues for the quarter ended June 30, 2012 versus the year ago period. Found support near its 50 DMA line and prior resistance in the $95 area. See the latest FSU analysis for more details and a new annotated graph.
>>> The latest Featured Stock Update with an annotated graph appeared on 7/25/2012. Click here.
View all notes |
Alert me of new notes |
CANSLIM.net Company Profile |
SEC |
Zacks Reports |
StockTalk |
News |
Chart |
Request a new note
C
A N
S L
I M


|
ASPS
-
NASDAQ
Altisource Ptf Sltns Sa
REAL ESTATE - Property Management/Developmen
|
$74.42
|
+0.62
0.84% |
$75.78
|
64,252
49.92% of 50 DAV
50 DAV is 128,700
|
$76.40
-2.59%
|
6/5/2012
|
$60.01
|
PP = $63.00
|
|
MB = $66.15
|
Most Recent Note - 7/25/2012 5:59:09 PM
G - Volume totals have been cooling while stubbornly holding its ground perched near its all-time high, extended from its prior base. Its recent low and its 50 DMA line define near-term support to watch.
>>> The latest Featured Stock Update with an annotated graph appeared on 7/3/2012. Click here.
View all notes |
Alert me of new notes |
CANSLIM.net Company Profile |
SEC |
Zacks Reports |
StockTalk |
News |
Chart |
Request a new note
C
A N
S L
I M
|
CFNL
-
NASDAQ
Cardinal Financial Corp
BANKING - Regional - Southeast Banks
|
$12.51
|
+0.10
0.81% |
$12.64
|
37,587
48.07% of 50 DAV
50 DAV is 78,200
|
$13.21
-5.30%
|
7/20/2012
|
$12.85
|
PP = $12.41
|
|
MB = $13.03
|
Most Recent Note - 7/24/2012 4:01:11 PM
Y - Encountering distributional pressure since featured in the 7/20/12 mid-day report. It has earned high ranks and matches favorably with the C and A criteria. Volume-driven gains are needed to confirm a proper technical buy signal. Recently wedged into new high territory with gains lacking great volume conviction. Careful investors may consider a tactic they teach in the Certification called "pyramiding" to let market action dictate buying efforts.

There are no Featured Stock Updates™ available for this stock at this time. You may request one by clicking the Request a New Note link below
View all notes |
Alert me of new notes |
CANSLIM.net Company Profile |
SEC |
Zacks Reports |
StockTalk |
News |
Chart |
Request a new note
C
A N
S L
I M
|
CMCSA
-
NASDAQ
Comcast Corp Cl A
MEDIA - CATV Systems
|
$31.36
|
-0.04
-0.13% |
$31.57
|
8,656,251
64.64% of 50 DAV
50 DAV is 13,391,600
|
$32.78
-4.33%
|
6/11/2012
|
$29.94
|
PP = $30.98
|
|
MB = $32.53
|
Most Recent Note - 7/25/2012 5:55:05 PM
Y - Volume totals have been quiet or average while recently holding its ground above its pivot point. No overhead supply remains to act as resistance and it is still trading below its "max buy" level.
>>> The latest Featured Stock Update with an annotated graph appeared on 7/11/2012. Click here.
View all notes |
Alert me of new notes |
CANSLIM.net Company Profile |
SEC |
Zacks Reports |
StockTalk |
News |
Chart |
Request a new note
C
A N
S L
I M
|
DG
-
NYSE
Dollar General Corp
RETAIL - Discount, Variety Stores
|
$51.29
|
-1.19
-2.27% |
$51.43
|
5,258,417
135.56% of 50 DAV
50 DAV is 3,878,900
|
$56.04
-8.48%
|
7/16/2012
|
$54.68
|
PP = $56.14
|
|
MB = $58.95
|
Most Recent Note - 7/25/2012 5:57:33 PM
Y - Gapped down today for as loss but rebounded to finish near the session high and closed just above its 50 DMA line after encountering distributional pressure. It did not register volume-driven gains above its new pivot point to trigger a new (or add-on) technical buy signal.
>>> The latest Featured Stock Update with an annotated graph appeared on 7/12/2012. Click here.
View all notes |
Alert me of new notes |
CANSLIM.net Company Profile |
SEC |
Zacks Reports |
StockTalk |
News |
Chart |
Request a new note
C
A N
S L
I M
|
Symbol/Exchange
Company Name
Industry Group |
PRICE |
CHANGE
(%Change) |
Day High |
Volume
(% DAV)
(% 50 day avg vol) |
52 Wk Hi
% From Hi |
Featured
Date |
Price
Featured |
Pivot Featured |
|
Max Buy |
EXPE
-
NASDAQ
Expedia Inc
INTERNET - Internet Information Providers
|
$44.25
|
-2.07
-4.47% |
$46.41
|
5,102,706
138.19% of 50 DAV
50 DAV is 3,692,400
|
$50.66
-12.65%
|
4/27/2012
|
$41.80
|
PP = $35.57
|
|
MB = $37.35
|
Most Recent Note - 7/25/2012 5:45:24 PM
G - Down today with above average volume while violating its 50 DMA line and finishing in the lower third of its intra-day range raising concerns. Prior low ($43.44 on 7/13/12) defines the next important support level to watch.
>>> The latest Featured Stock Update with an annotated graph appeared on 7/10/2012. Click here.
View all notes |
Alert me of new notes |
CANSLIM.net Company Profile |
SEC |
Zacks Reports |
StockTalk |
News |
Chart |
Request a new note
C
A N
S L
I M
|
GNC
-
NYSE
G N C Holdings Inc
RETAIL - Drug Stores
|
$37.89
|
+0.58
1.55% |
$39.15
|
3,266,955
143.72% of 50 DAV
50 DAV is 2,273,100
|
$42.70
-11.26%
|
6/29/2012
|
$39.20
|
PP = $40.00
|
|
MB = $42.00
|
Most Recent Note - 7/25/2012 5:53:31 PM
G - Posted a gain today with above average volume but it encountered distributional pressure and finished the session still under its 50 DMA line which may act as a resistance level. Disciplined investors always limit losses if any stock falls more than -7% from their purchase price.
>>> The latest Featured Stock Update with an annotated graph appeared on 7/5/2012. Click here.
View all notes |
Alert me of new notes |
CANSLIM.net Company Profile |
SEC |
Zacks Reports |
StockTalk |
News |
Chart |
Request a new note
C
A N
S L
I M
|
GPX
-
NYSE
G P Strategies Corp
DIVERSIFIED SERVICES - Education and Training Services
|
$17.13
|
+0.11
0.65% |
$17.26
|
31,054
54.01% of 50 DAV
50 DAV is 57,500
|
$18.99
-9.79%
|
6/29/2012
|
$18.01
|
PP = $18.15
|
|
MB = $19.06
|
Most Recent Note - 7/23/2012 6:44:08 PM
Y - Slumped further toward its 50 DMA line today with a loss on slightly higher volume. Recent losses completely negated the prior breakout and raised concerns. Disciplined investors always limit losses by selling any stock if it falls more than -7% from their purchase price.
>>> The latest Featured Stock Update with an annotated graph appeared on 7/6/2012. Click here.
View all notes |
Alert me of new notes |
CANSLIM.net Company Profile |
SEC |
Zacks Reports |
StockTalk |
News |
Chart |
Request a new note
C
A N
S L
I M
|
N
-
NYSE
Netsuite Inc
DIVERSIFIED SERVICES - Business/Management Services
|
$48.99
|
+0.24
0.49% |
$49.72
|
210,208
36.32% of 50 DAV
50 DAV is 578,700
|
$56.06
-12.61%
|
6/20/2012
|
$51.83
|
PP = $51.88
|
|
MB = $54.47
|
Most Recent Note - 7/23/2012 6:47:31 PM
Y - Finished near the session high today after trading under its 50 DMA line and recent lows defining important near-term support. More damaging losses would raise serious concerns and trigger a worrisome technical sell signal.
>>> The latest Featured Stock Update with an annotated graph appeared on 7/19/2012. Click here.
View all notes |
Alert me of new notes |
CANSLIM.net Company Profile |
SEC |
Zacks Reports |
StockTalk |
News |
Chart |
Request a new note
C
A N
S L
I M
|
NSM
-
NYSE
Nationstar Mtg Hldgs Inc
FINANCIAL SERVICES - Credit Services
|
$22.52
|
-0.47
-2.04% |
$23.19
|
691,710
84.63% of 50 DAV
50 DAV is 817,300
|
$25.11
-10.31%
|
6/27/2012
|
$20.29
|
PP = $20.46
|
|
MB = $21.48
|
Most Recent Note - 7/24/2012 10:36:26 AM
G - Gapped down today, retreating from its 52-week high after proposing an Offering of $100 million of Senior Notes. It has recently been noted - "Extended from its prior base. Prior highs and its 50 DMA line in the $20 area define important support to watch on pullbacks."
>>> The latest Featured Stock Update with an annotated graph appeared on 6/27/2012. Click here.
View all notes |
Alert me of new notes |
CANSLIM.net Company Profile |
SEC |
Zacks Reports |
StockTalk |
News |
Chart |
Request a new note
C
A N
S L
I M
|
Symbol/Exchange
Company Name
Industry Group |
PRICE |
CHANGE
(%Change) |
Day High |
Volume
(% DAV)
(% 50 day avg vol) |
52 Wk Hi
% From Hi |
Featured
Date |
Price
Featured |
Pivot Featured |
|
Max Buy |
SWI
-
NYSE
Solarwinds Inc
COMPUTER SOFTWARE and SERVICES - Application Software
|
$49.48
|
+8.00
19.29% |
$50.00
|
4,122,512
416.42% of 50 DAV
50 DAV is 990,000
|
$48.64
1.73%
|
7/25/2012
|
$47.82
|
PP = $47.89
|
|
MB = $50.28
|
Most Recent Note - 7/25/2012 5:50:15 PM
Y - Reported earnings +50% on +40% sales revenues for the quarter ended June 30, 2012 versus the year ago period. Gapped up today, spiked to a new 52-week high and finished strong with a considerable gain backed by 4 times average volume. It was rallying above its 50 DMA line and on the rise when highlighted in yellow in today's mid-day report (read here) with new pivot point cited based on its 6/19/12 high while rallying from a "double bottom" base pattern and noted - "It has shown resilience since dropped on 7/09/12 from the Featured Stocks list. A strong finish above its pivot point may clinch a technical buy signal, however the M criteria now argues against any new buying efforts until the major averages confirm a new rally with another follow-through day."
>>> The latest Featured Stock Update with an annotated graph appeared on 6/15/2012. Click here.
View all notes |
Alert me of new notes |
CANSLIM.net Company Profile |
SEC |
Zacks Reports |
StockTalk |
News |
Chart |
Request a new note
C
A N
S L
I M
|
TDG
-
NYSE
Transdigm Group Inc
AEROSPACE/DEFENSE - Aerospace/Defense Products and; Services
|
$120.25
|
+0.24
0.20% |
$120.99
|
542,881
109.21% of 50 DAV
50 DAV is 497,100
|
$136.34
-11.80%
|
6/18/2012
|
$127.00
|
PP = $132.79
|
|
MB = $139.43
|
Most Recent Note - 7/25/2012 5:51:08 PM
G - Held its ground today following a damaging loss on 7/24/12 with heavy volume that violated its 50 DMA line triggering a technical sell signal.
>>> The latest Featured Stock Update with an annotated graph appeared on 7/18/2012. Click here.
View all notes |
Alert me of new notes |
CANSLIM.net Company Profile |
SEC |
Zacks Reports |
StockTalk |
News |
Chart |
Request a new note
C
A N
S L
I M
|
VSI
-
NYSE
Vitamin Shoppe Inc
SPECIALTY RETAIL - Specialty Retail, Other
|
$55.47
|
+1.56
2.89% |
$56.05
|
323,674
86.68% of 50 DAV
50 DAV is 373,400
|
$58.22
-4.72%
|
6/29/2012
|
$54.93
|
PP = $55.03
|
|
MB = $57.78
|
Most Recent Note - 7/25/2012 4:37:27 PM
Y - Gapped up today and tallied a gain with below average volume. Found support at its 50 DMA line this week, but any damaging violation would raise concerns and trigger a technical sell signal. Recent gains after forming an 8-week cup-with-handle base lacked the volume required to trigger a proper new (or add-on) technical buy signal.
>>> The latest Featured Stock Update with an annotated graph appeared on 7/2/2012. Click here.
View all notes |
Alert me of new notes |
CANSLIM.net Company Profile |
SEC |
Zacks Reports |
StockTalk |
News |
Chart |
Request a new note
C
A N
S L
I M
|
|
|
|
THESE ARE NOT BUY RECOMMENDATIONS!
Comments contained in the body of this report are technical
opinions only. The material herein has been obtained
from sources believed to be reliable and accurate, however,
its accuracy and completeness cannot be guaranteed.
This site is not an investment advisor, hence it does
not endorse or recommend any securities or other investments.
Any recommendation contained in this report may not
be suitable for all investors and it is not to be deemed
an offer or solicitation on our part with respect to
the purchase or sale of any securities. All trademarks,
service marks and trade names appearing in this report
are the property of their respective owners, and are
likewise used for identification purposes only.
This report is a service available
only to active Paid Premium Members.
You may opt-out of receiving report notifications
at any time. Questions or comments may be submitted
by writing to Premium Membership Services 665 S.E. 10 Street, Suite 201 Deerfield Beach, FL 33441-5634 or by calling 1-800-965-8307
or 954-785-1121.
|
|
|

