You are not logged in.
This means you
CAN ONLY VIEW reports that were published prior to Monday, April 14, 2025.
You
MUST UPGRADE YOUR MEMBERSHIP if you want to see any current reports.
AFTER MARKET UPDATE - WEDNESDAY, JULY 24TH, 2013
Previous After Market Report Next After Market Report >>>
|
|
|
|
DOW |
-25.50 |
15,542.24 |
-0.16% |
|
Volume |
678,510,850 |
+9% |
|
Volume |
1,741,725,730 |
+12% |
|
NASDAQ |
+0.33 |
3,579.60 |
+0.01% |
|
Advancers |
731 |
23% |
|
Advancers |
984 |
38% |
|
S&P 500 |
-6.45 |
1,685.94 |
-0.38% |
|
Decliners |
2,292 |
73% |
|
Decliners |
1,475 |
57% |
|
Russell 2000 |
-8.37 |
1,043.83 |
-0.80% |
|
52 Wk Highs |
199 |
|
|
52 Wk Highs |
233 |
|
|
S&P 600 |
-4.39 |
586.80 |
-0.74% |
|
52 Wk Lows |
60 |
|
|
52 Wk Lows |
14 |
|
|
 |
Breadth Negative and Volume Totals Higher as Major Averages Ended Mixed
Kenneth J. Gruneisen - Passed the CAN SLIM® Master's Exam
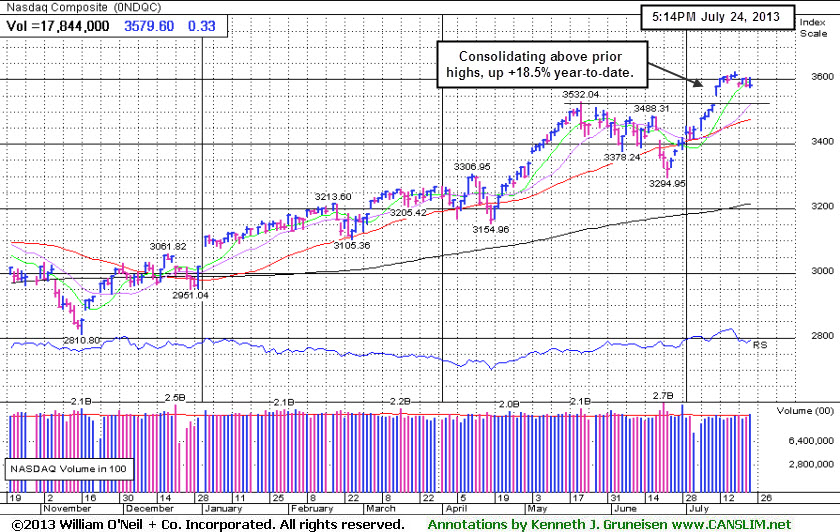
The major averages were mixed and little changed on Wednesday after spending most of the session in the red. Volume totals were reported higher than the prior session totals on the NYSE and on the Nasdaq exchange. Breadth was clearly negative as decliners led advancers by a 3-1 margin on the NYSE and by 3-2 on the Nasdaq exchange. There were 76 high-ranked companies from the CANSLIM.net Leaders List made new 52-week highs and appeared on the CANSLIM.net BreakOuts Page, down from the prior session total of 81 stocks. The list of stocks hitting new 52-week highs easily outnumbered new 52-week lows on both the NYSE and the Nasdaq exchange. There were gains for 6 of the 12 high-ranked companies currently included on the Featured Stocks Page.
The Dow Jones Industrial Average gave up 25 points to 15,542 after being down by as many as 70 points earlier. Stocks traded in a narrow range throughout the session as investors digested a batch of corporate earnings and several global economic reports. On our shores, economic data was largely positive with July manufacturing and June new home sales topping expectations.
Nine of the 10 sectors on the S&P ended lower, led by declines in utility stocks including Duke Energy (DUK -1.14%). Tech stocks were the best performing group. Apple Inc (AAPL +5.14%) rallied after the company posted better-than-expected quarterly earnings and sales. On the downside, Caterpillar inc (CAT -2.43%) fell after falling short of analysts' estimates and lowering their full-year earnings guidance.
Turning to fixed income markets, Treasuries were lower along the curve. The benchmark 10-year note was down 21/32 to yield 2.59% and the 30-year bond gave up over a full point to yield 3.64%.
The market (M criteria) has flashed substantial strength and leadership. Now in a confirmed rally, odds are considered favorable for investors' success with new buying efforts. Investors should be disciplined and selective while looking to be proactive and focused exclusively on the individual leaders best matching the winning models of the fact-based investment system. Study the companies on the CANSLIM.net Featured Stocks Page - a page showing the most action-worthy candidates' latest notes and links to additional resources including detailed analysis with data-packed graphs which are annotated by a Certified expert. The Premium Member Homepage - includes "dynamic archives" to all prior pay reports published. Watch for an announcement via email concerning the next WEBCAST.
PICTURED: The Nasdaq Composite Index is consolidating above prior highs and ended the session up +18.5% year-to-date.
|
 Kenneth J. Gruneisen started out as a licensed stockbroker in August 1987, a couple of months prior to the historic stock market crash that took the Dow Jones Industrial Average down -22.6% in a single day. He has published daily fact-based fundamental and technical analysis on high-ranked stocks online for two decades. Through FACTBASEDINVESTING.COM, Kenneth provides educational articles, news, market commentary, and other information regarding proven investment systems that work in good times and bad.
Comments contained in the body of this report are technical opinions only and are not necessarily those of Gruneisen Growth Corp. The material herein has been obtained from sources believed to be reliable and accurate, however, its accuracy and completeness cannot be guaranteed. Our firm, employees, and customers may effect transactions, including transactions contrary to any recommendation herein, or have positions in the securities mentioned herein or options with respect thereto. Any recommendation contained in this report may not be suitable for all investors and it is not to be deemed an offer or solicitation on our part with respect to the purchase or sale of any securities. |
|
 |
Medical Groups Edged Higher; XAU Led Decliners
Kenneth J. Gruneisen - Passed the CAN SLIM® Master's Exam
The Biotechnology Index ($BTK +0.56%) and the Healthcare Index ($HMO +0.44%) eked out small gains on Wednesday's mostly negative session. The Gold & Silver Index ($XAU -4.52%) was a standout decliner as it was smacked with a large loss. The Semiconductor Index ($SOX -1.83%) was hit hard and led the tech sector lower, meanwhile the Networking Index ($NWX -0.43%) and the Internet Index ($IIX -0.33%) each edged lower. Energy-related shares cooled as the Oil Services Index ($OSX -1.27%) and the Integrated Oil Index ($XOI -0.88%) both fell. The Retail Index ($RLX -0.43%) created a drag on the major averages and the Broker/Dealer Index ($XBD -0.15%) finished the session slightly in the red.
Charts courtesy www.stockcharts.com
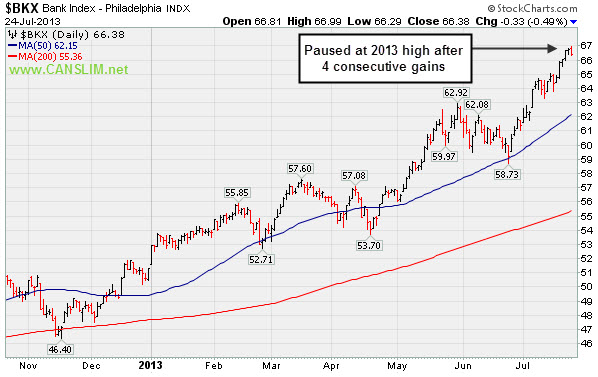
PICTURED: The Bank Index ($BKX -0.49%) paused at its 2013 high after 5 consecutive gains.
| Oil Services |
$OSX |
266.63 |
-3.44 |
-1.27% |
+21.11% |
| Healthcare |
$HMO |
3,478.45 |
+15.17 |
+0.44% |
+38.35% |
| Integrated Oil |
$XOI |
1,400.44 |
-12.38 |
-0.88% |
+12.77% |
| Semiconductor |
$SOX |
474.69 |
-8.83 |
-1.83% |
+23.60% |
| Networking |
$NWX |
283.26 |
-1.23 |
-0.43% |
+25.03% |
| Internet |
$IIX |
399.86 |
-1.32 |
-0.33% |
+22.28% |
| Broker/Dealer |
$XBD |
134.11 |
-0.20 |
-0.15% |
+42.18% |
| Retail |
$RLX |
833.35 |
-3.63 |
-0.43% |
+27.61% |
| Gold & Silver |
$XAU |
98.91 |
-4.68 |
-4.52% |
-40.27% |
| Bank |
$BKX |
66.38 |
-0.33 |
-0.49% |
+29.45% |
| Biotech |
$BTK |
2,138.85 |
+11.84 |
+0.56% |
+38.26% |
|
|
|
 |
Faltering Near 50-day Moving Average While Relative Strength Wanes
Kenneth J. Gruneisen - Passed the CAN SLIM® Master's Exam
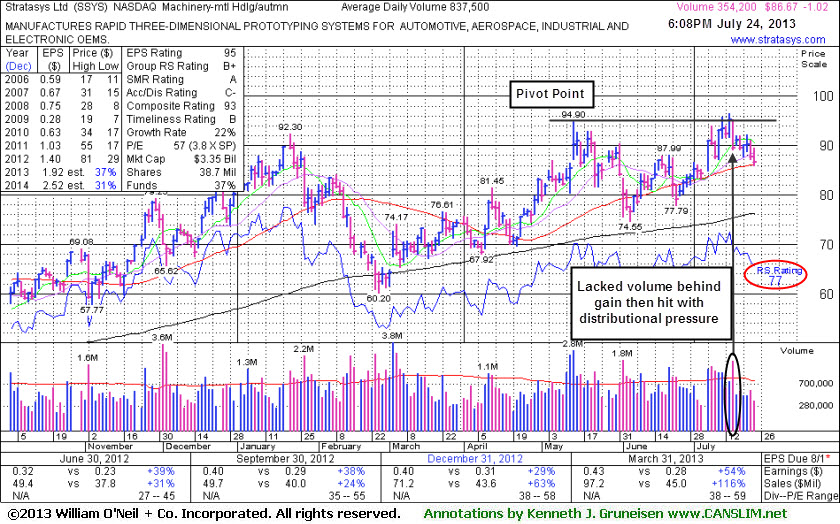
Stratasys Inc (SSYS -$1.02 or -1.16% to $86.67) finished the session -10.1% off its 52-week high as it slumped near its 50-day moving average (DMA) line with a loss on light volume. That is an important support level recognized by chart readers. More damaging losses would raise concerns and trigger technical sell signals. It failed to make headway above the previously stubborn resistance in the $94 area since last shown in this FSU section on 7/08/13 with an annotated graph under the headline, "Finished Lower Following 'Negative Reversal' After Challenging High". Members were cautioned - "After challenging its prior high it ended near the session low with a loss on higher volume - action which is technically termed a "negative reversal". When poised for a best-ever close, and while the broader market showed mostly positive action, the weak finish was a clear sign that it was encountering distributional pressure. Disciplined investors will watch for a proper technical breakout and more reassuring from the broader market (M criteria) before considering new buying efforts."
In the interim, more encouraging positive action in the major averages (M criteria) has helped reassure investors that odds are favorable for new buying efforts. However, the stock's Relative Strength Rating has slumped to 77, below the 80+ minimum guideline for buy candidates under the fact-based investment system.
Its strong quarterly earnings history above the +25% minimum guideline satisfies the C criteria. Reported earnings +54% on +116% sales revenues for the Mar '13 quarter versus the year ago period. The company will release financial results for the quarter ended June 30, 2013 before the market open on Thursday, August 8, 2013. Price volume action leading into the next earnings release may likely give investors a hint as to its earnings outlook, and certainly its reaction to earnings news will be closely watched. Volume and volatility often increase near earnings news.
SSYS was highlighted in yellow in the 7/08/13 mid-day report with a pivot point cited based on its 5/14/13 high plus 10 cents (read here). Volume-driven gains had it rallying toward multi-month resistance in the $92-94 area with little resistance due to overhead supply. Following its negative reversal on 7/08/13 it surged higher with heavier volume while challenging its pivot point. Its best close was on 7/15/13, and although it ended that session above its pivot point the volume on that session was below average and not sufficient to trigger a proper technical buy signal. Keep in mind that a volume-driven breakout is a critical sign of the heavy institutional buying demand which can lead to a sustained and meaningful advance in price. It didn't flash that sign of buying demand, but it was then smacked again for a loss with heavy volume on 7/16/13, and its subsequent gains lacked volume conviction.
A downturn in its FY '09 earnings was previously noted as a flaw with respect to the investment system's A criteria. It found support near its 200 DMA line during a deep consolidation earlier this year. Ownership by top-rated funds rose from 246 in Sep '12 to 286 in Jun '13, a reassuring sign concerning the I criteria. It is an interesting turn around story with a small supply of 36.7 million shares (S criteria) outstanding. Longtime members may recall that SSYS was long ago (2003) featured in reports.
|
|
|
Color Codes Explained :
Y - Better candidates highlighted by our
staff of experts.
G - Previously featured
in past reports as yellow but may no longer be buyable under the
guidelines.
***Last / Change / Volume data in this table is the closing quote data***
Symbol/Exchange
Company Name
Industry Group |
PRICE |
CHANGE
(%Change) |
Day High |
Volume
(% DAV)
(% 50 day avg vol) |
52 Wk Hi
% From Hi |
Featured
Date |
Price
Featured |
Pivot Featured |
|
Max Buy |
AMBA
-
NASDAQ
Ambarella Inc
ELECTRONICS - Semiconductor - Specialized
|
$18.24
|
-0.48
-2.56% |
$18.99
|
609,106
48.39% of 50 DAV
50 DAV is 1,258,800
|
$19.44
-6.17%
|
7/15/2013
|
$17.87
|
PP = $18.68
|
|
MB = $19.61
|
 Most Recent Note - 7/24/2013 6:26:04 PM
Y - Pulled back below its pivot point today with a 2nd consecutive loss backed by lighter than average volume. It broke out from its latest base pattern on 7/17/13 with +65% above average volume triggering a new (or add-on) technical buy signal.
>>> The latest Featured Stock Update with an annotated graph appeared on 7/17/2013. Click here.
View all notes |
Alert me of new notes |
CANSLIM.net Company Profile |
SEC |
Zacks Reports |
StockTalk |
News |
Chart |
Request a new note
C
A N
S L
I M


|
CELG
-
NASDAQ
Celgene Corp
DRUGS - Drug Manufacturers - Major
|
$135.99
|
+0.91
0.67% |
$136.47
|
2,160,290
72.31% of 50 DAV
50 DAV is 2,987,400
|
$138.77
-2.00%
|
7/11/2013
|
$133.25
|
PP = $131.92
|
|
MB = $138.52
|
Most Recent Note - 7/23/2013 5:52:02 PM
Y - Touched a new high but reversed into the red today. Prior highs define initial support to watch. Breakaway gap and solid gain with twice average volume on 7/11/13 triggered a technical buy signal. Disciplined investors always limit losses by selling if any stock falls more than -7% from their purchase price.
>>> The latest Featured Stock Update with an annotated graph appeared on 7/11/2013. Click here.
View all notes |
Alert me of new notes |
CANSLIM.net Company Profile |
SEC |
Zacks Reports |
StockTalk |
News |
Chart |
Request a new note
C
A N
S L
I M
|
FLT
-
NYSE
Fleetcor Technologies
DIVERSIFIED SERVICES - Business/Management Services
|
$87.74
|
+0.66
0.76% |
$87.96
|
272,103
35.15% of 50 DAV
50 DAV is 774,200
|
$89.75
-2.24%
|
5/29/2013
|
$86.02
|
PP = $85.66
|
|
MB = $89.94
|
Most Recent Note - 7/18/2013 5:51:55 PM
G- Recently found support near its 50 DMA line with gains lacking volume conviction. Prior low ($80.28 on 6/21/13) defines the next important near-term support where a violation would raise more serious concerns. See the latest FSU analysis for more details and a new annotated graph.
>>> The latest Featured Stock Update with an annotated graph appeared on 7/18/2013. Click here.
View all notes |
Alert me of new notes |
CANSLIM.net Company Profile |
SEC |
Zacks Reports |
StockTalk |
News |
Chart |
Request a new note
C
A N
S L
I M
|
LOPE
-
NASDAQ
Grand Canyon Education
DIVERSIFIED SERVICES - Education and; Training Services
|
$35.37
|
-0.39
-1.09% |
$36.37
|
791,622
185.09% of 50 DAV
50 DAV is 427,700
|
$36.45
-2.96%
|
6/19/2013
|
$31.47
|
PP = $34.17
|
|
MB = $35.88
|
Most Recent Note - 7/24/2013 6:28:19 PM
Y - Reversed into the red for a loss with above average volume, ending just below its "max buy" level . Prior highs in the $34 area define initial support above its 50 DMA line. Reports its second quarter results after market close on Tuesday, July 30, 2013.
>>> The latest Featured Stock Update with an annotated graph appeared on 7/19/2013. Click here.
View all notes |
Alert me of new notes |
CANSLIM.net Company Profile |
SEC |
Zacks Reports |
StockTalk |
News |
Chart |
Request a new note
C
A N
S L
I M
|
PCLN
-
NASDAQ
Priceline.Com Inc
INTERNET - Internet Software and Services
|
$894.02
|
-1.77
-0.20% |
$905.64
|
439,368
61.90% of 50 DAV
50 DAV is 709,800
|
$926.40
-3.50%
|
7/8/2013
|
$878.28
|
PP = $847.43
|
|
MB = $889.80
|
Most Recent Note - 7/19/2013 5:54:01 PM
G - Endured mild distributional pressure this week while consolidating after getting extended from its prior base. Prior highs in the $847 area define initial support to watch on pullbacks.
>>> The latest Featured Stock Update with an annotated graph appeared on 7/9/2013. Click here.
View all notes |
Alert me of new notes |
CANSLIM.net Company Profile |
SEC |
Zacks Reports |
StockTalk |
News |
Chart |
Request a new note
C
A N
S L
I M
|
Symbol/Exchange
Company Name
Industry Group |
PRICE |
CHANGE
(%Change) |
Day High |
Volume
(% DAV)
(% 50 day avg vol) |
52 Wk Hi
% From Hi |
Featured
Date |
Price
Featured |
Pivot Featured |
|
Max Buy |
PRLB
-
NYSE
Proto Labs Inc
MANUFACTURING - Small Tools and Accessories
|
$63.42
|
-1.09
-1.69% |
$64.90
|
144,288
32.77% of 50 DAV
50 DAV is 440,300
|
$67.40
-5.91%
|
6/17/2013
|
$59.37
|
PP = $59.94
|
|
MB = $62.94
|
Most Recent Note - 7/19/2013 5:55:47 PM
G - Still holding its ground in a tight rage with volume totals cooling. Prior highs near $59 coincide with its 50 DMA line defining important support.
>>> The latest Featured Stock Update with an annotated graph appeared on 7/15/2013. Click here.
View all notes |
Alert me of new notes |
CANSLIM.net Company Profile |
SEC |
Zacks Reports |
StockTalk |
News |
Chart |
Request a new note
C
A N
S L
I M
|
RRTS
-
NYSE
Roadrunner Trans Systems
TRANSPORTATION - Air Delivery and Freight Service
|
$29.87
|
+0.08
0.27% |
$30.15
|
85,728
54.53% of 50 DAV
50 DAV is 157,200
|
$30.50
-2.07%
|
4/3/2013
|
$22.77
|
PP = $23.75
|
|
MB = $24.94
|
Most Recent Note - 7/22/2013 6:02:05 PM
G - Perched near its 52-week high with volume totals cooling while extended from any sound base. Reports results for the Jun '13 quarter on Wednesday, July 31, 2013 after market close. See the latest FSU analysis for more details and a new annotated graph.
>>> The latest Featured Stock Update with an annotated graph appeared on 7/22/2013. Click here.
View all notes |
Alert me of new notes |
CANSLIM.net Company Profile |
SEC |
Zacks Reports |
StockTalk |
News |
Chart |
Request a new note
C
A N
S L
I M
|
SFUN
-
NYSE
Soufun Hldgs Ltd Ads A
INTERNET - Internet Information Providers
|
$31.49
|
+0.37
1.19% |
$31.81
|
425,231
140.67% of 50 DAV
50 DAV is 302,300
|
$33.03
-4.66%
|
7/16/2013
|
$29.54
|
PP = $27.90
|
|
MB = $29.30
|
Most Recent Note - 7/23/2013 5:53:07 PM
G - Halted its slide with a small gain today after 4 consecutive losses. It is extended from its latest base. Prior highs in the $28-29 area define initial support to watch.
>>> The latest Featured Stock Update with an annotated graph appeared on 7/16/2013. Click here.
View all notes |
Alert me of new notes |
CANSLIM.net Company Profile |
SEC |
Zacks Reports |
StockTalk |
News |
Chart |
Request a new note
C
A N
S L
I M
|
SSNC
-
NASDAQ
S S & C Technologies
COMPUTER SOFTWARE and SERVICES - Application Software
|
$36.60
|
+0.28
0.77% |
$36.96
|
186,791
47.65% of 50 DAV
50 DAV is 392,000
|
$38.47
-4.86%
|
7/11/2013
|
$35.80
|
PP = $34.54
|
|
MB = $36.27
|
Most Recent Note - 7/23/2013 5:54:28 PM
G - Ended near the session low today with a loss on light volume while retreating near its "max buy" level. Prior highs in the $34 area define initial support to watch on pullbacks.
>>> The latest Featured Stock Update with an annotated graph appeared on 7/12/2013. Click here.
View all notes |
Alert me of new notes |
CANSLIM.net Company Profile |
SEC |
Zacks Reports |
StockTalk |
News |
Chart |
Request a new note
C
A N
S L
I M
|
SSYS
-
NASDAQ
Stratasys Ltd
COMPUTER HARDWARE - Computer Peripherals
|
$86.67
|
-1.02
-1.16% |
$89.47
|
354,276
42.30% of 50 DAV
50 DAV is 837,500
|
$96.44
-10.13%
|
7/8/2013
|
$91.44
|
PP = $95.00
|
|
MB = $99.75
|
Most Recent Note - 7/24/2013 6:24:11 PM
Y - Relative Strength Rating has slumped to 77, below the 80+ minimum guideline for buy candidates while consolidating above support at its 50 DMA line. See the latest FSU analysis for more details and a new annotated graph.
>>> The latest Featured Stock Update with an annotated graph appeared on 7/24/2013. Click here.
View all notes |
Alert me of new notes |
CANSLIM.net Company Profile |
SEC |
Zacks Reports |
StockTalk |
News |
Chart |
Request a new note
C
A N
S L
I M
|
Symbol/Exchange
Company Name
Industry Group |
PRICE |
CHANGE
(%Change) |
Day High |
Volume
(% DAV)
(% 50 day avg vol) |
52 Wk Hi
% From Hi |
Featured
Date |
Price
Featured |
Pivot Featured |
|
Max Buy |
VRX
-
NYSE
Valeant Pharmaceuticals
DRUGS - Drug Manufacturers - Other
|
$91.33
|
+0.84
0.93% |
$91.88
|
1,424,457
70.29% of 50 DAV
50 DAV is 2,026,400
|
$96.25
-5.11%
|
4/30/2013
|
$60.24
|
PP = $76.66
|
|
MB = $80.49
|
Most Recent Note - 7/23/2013 5:47:13 PM
Y- Volume totals have been cooling while consolidating near 52-week high after completing a new Public Offering on 6/18/13 following recent M&A news. Formed a cup-with-handle base over the past 8 weeks, however no new pivot point is being cited. Concerns were raised by its Mar '13 earnings report with only a +14% earnings increase, below the +25% minimum guideline (C criteria) for buy candidates. See latest FSU analysis for more details and a new annotated graph.
>>> The latest Featured Stock Update with an annotated graph appeared on 7/23/2013. Click here.
View all notes |
Alert me of new notes |
CANSLIM.net Company Profile |
SEC |
Zacks Reports |
StockTalk |
News |
Chart |
Request a new note
C
A N
S L
I M
|
YNDX
-
NASDAQ
Yandex N V Class A
INTERNET - Internet Information Providers
|
$30.86
|
-0.59
-1.88% |
$31.59
|
4,660,953
192.21% of 50 DAV
50 DAV is 2,424,900
|
$31.82
-3.02%
|
7/10/2013
|
$29.29
|
PP = $29.59
|
|
MB = $31.07
|
Most Recent Note - 7/24/2013 2:11:17 PM
Y - Color code is changed to yellow as it pulls back below its "max buy" level. Prior highs in the $28-29 area define near-term support to watch.
>>> The latest Featured Stock Update with an annotated graph appeared on 7/10/2013. Click here.
View all notes |
Alert me of new notes |
CANSLIM.net Company Profile |
SEC |
Zacks Reports |
StockTalk |
News |
Chart |
Request a new note
C
A N
S L
I M
|
|
|
|
THESE ARE NOT BUY RECOMMENDATIONS!
Comments contained in the body of this report are technical
opinions only. The material herein has been obtained
from sources believed to be reliable and accurate, however,
its accuracy and completeness cannot be guaranteed.
This site is not an investment advisor, hence it does
not endorse or recommend any securities or other investments.
Any recommendation contained in this report may not
be suitable for all investors and it is not to be deemed
an offer or solicitation on our part with respect to
the purchase or sale of any securities. All trademarks,
service marks and trade names appearing in this report
are the property of their respective owners, and are
likewise used for identification purposes only.
This report is a service available
only to active Paid Premium Members.
You may opt-out of receiving report notifications
at any time. Questions or comments may be submitted
by writing to Premium Membership Services 665 S.E. 10 Street, Suite 201 Deerfield Beach, FL 33441-5634 or by calling 1-800-965-8307
or 954-785-1121.
|
|
|

