You are not logged in.
This means you
CAN ONLY VIEW reports that were published prior to Monday, April 14, 2025.
You
MUST UPGRADE YOUR MEMBERSHIP if you want to see any current reports.
AFTER MARKET UPDATE - TUESDAY, JULY 24TH, 2012
Previous After Market Report Next After Market Report >>>
|
|
|
|
DOW |
-104.14 |
12,617.32 |
-0.82% |
|
Volume |
808,374,380 |
+9% |
|
Volume |
1,678,765,330 |
+10% |
|
NASDAQ |
-27.16 |
2,862.99 |
-0.94% |
|
Advancers |
769 |
24% |
|
Advancers |
690 |
27% |
|
S&P 500 |
-12.21 |
1,338.31 |
-0.90% |
|
Decliners |
2,286 |
72% |
|
Decliners |
1,775 |
69% |
|
Russell 2000 |
-11.15 |
767.75 |
-1.43% |
|
52 Wk Highs |
98 |
|
|
52 Wk Highs |
12 |
|
|
S&P 600 |
-5.93 |
431.13 |
-1.36% |
|
52 Wk Lows |
96 |
|
|
52 Wk Lows |
111 |
|
|
 |
Damage Mounts and Distributional Pressure Squelches Latest Rally
Kenneth J. Gruneisen - Passed the CAN SLIM® Master's Exam
Markets pared their losses in a late-afternoon rally after gradually giving ground throughout Tuesday's session. Behind the session's losses the volume totals rose on both the NYSE and on the Nasdaq exchange, indicating that more distributional selling pressure was coming from the institutional crowd. Decliners trumped advancing issues by approximately 3-1 on the NYSE and on the Nasdaq exchange. The total number of new 52-week highs narrowly led new 52-week lows on the NYSE, however new lows solidly outnumbered new highs on the Nasdaq exchange again. There were 7 high-ranked companies from the CANSLIM.net Leaders List made new 52-week highs and appeared on the CANSLIM.net BreakOuts Page, up from the prior session total of 5 stocks. Waning leadership has been noted as a concern, and at Tuesday's close there were small gains for 4 of the 17 high-ranked companies currently included on the Featured Stocks Page, again demonstrating a disconcertingly negative bias in the market's leading stocks.
Stocks were choppy in early trading as investors digested European concerns amid a bevy of U.S. corporate earnings reports. Looking at Europe, Moody's lowered its outlook for Germany, the Netherlands, and Luxembourg on concerns of a Greek exit from the euro and increased support for troubled periphery nations.
On our shores, economic data was discouraging with manufacturing reports out of the Richmond Fed showing a steep contraction in the region. Despite this, equities rallied into the closing bell after the Wall Street Journal reported that the Federal Reserve was moving closer to action in spurring growth in the economy.
Shares of United Parcel Service Inc (UPS -4.63%) were down after the company reported a disappointing quarter and lowered its full year earnings guidance citing uncertainties in the U.S. and Europe. Also on the downside, Whirlpool Corp (WHR -7.52%) was in the red after falling short of analysts' expectations. On the upside, apparel maker Under Armour Inc (UA +9.12%) was higher following a better-than-expected profit tally and a boost to their full year earnings projections. AT&T Inc (T -2.12%) was in the red following their report.
Damaging distribution coupled with waning leadership has cut short the market's latest confirmed rally and arguably put the major averages back into a "correction". In terms of the M criteria, investors will need to watch for the major averages to halt their slide and subsequently produce a new follow-through day to again confirm that odds are favorable for new buying efforts. In the meanwhile, investors are reminded to ALWAYS limit losses if ever any stock falls more than -7% from their purchase price to steadfastly protect precious capital. Following strict selling rules forces investors to reduce their market exposure and raise cash levels during market downturns.
In August we will begin providing all currently upgraded members access to new monthly webcasts! A new "Market's Leading Groups" archives tab will also soon be added on the Premium Member Homepage. These changes are aimed at satisfying member requests and improving the service. If you have questions, comments or suggestions please let us know via the inquiry form here. The most recent WEBCAST (Q2 2012) is available "ON DEMAND" - CLICK HERE.
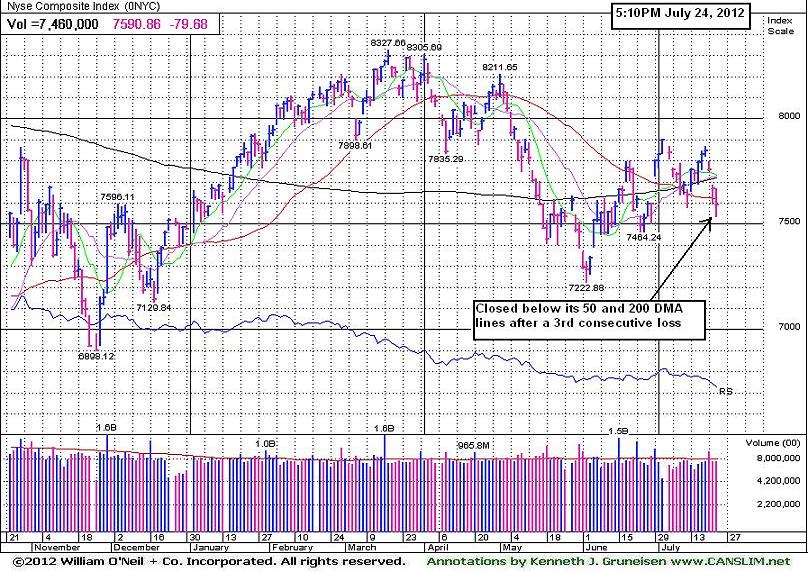
PICTURED: The NYSE Composite Index has slumped below its 50-day and 200-day moving average (DMA) lines with a streak of 3 consecutive losses. The index finished the session +5% above its June 4th low, yet -8.8% off its 2012 high hit on March 19th.
|
 Kenneth J. Gruneisen started out as a licensed stockbroker in August 1987, a couple of months prior to the historic stock market crash that took the Dow Jones Industrial Average down -22.6% in a single day. He has published daily fact-based fundamental and technical analysis on high-ranked stocks online for two decades. Through FACTBASEDINVESTING.COM, Kenneth provides educational articles, news, market commentary, and other information regarding proven investment systems that work in good times and bad.
Comments contained in the body of this report are technical opinions only and are not necessarily those of Gruneisen Growth Corp. The material herein has been obtained from sources believed to be reliable and accurate, however, its accuracy and completeness cannot be guaranteed. Our firm, employees, and customers may effect transactions, including transactions contrary to any recommendation herein, or have positions in the securities mentioned herein or options with respect thereto. Any recommendation contained in this report may not be suitable for all investors and it is not to be deemed an offer or solicitation on our part with respect to the purchase or sale of any securities. |
|
 |
Tech Sector and Energy-Related Shares Led Decliners
Kenneth J. Gruneisen - Passed the CAN SLIM® Master's Exam
The tech sector saw unanimous losses from the Networking Index ($NWX -2.14%), Biotechnology Index ($BTK -1.67%), Internet Index ($IIX -1.13%), and the Semiconductor Index ($SOX -0.40%) with the chip index faring best. Energy-related shares were lower as the Oil Services Index ($OSX -1.62%) and Integrated Oil Index ($XOI -1.36%) each lost more than -1%. There were modest losses for the Retail Index ($RLX -0.64%) and the Broker/Dealer Index ($XBD -0.54%) while the Bank Index ($BKX +0.02%) and the Healthcare Index ($HMO +0.13%) held their ground.
Charts courtesy www.stockcharts.com
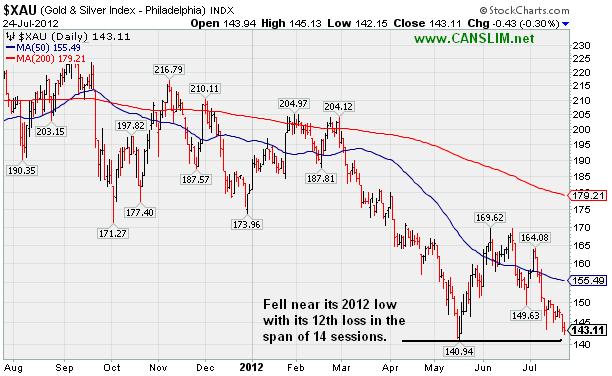
PICTURED: The Gold & Silver Index ($XAU -0.30%) edged lower, sinking near its 2012 low with its 12th loss in the span of 14 sessions. The classic defensive "safe haven" area has been unrewarding for investors over the past year.
| Oil Services |
$OSX |
211.23 |
-3.47 |
-1.62% |
-2.33% |
| Healthcare |
$HMO |
2,380.68 |
+3.16 |
+0.13% |
+4.34% |
| Integrated Oil |
$XOI |
1,161.04 |
-16.06 |
-1.36% |
-5.54% |
| Semiconductor |
$SOX |
360.23 |
-1.43 |
-0.40% |
-1.16% |
| Networking |
$NWX |
185.41 |
-4.06 |
-2.14% |
-13.83% |
| Internet |
$IIX |
289.45 |
-3.32 |
-1.13% |
+2.74% |
| Broker/Dealer |
$XBD |
79.79 |
-0.43 |
-0.54% |
-4.18% |
| Retail |
$RLX |
610.15 |
-3.94 |
-0.64% |
+16.62% |
| Gold & Silver |
$XAU |
143.11 |
-0.43 |
-0.30% |
-20.78% |
| Bank |
$BKX |
44.46 |
+0.01 |
+0.02% |
+12.90% |
| Biotech |
$BTK |
1,442.20 |
-24.55 |
-1.67% |
+32.14% |
|
|
|
 |
Weak Action Hurts Outlook For Computer Software Firm Again
Kenneth J. Gruneisen - Passed the CAN SLIM® Master's Exam
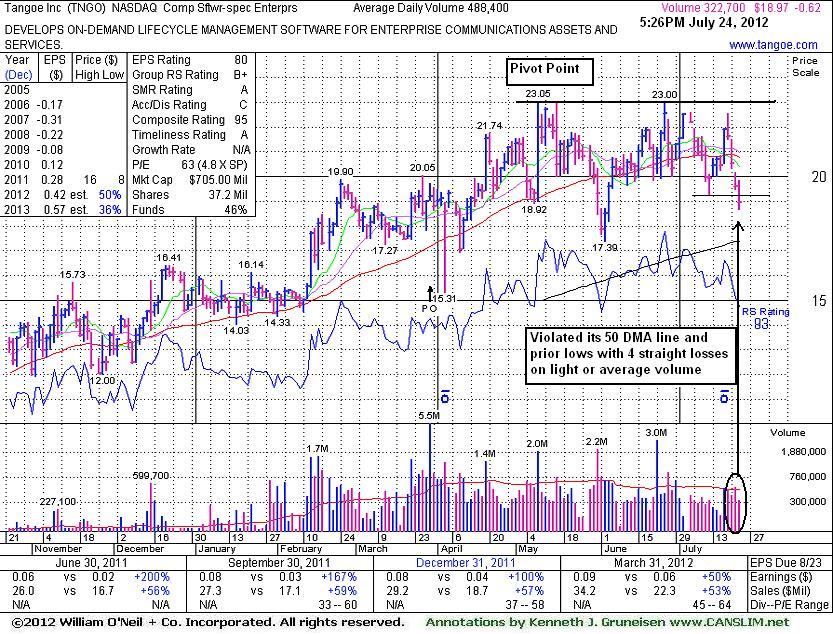
Tangoe Inc (TNGO -$0.62 or -3.16% to $18.97) slumped further below its 50-day moving average (DMA) line today with a 4th consecutive loss on light or average volume, and it also violated recent lows raising more serious concerns. Its next support comes into play near its June low and its 200 DMA line in the $17 area. It faces overhead supply up to the $23 level which has been a stubborn resistance area in recent months. Based on weak action it will be dropped from the Featured Stocks list tonight. A rebound above its 50 DMA line is needed for its technical stance and outlook to improve, meanwhile it may be vulnerable to greater damage.
TNGO was last shown in this FSU section on 6/28/12 with an annotated graph under the headline, "Failed to Trigger New Buy Signal Since Returning", and although little resistance remained due to overhead supply it failed to produce a volume-driven gain above its pivot point to trigger a technical buy signal. Keep in mind that 3 out of 4 stocks tend to go in the direction of the major averages. During the recent rally few leaders made meaningful advances, and now the broader market conditions (M criteria) are arguing against any new buying efforts again until a new confirmed rally with follow-through day.
TNGO completed a new Public Offering on 3/29/12, and such offerings often help companies attract more institutional interest. The number of top-rated funds owning its shares rose from 99 in Sep '11 to 194 in Jun '12, a reassuring sign concerning the I criteria. The company's management reportedly still owns 20% of its shares, keeping the directors motivated to look after and build shareholder value. There still are only 29.7 million shares (S criteria) in the publicly traded float following the latest offering, which can lead to more drastic price volatility in the event of institutional buying or selling.
 |
|
|
Color Codes Explained :
Y - Better candidates highlighted by our
staff of experts.
G - Previously featured
in past reports as yellow but may no longer be buyable under the
guidelines.
***Last / Change / Volume data in this table is the closing quote data***
Symbol/Exchange
Company Name
Industry Group |
PRICE |
CHANGE
(%Change) |
Day High |
Volume
(% DAV)
(% 50 day avg vol) |
52 Wk Hi
% From Hi |
Featured
Date |
Price
Featured |
Pivot Featured |
|
Max Buy |
ALXN
-
NASDAQ
Alexion Pharmaceuticals
DRUGS - Drug Manufacturers - Other
|
$97.62
|
-0.82
-0.83% |
$98.94
|
2,089,661
94.22% of 50 DAV
50 DAV is 2,217,800
|
$104.38
-6.48%
|
5/1/2012
|
$91.73
|
PP = $95.11
|
|
MB = $99.87
|
Most Recent Note - 7/20/2012 5:34:06 PM
Y - Volume totals have been cooling in recent weeks while consolidating above prior highs in the $95 area and its 50 DMA line defining important chart support. No resistance remains due to overhead supply.
>>> The latest Featured Stock Update with an annotated graph appeared on 6/29/2012. Click here.
View all notes |
Alert me of new notes |
CANSLIM.net Company Profile |
SEC |
Zacks Reports |
StockTalk |
News |
Chart |
Request a new note
C
A N
S L
I M


|
ASPS
-
NASDAQ
Altisource Ptf Sltns Sa
REAL ESTATE - Property Management/Developmen
|
$73.80
|
-0.64
-0.86% |
$74.57
|
101,478
78.54% of 50 DAV
50 DAV is 129,200
|
$76.40
-3.40%
|
6/5/2012
|
$60.01
|
PP = $63.00
|
|
MB = $66.15
|
Most Recent Note - 7/20/2012 5:36:17 PM
G - Holding its ground perched near its all-time high, extended from its prior base, and recent gains lacked great volume conviction. Prior highs in the $65 area and its 50 DMA line define near-term support to watch.
>>> The latest Featured Stock Update with an annotated graph appeared on 7/3/2012. Click here.
View all notes |
Alert me of new notes |
CANSLIM.net Company Profile |
SEC |
Zacks Reports |
StockTalk |
News |
Chart |
Request a new note
C
A N
S L
I M
|
CERN
-
NASDAQ
Cerner Corp
COMPUTER SOFTWARE and SERVICES - Healthcare Information Service
|
$75.48
|
-0.96
-1.26% |
$76.61
|
1,053,632
76.21% of 50 DAV
50 DAV is 1,382,500
|
$88.32
-14.54%
|
6/7/2012
|
$78.36
|
PP = $84.20
|
|
MB = $88.41
|
 Most Recent Note - 7/24/2012 4:04:43 PM
It faces overhead supply up through $88 that may act as resistance and it needs to rebound above its 50 DMA line for its outlook to improve. Based on weak action it will be dropped from the Featured Stocks list tonight.
>>> The latest Featured Stock Update with an annotated graph appeared on 7/9/2012. Click here.
View all notes |
Alert me of new notes |
CANSLIM.net Company Profile |
SEC |
Zacks Reports |
StockTalk |
News |
Chart |
Request a new note
C
A N
S L
I M
|
CFNL
-
NASDAQ
Cardinal Financial Corp
BANKING - Regional - Southeast Banks
|
$12.41
|
-0.20
-1.59% |
$12.65
|
116,111
150.01% of 50 DAV
50 DAV is 77,400
|
$13.21
-6.06%
|
7/20/2012
|
$12.85
|
PP = $12.41
|
|
MB = $13.03
|
Most Recent Note - 7/24/2012 4:01:11 PM
Y - Encountering distributional pressure since featured in the 7/20/12 mid-day report. It has earned high ranks and matches favorably with the C and A criteria. Volume-driven gains are needed to confirm a proper technical buy signal. Recently wedged into new high territory with gains lacking great volume conviction. Careful investors may consider a tactic they teach in the Certification called "pyramiding" to let market action dictate buying efforts.

There are no Featured Stock Updates™ available for this stock at this time. You may request one by clicking the Request a New Note link below
View all notes |
Alert me of new notes |
CANSLIM.net Company Profile |
SEC |
Zacks Reports |
StockTalk |
News |
Chart |
Request a new note
C
A N
S L
I M
|
CMCSA
-
NASDAQ
Comcast Corp Cl A
MEDIA - CATV Systems
|
$31.40
|
+0.03
0.10% |
$31.49
|
13,641,474
102.30% of 50 DAV
50 DAV is 13,334,700
|
$32.78
-4.21%
|
6/11/2012
|
$29.94
|
PP = $30.98
|
|
MB = $32.53
|
Most Recent Note - 7/20/2012 5:38:02 PM
Y - Hovering in a tight range near its 52-week high, holding ground above its pivot point. No overhead supply remains to act as resistance and it is still trading below its "max buy" level.
>>> The latest Featured Stock Update with an annotated graph appeared on 7/11/2012. Click here.
View all notes |
Alert me of new notes |
CANSLIM.net Company Profile |
SEC |
Zacks Reports |
StockTalk |
News |
Chart |
Request a new note
C
A N
S L
I M
|
Symbol/Exchange
Company Name
Industry Group |
PRICE |
CHANGE
(%Change) |
Day High |
Volume
(% DAV)
(% 50 day avg vol) |
52 Wk Hi
% From Hi |
Featured
Date |
Price
Featured |
Pivot Featured |
|
Max Buy |
CSTR
-
NASDAQ
Coinstar Inc
DIVERSIFIED SERVICES - Personal Services
|
$60.65
|
+0.14
0.23% |
$61.21
|
894,544
82.02% of 50 DAV
50 DAV is 1,090,700
|
$71.82
-15.55%
|
6/26/2012
|
$64.05
|
PP = $67.00
|
|
MB = $70.35
|
Most Recent Note - 7/24/2012 4:03:49 PM
It needs to rebound above its 50 DMA line for its technical stance and outlook to improve. It faces overhead supply up through the $71 area that may act as resistance. Based on weak action it will be dropped from the Featured Stocks list tonight.
>>> The latest Featured Stock Update with an annotated graph appeared on 7/23/2012. Click here.
View all notes |
Alert me of new notes |
CANSLIM.net Company Profile |
SEC |
Zacks Reports |
StockTalk |
News |
Chart |
Request a new note
C
A N
S L
I M
|
CTRX
-
NASDAQ
Catamaran Corp
COMPUTER SOFTWARE and SERVICES - Healthcare Information Service
|
$84.29
|
-1.51
-1.76% |
$86.94
|
967,626
82.27% of 50 DAV
50 DAV is 1,176,200
|
$104.79
-19.56%
|
6/14/2012
|
$94.71
|
PP = $100.60
|
|
MB = $105.63
|
Most Recent Note - 7/24/2012 3:56:51 PM
It faces overhead supply up through the $100 level that may now act as resistance. A rebound above the 50 DMA line is needed to improve its technical stance. Based on weak action it will be dropped from the Featured Stocks list tonight.
>>> The latest Featured Stock Update with an annotated graph appeared on 7/16/2012. Click here.
View all notes |
Alert me of new notes |
CANSLIM.net Company Profile |
SEC |
Zacks Reports |
StockTalk |
News |
Chart |
Request a new note
C
A N
S L
I M
|
DG
-
NYSE
Dollar General Corp
RETAIL - Discount, Variety Stores
|
$52.48
|
+0.16
0.31% |
$52.94
|
3,725,606
96.73% of 50 DAV
50 DAV is 3,851,600
|
$56.04
-6.35%
|
7/16/2012
|
$54.68
|
PP = $56.14
|
|
MB = $58.95
|
Most Recent Note - 7/24/2012 4:09:34 PM
Y - Halted its slide near its 50 DMA line after encountering distributional pressure while retreating from its all-time high. A violation of its short-term average would raise more serious concerns. It did not register volume-driven gains above its new pivot point to trigger a new (or add-on) technical buy signal.
>>> The latest Featured Stock Update with an annotated graph appeared on 7/12/2012. Click here.
View all notes |
Alert me of new notes |
CANSLIM.net Company Profile |
SEC |
Zacks Reports |
StockTalk |
News |
Chart |
Request a new note
C
A N
S L
I M
|
ECHO
-
NASDAQ
Echo Global Logistics
DIVERSIFIED SERVICES - Business/Management Services
|
$16.95
|
-0.29
-1.68% |
$17.53
|
106,803
76.40% of 50 DAV
50 DAV is 139,800
|
$19.97
-15.12%
|
6/22/2012
|
$18.98
|
PP = $19.48
|
|
MB = $20.45
|
Most Recent Note - 7/24/2012 3:54:15 PM
It may find support near its 200 DMA line, but it needs gains back above its 50 DMA line for its outlook to improve and it faces overhead supply up through the $19-20 area that may now act as resistance. It will be dropped from the Featured Stocks list tonight.
>>> The latest Featured Stock Update with an annotated graph appeared on 7/20/2012. Click here.
View all notes |
Alert me of new notes |
CANSLIM.net Company Profile |
SEC |
Zacks Reports |
StockTalk |
News |
Chart |
Request a new note
C
A N
S L
I M
|
EXPE
-
NASDAQ
Expedia Inc
INTERNET - Internet Information Providers
|
$46.32
|
-0.06
-0.13% |
$47.08
|
3,243,806
87.82% of 50 DAV
50 DAV is 3,693,700
|
$50.66
-8.57%
|
4/27/2012
|
$41.80
|
PP = $35.57
|
|
MB = $37.35
|
Most Recent Note - 7/23/2012 10:34:18 AM
G -Today's gap down and loss has it slumping back below its 50 DMA line. Prior low ($43.44 on 7/13/12) defines the next important support level to watch.
>>> The latest Featured Stock Update with an annotated graph appeared on 7/10/2012. Click here.
View all notes |
Alert me of new notes |
CANSLIM.net Company Profile |
SEC |
Zacks Reports |
StockTalk |
News |
Chart |
Request a new note
C
A N
S L
I M
|
Symbol/Exchange
Company Name
Industry Group |
PRICE |
CHANGE
(%Change) |
Day High |
Volume
(% DAV)
(% 50 day avg vol) |
52 Wk Hi
% From Hi |
Featured
Date |
Price
Featured |
Pivot Featured |
|
Max Buy |
GNC
-
NYSE
G N C Holdings Inc
RETAIL - Drug Stores
|
$37.31
|
-0.09
-0.24% |
$37.85
|
1,537,721
67.44% of 50 DAV
50 DAV is 2,280,300
|
$42.70
-12.62%
|
6/29/2012
|
$39.20
|
PP = $40.00
|
|
MB = $42.00
|
Most Recent Note - 7/23/2012 6:42:23 PM
G - Slumped further below its pivot point and under its 50 DMA line today. Its color code is changed to green, yet its finish in the upper third of its intra-day range indicated that it was finding some support. Disciplined investors always limit losses if any stock falls more than -7% from their purchase price.
>>> The latest Featured Stock Update with an annotated graph appeared on 7/5/2012. Click here.
View all notes |
Alert me of new notes |
CANSLIM.net Company Profile |
SEC |
Zacks Reports |
StockTalk |
News |
Chart |
Request a new note
C
A N
S L
I M
|
GPX
-
NYSE
G P Strategies Corp
DIVERSIFIED SERVICES - Education and Training Services
|
$17.02
|
+0.02
0.12% |
$17.11
|
68,949
120.54% of 50 DAV
50 DAV is 57,200
|
$18.99
-10.37%
|
6/29/2012
|
$18.01
|
PP = $18.15
|
|
MB = $19.06
|
Most Recent Note - 7/23/2012 6:44:08 PM
Y - Slumped further toward its 50 DMA line today with a loss on slightly higher volume. Recent losses completely negated the prior breakout and raised concerns. Disciplined investors always limit losses by selling any stock if it falls more than -7% from their purchase price.
>>> The latest Featured Stock Update with an annotated graph appeared on 7/6/2012. Click here.
View all notes |
Alert me of new notes |
CANSLIM.net Company Profile |
SEC |
Zacks Reports |
StockTalk |
News |
Chart |
Request a new note
C
A N
S L
I M
|
N
-
NYSE
Netsuite Inc
DIVERSIFIED SERVICES - Business/Management Services
|
$48.75
|
-0.50
-1.02% |
$49.52
|
250,501
43.22% of 50 DAV
50 DAV is 579,600
|
$56.06
-13.04%
|
6/20/2012
|
$51.83
|
PP = $51.88
|
|
MB = $54.47
|
Most Recent Note - 7/23/2012 6:47:31 PM
Y - Finished near the session high today after trading under its 50 DMA line and recent lows defining important near-term support. More damaging losses would raise serious concerns and trigger a worrisome technical sell signal.
>>> The latest Featured Stock Update with an annotated graph appeared on 7/19/2012. Click here.
View all notes |
Alert me of new notes |
CANSLIM.net Company Profile |
SEC |
Zacks Reports |
StockTalk |
News |
Chart |
Request a new note
C
A N
S L
I M
|
NSM
-
NYSE
Nationstar Mtg Hldgs Inc
FINANCIAL SERVICES - Credit Services
|
$22.99
|
-1.17
-4.84% |
$23.89
|
1,523,522
190.70% of 50 DAV
50 DAV is 798,900
|
$25.11
-8.44%
|
6/27/2012
|
$20.29
|
PP = $20.46
|
|
MB = $21.48
|
Most Recent Note - 7/24/2012 10:36:26 AM
G - Gapped down today, retreating from its 52-week high after proposing an Offering of $100 million of Senior Notes. It has recently been noted - "Extended from its prior base. Prior highs and its 50 DMA line in the $20 area define important support to watch on pullbacks."
>>> The latest Featured Stock Update with an annotated graph appeared on 6/27/2012. Click here.
View all notes |
Alert me of new notes |
CANSLIM.net Company Profile |
SEC |
Zacks Reports |
StockTalk |
News |
Chart |
Request a new note
C
A N
S L
I M
|
TDG
-
NYSE
Transdigm Group Inc
AEROSPACE/DEFENSE - Aerospace/Defense Products and; Services
|
$120.01
|
-8.72
-6.77% |
$129.14
|
1,874,147
399.69% of 50 DAV
50 DAV is 468,900
|
$136.34
-11.98%
|
6/18/2012
|
$127.00
|
PP = $132.79
|
|
MB = $139.43
|
Most Recent Note - 7/24/2012 3:43:40 PM
G - Color code is changed to green while a damaging loss today with heavy volume violated its 50 DMA line triggering a technical sell signal.
>>> The latest Featured Stock Update with an annotated graph appeared on 7/18/2012. Click here.
View all notes |
Alert me of new notes |
CANSLIM.net Company Profile |
SEC |
Zacks Reports |
StockTalk |
News |
Chart |
Request a new note
C
A N
S L
I M
|
Symbol/Exchange
Company Name
Industry Group |
PRICE |
CHANGE
(%Change) |
Day High |
Volume
(% DAV)
(% 50 day avg vol) |
52 Wk Hi
% From Hi |
Featured
Date |
Price
Featured |
Pivot Featured |
|
Max Buy |
TNGO
-
NASDAQ
Tangoe Inc
COMPUTER SOFTWARE and SERVICES - Technical and System Software
|
$18.97
|
-0.62
-3.16% |
$19.85
|
325,981
66.74% of 50 DAV
50 DAV is 488,400
|
$23.05
-17.70%
|
6/27/2012
|
$21.70
|
PP = $23.15
|
|
MB = $24.31
|
Most Recent Note - 7/24/2012 4:06:24 PM
Slumped further below its 50 DMA line today and violated recent lows raising more serious concerns. Its next support comes into play near its June low and its 200 DMA line in the $17 area. Faces overhead supply up to the $23 level which has been a stubborn resistance area in recent months. Based on weak action it will be dropped from the Featured Stocks list tonight.
>>> The latest Featured Stock Update with an annotated graph appeared on 7/24/2012. Click here.
View all notes |
Alert me of new notes |
CANSLIM.net Company Profile |
SEC |
Zacks Reports |
StockTalk |
News |
Chart |
Request a new note
C
A N
S L
I M
|
VSI
-
NYSE
Vitamin Shoppe Inc
SPECIALTY RETAIL - Specialty Retail, Other
|
$53.91
|
-0.41
-0.75% |
$55.24
|
150,848
39.32% of 50 DAV
50 DAV is 383,600
|
$58.22
-7.40%
|
6/29/2012
|
$54.93
|
PP = $55.03
|
|
MB = $57.78
|
Most Recent Note - 7/23/2012 4:41:11 PM
Y - Managed a positive reversal today after slumping to its 50 DMA line. That important short-term average defines important support where a violation would raise concerns and trigger a technical sell signal. Recent gains after forming an 8-week cup-with-handle base lacked the volume required to trigger a proper new (or add-on) technical buy signal.
>>> The latest Featured Stock Update with an annotated graph appeared on 7/2/2012. Click here.
View all notes |
Alert me of new notes |
CANSLIM.net Company Profile |
SEC |
Zacks Reports |
StockTalk |
News |
Chart |
Request a new note
C
A N
S L
I M
|
|
|
|
THESE ARE NOT BUY RECOMMENDATIONS!
Comments contained in the body of this report are technical
opinions only. The material herein has been obtained
from sources believed to be reliable and accurate, however,
its accuracy and completeness cannot be guaranteed.
This site is not an investment advisor, hence it does
not endorse or recommend any securities or other investments.
Any recommendation contained in this report may not
be suitable for all investors and it is not to be deemed
an offer or solicitation on our part with respect to
the purchase or sale of any securities. All trademarks,
service marks and trade names appearing in this report
are the property of their respective owners, and are
likewise used for identification purposes only.
This report is a service available
only to active Paid Premium Members.
You may opt-out of receiving report notifications
at any time. Questions or comments may be submitted
by writing to Premium Membership Services 665 S.E. 10 Street, Suite 201 Deerfield Beach, FL 33441-5634 or by calling 1-800-965-8307
or 954-785-1121.
|
|
|

