You are not logged in.
This means you
CAN ONLY VIEW reports that were published prior to Monday, April 14, 2025.
You
MUST UPGRADE YOUR MEMBERSHIP if you want to see any current reports.
AFTER MARKET UPDATE - FRIDAY, JULY 24TH, 2009
Previous After Market Report Next After Market Report >>>
|
|
|
|
DOW |
+23.95 |
9,093.24 |
+0.26% |
|
Volume |
1,023,848,960 |
-27% |
|
Volume |
2,264,731,400 |
-28% |
|
NASDAQ |
-7.64 |
1,965.96 |
-0.39% |
|
Advancers |
1,915 |
61% |
|
Advancers |
1,475 |
52% |
|
S&P 500 |
+2.97 |
979.26 |
+0.30% |
|
Decliners |
1,083 |
35% |
|
Decliners |
1,195 |
42% |
|
Russell 2000 |
+2.61 |
548.46 |
+0.48% |
|
52 Wk Highs |
63 |
|
|
52 Wk Highs |
69 |
|
|
S&P 600 |
+1.26 |
290.96 |
+0.43% |
|
52 Wk Lows |
4 |
|
|
52 Wk Lows |
11 |
|
|
 |
Volume Recedes As Indices Close Mixed
Kenneth J. Gruneisen - Passed the CAN SLIM® Master's Exam
Volume totals Friday on the NYSE and the Nasdaq exchange were reported lighter than the prior session totals while advancers led decliners on the NYSE by almost 2-to-1 ratio but by a narrower 5-to-4 ratio on the Nasdaq exchange. There were 28 high-ranked companies from the CANSLIM.net Leaders List that made a new 52-week high and appeared on the CANSLIM.net BreakOuts Page, down from the 58 issues that appeared on the prior session. On both exchanges new 52-week highs substantially outpaced new 52-week lows. The past 2 weeks have brought a great improvement in the market environment (the M criteria), with very encouraging indication of heavier buying demand coming into stocks from institutional investors.
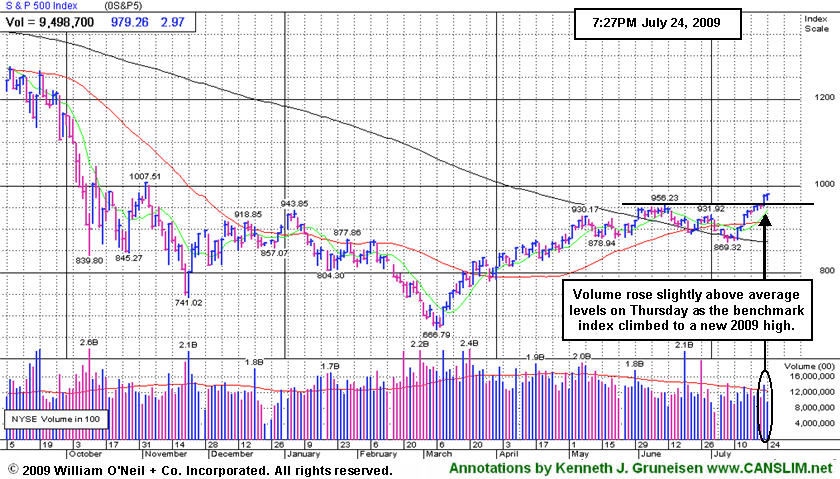
Stocks began the week carrying over their upward momentum from the prior week's big gains, rising across the board on Monday after a majority of the overseas markets posted strong gains. Volume increased behind gains on Tuesday after Federal Reserve Chairman Ben S. Bernanke said the economy is showing "tentative signs of stabilization," and that "limited inflation pressures" will allow policy makers to keep interest rates near zero for an "extended period." On Thursday new 52-week highs were in the triple digits while new 52-week lows were in the single digits on both exchanges, breadth was very positive, and volume surged to above average levels behind gains that were clearly indicative of institutional accumulation. News on the merger and acquisition front sparked additional enthusiasm.
Microsoft Corp's (MSFT -8.26%) double-digit percentage decline in revenue put tech stocks under pressure for Friday's session and broke the Nasdaq Composite's remarkable 12 session winning streak. The Dow and S&P 500 Index reversed early losses and finished the session with small gains. Online retailer Amazon.com (AMZN -7.86%) pulled back after in-line earnings. Capital One (COF +8.05%) rose after the consumer finance firm reported a second quarter loss that was not as bad as expected. Health care shares provided some leadership after a leader of House fiscal conservatives said health care reform talks fell apart and he sees no possibility of a deal.
New home sales data for June is due on Monday, along with another batch of quarterly announcements. Watching the market reaction to earnings reports and guidance is critical during earnings season, as always.
PICTURED: The S&P 500 Index edged higher on lighter volume on Friday. Volume on Thursday was slightly above average as the benchmark index climbed to a new 2009 high.
Attention: Institutional Investors
To inquire about money management services specifically designed for your needs, please email ASarhan@sourcegrp.com.
|
 Kenneth J. Gruneisen started out as a licensed stockbroker in August 1987, a couple of months prior to the historic stock market crash that took the Dow Jones Industrial Average down -22.6% in a single day. He has published daily fact-based fundamental and technical analysis on high-ranked stocks online for two decades. Through FACTBASEDINVESTING.COM, Kenneth provides educational articles, news, market commentary, and other information regarding proven investment systems that work in good times and bad.
Comments contained in the body of this report are technical opinions only and are not necessarily those of Gruneisen Growth Corp. The material herein has been obtained from sources believed to be reliable and accurate, however, its accuracy and completeness cannot be guaranteed. Our firm, employees, and customers may effect transactions, including transactions contrary to any recommendation herein, or have positions in the securities mentioned herein or options with respect thereto. Any recommendation contained in this report may not be suitable for all investors and it is not to be deemed an offer or solicitation on our part with respect to the purchase or sale of any securities. |
|
 |
Medical and Energy Shares Rise
Kenneth J. Gruneisen - Passed the CAN SLIM® Master's Exam
The Biotechnology Index ($BTK +2.41%) and Healthcare Index ($HMO +1.21%) were among Friday's leading gainers, and strength in the energy group gave the Integrated Oil Index ($XOI +0.81%) and Oil Services Index ($OSX +1.22%) a boost. Meanwhile the Semiconductor Index ($SOX -1.26%) slumped and the Internet Index ($IIX -0.27%) and Networking Index ($NWX -0.26%) each ended with small losses. The Broker/Dealer Index ($XBD +0.56%) posted a small gain, meanwhile the Retail Index ($RLX -0.32%) edged lower.
Charts courtesy www.stockcharts.com
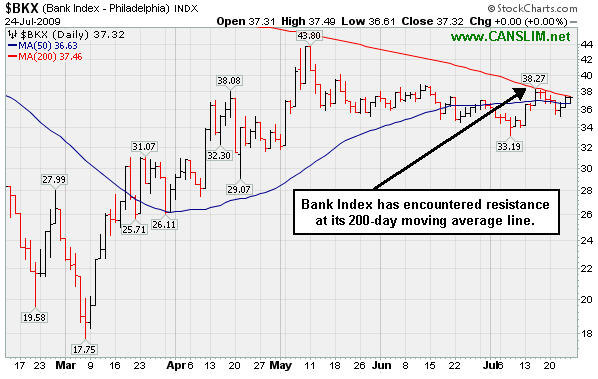
PICTURED: The Bank Index ($BKX +0.00%) ended flat on Friday, and it has been encountering resistance near its 200-day moving average (DMA) line.
| Oil Services |
$OSX |
175.31 |
+2.12 |
+1.22% |
+44.42% |
| Healthcare |
$HMO |
1,119.43 |
+13.36 |
+1.21% |
+16.59% |
| Integrated Oil |
$XOI |
969.16 |
+7.81 |
+0.81% |
-1.07% |
| Semiconductor |
$SOX |
300.88 |
-3.84 |
-1.26% |
+41.81% |
| Networking |
$NWX |
199.57 |
-0.53 |
-0.26% |
+38.70% |
| Internet |
$IIX |
203.83 |
-0.56 |
-0.27% |
+52.37% |
| Broker/Dealer |
$XBD |
105.09 |
+0.59 |
+0.56% |
+35.65% |
| Retail |
$RLX |
351.39 |
-1.14 |
-0.32% |
+25.83% |
| Gold & Silver |
$XAU |
149.50 |
+0.21 |
+0.14% |
+20.71% |
| Bank |
$BKX |
37.32 |
+0.00 |
+0.00% |
-15.79% |
| Biotech |
$BTK |
864.29 |
+20.36 |
+2.41% |
+33.55% |
|
|
|
 |
Positive Reversal For High-Ranked Healthcare Firm
Kenneth J. Gruneisen - Passed the CAN SLIM® Master's Exam
Reversal days are a great way to stay ahead of potential changes to a recent trend. A positive reversal occurs when a stock opens the session heading lower, then reverses and ultimately closes the day higher. Positive reversals are often considered more severe if the stock's initial losses drive it to a new low, but it then reverses and closes the day higher on heavier than average volume and ends near the session's utmost highs. Reversals can occur on a daily, weekly or a monthly chart. In general, when a longer time frame is involved, greater implications may be given as to the severity or significance of the reversal. Volume is directly correlated with the severity of the action as well.
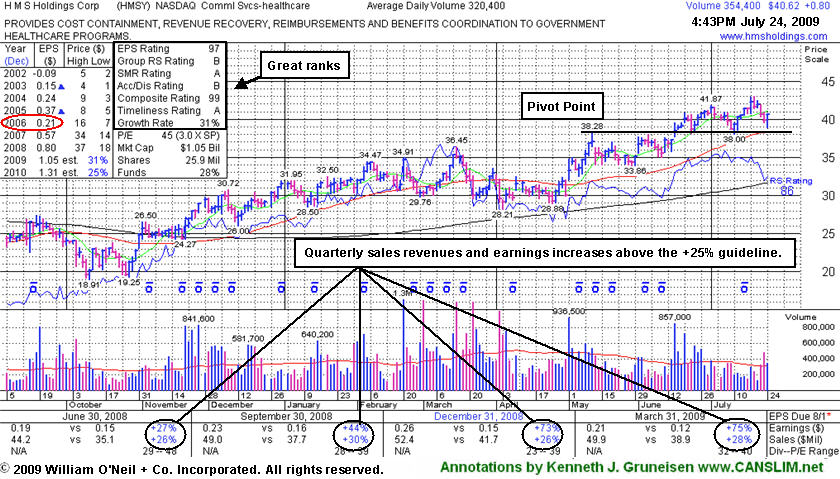
HMS Holdings Corp (HMSY +$0.75 or +1.88% to $40.57) made a positive reversal today after a pullback below its "max buy" level. This high-ranked Commercial Services - Healthcare firm previously tested prior highs in the $38 area -a very important initial support level that also coincides with its 50-day moving average (DMA) line. Deterioration into its prior base, or a violation of its 50 DMA line, would raise more serious concerns and trigger technical sell signals. It has shown healthy action since a gap up gain on 6/16/09 with heavy volume triggered a technical buy signal. The heavy volume and gap up provided a nice reassurance of institutional (the I criteria) buying demand.
Quarterly sales and earnings increases have been above the +25% guideline of the investment system, so it solidly satisfies the C criteria. A downturn in 2006 earnings (see red circle) is a fundamental flaw in HMS Holdings Corp's annual earnings history that raises some concerns with respect to the A criteria of the investment system. Investors' odds are usually better with a company that has a steady 3-5 year earnings growth history. That shortcoming could give investors one extra reason to be very careful about limiting losses.
|
|
|
Color Codes Explained :
Y - Better candidates highlighted by our
staff of experts.
G - Previously featured
in past reports as yellow but may no longer be buyable under the
guidelines.
***Last / Change / Volume quote data in this table corresponds with the timestamp on the note***
Symbol/Exchange
Company Name
Industry Group |
Last |
Chg. |
Vol
% DAV |
Date Featured |
Price Featured |
Latest Pivot Point
Featured |
Status |
| Latest Max Buy Price |
CPLA
- NASDAQ
Capella Education Co
DIVERSIFIED SERVICES - Education and Training Services
|
$61.50
|
-0.50
|
163,041
78% DAV
210,090
|
7/9/2009
(Date
Featured) |
$59.69
(Price
Featured) |
PP = $62.06 |
Y |
| MB = $65.16 |
Most Recent Note - 7/24/2009
Y - Second small loss in a row on light volume. To trigger a technical buy signal, volume should meet or exceeded the +50% above average volume guideline as a stock rises above its pivot point. Featured in yellow in the 7/09/09 Mid-Day BreakOuts Report (read here). The group has shown some leadership, yet currently has a D- for a Relative Strength Rating. CPLA is a high-ranked leader in the Commercial Services-Schools Group. Its small supply of only 13.9 million shares in the float could contribute to greater price volatility in the event of institutional accumulation or distribution. The number of top-rated funds owning an interest rose from 91 in Sept '08, to 132 as of March '09, which is reassuring with respect to the I criteria. It has a very good earnings history that satisfies the C & A criteria, while recent quarters showed steady sales revenues increases in the +17-18% range.
>>> The latest Featured Stock Update with an annotated graph appeared on 7/20/2009. click here.
|
|
C
A
S
I |
News |
Chart |
SEC
View all notes Alert
me of new notes
Company
Profile
|
GMCR
- NASDAQ
Green Mtn Coffee Roastrs
FOOD & BEVERAGE - Processed & Packaged Goods
|
$68.65
|
-0.14
|
924,959
72% DAV
1,284,461
|
7/17/2009
(Date
Featured) |
$60.15
(Price
Featured) |
PP = $63.79 |
G |
| MB = $66.98 |
Most Recent Note - 7/24/2009 4:27:06 PM
G - Quietly held its ground today. Color code was changed to green after it rallied beyond its max buy level with gains on above average volume. Blasted above its pivot point on 7/20/09 to a new all-time high with three times average volume, triggering a technical buy signal. Its recent chart highs may now be viewed as initial support to watch above its 50 DMA line. On 6/09/09 a 3:2 stock split took effect. GMCR traded up more than +158% since appearing with an annotated graph under the headline "It May Soon Be Time To Go Green" when featured in the January 2009 CANSLIM.net News (read here).
>>> The latest Featured Stock Update with an annotated graph appeared on 7/16/2009. click here.
|
|
C
A
S
I |
News |
Chart |
SEC
View all notes Alert
me of new notes
Company
Profile
|
HMSY
- NASDAQ
H M S Holdings Corp
COMPUTER SOFTWARE & SERVICES - Healthcare Information Service
|
$40.57
|
+0.75
|
359,086
113% DAV
317,370
|
2/20/2009
(Date
Featured) |
$34.08
(Price
Featured) |
PP = $38.38 |
G |
| MB = $40.30 |
Most Recent Note - 7/24/2009 4:28:58 PM
G - Positive reversal today after a pullback below its "max buy" level. This high-ranked Commercial Services - Healthcare firm previously tested prior highs in the $38 area -a very important initial support level that also coincides with its 50 DMA line. A gap up gain on 6/16/09 with heavy volume triggered a technical buy signal.
>>> The latest Featured Stock Update with an annotated graph appeared on 7/24/2009. click here.
|
|
C
A
S
I |
News |
Chart |
SEC
View all notes Alert
me of new notes
Company
Profile
|
NTES
- NASDAQ
Netease Inc Adr
INTERNET - Internet Information Providers
|
$42.18
|
-1.19
|
2,596,578
102% DAV
2,540,121
|
7/17/2009
(Date
Featured) |
$39.29
(Price
Featured) |
PP = $38.74 |
G |
| MB = $40.68 |
Most Recent Note - 7/24/2009
G - Consolidating after a streak of 10 consecutive gains capped off with a considerable gain on 7/22/09 with heavy volume that lifted it well above its max buy level. It is extended from its lastest base. On 7/17/09 it broke out from a 5-week flat base with +44% above average volume behind its gain. First featured at $26.75 in the 3/31/09 CANSLIM.net Mid-Day Breakouts Report (read here). This high-ranked Chinese Internet - Content firm was also summarized in greater detail including an annotated graph in the April 2009 issue of CANSLIM.net News (read here).
>>> The latest Featured Stock Update with an annotated graph appeared on 7/23/2009. click here.
|
|
C
A
S
I |
News |
Chart |
SEC
View all notes Alert
me of new notes
Company
Profile
|
NVEC
- NASDAQ
N V E Corp
ELECTRONICS - Semiconductor - Specialized
|
$56.47
|
+0.43
|
130,513
140% DAV
92,974
|
3/13/2009
(Date
Featured) |
$33.85
(Price
Featured) |
PP = $49.60 |
G |
| MB = $52.08 |
Most Recent Note - 7/24/2009
G - Held its ground today. Featured in yellow in the 7/23/09 Mid-Day BreakOuts Report (read here) after it gapped up for a considerable gain on heavy volume following news of stronger sales revenues (+41%) and solid earnings increases for the quarter ended June 30, 2009. The technical action may be considered a "breakaway gap" from a valid ascending base. Color code has been changed to green. Patience may allow for shares to be accumulated on pullbacks, and prior highs are now an important support level. A prior breakout from what was also called an ascending base pattern failed as a wave of distribution smacked it down to support at its 50 DMA line. Quarterly sales revenues in the 6 million dollar range are still rather minuscule, leaving concerns.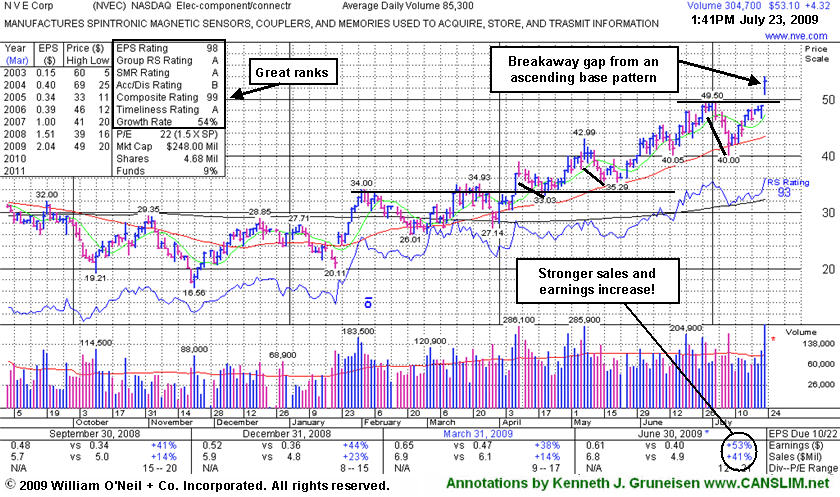
>>> The latest Featured Stock Update with an annotated graph appeared on 7/17/2009. click here.
|
|
C
A
S
I |
News |
Chart |
SEC
View all notes Alert
me of new notes
Company
Profile
|
SNDA
-
|
$57.00
|
-2.77
|
1,658,036
120% DAV
1,379,502
|
5/31/2009
(Date
Featured) |
$57.62
(Price
Featured) |
PP = $65.10 |
G |
| MB = $68.36 |
Most Recent Note - 7/24/2009
G - Down again today after a negative reversal on the prior session, falling near its 50 DMA line - important support to watch now. Color code is changed to green based on distributional action, and it would need to rally above its latest pivot point with conviction to trigger a new technical buy signal. Detailed analysis was included when recently featured in the June 2009 issue of CANSLIM.net News. Be sure to review the "What to Look Out For" section and entire detailed summary - read here).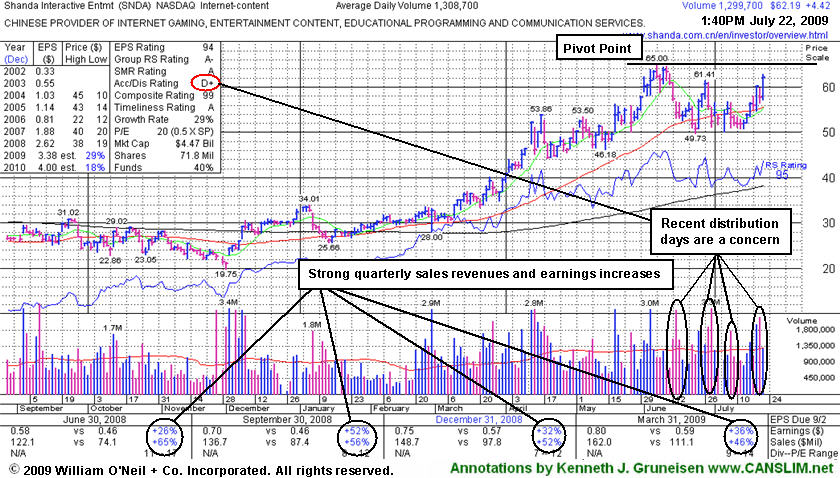
>>> The latest Featured Stock Update with an annotated graph appeared on 7/15/2009. click here.
|
|
C
A
S
I |
News |
Chart |
SEC
View all notes Alert
me of new notes
Company
Profile
|
SYNA
- NASDAQ
Synaptics Inc
COMPUTER SOFTWARE & SERVICES - Information Technology Service
|
$34.79
|
+0.78
|
1,147,994
79% DAV
1,451,962
|
5/18/2009
(Date
Featured) |
$32.58
(Price
Featured) |
PP = $34.52 |
G |
| MB = $36.25 |
Most Recent Note - 7/24/2009 4:38:49 PM
G - Remains below its 50 DMA line, and its outlook would improve if it rises back above that short-term average. First featured in yellow in the May 18, 2009 mid-day report (read here). The number of top-rated funds owning its shares rose from 123 in June '08 to 201 in March '09, which is good news concerning the I criteria. Its annual earnings (the A criteria) history showed a dowturn in 2006, leaving concerns, but it followed that up with strong growth the next 2 years. Its small supply of shares (the S criteria) outstanding could contribute to especially great volatility in the event of institutional accumulation or distribution.
>>> The latest Featured Stock Update with an annotated graph appeared on 7/22/2009. click here.
|
|
C
A
S
I |
News |
Chart |
SEC
View all notes Alert
me of new notes
Company
Profile
|
TNDM
- NASDAQ
Tandem Diabetes Care Inc
TELECOMMUNICATIONS - Wireless Communications
|
$30.47
|
+0.07
|
170,979
18% DAV
950,296
|
3/2/2009
(Date
Featured) |
$18.89
(Price
Featured) |
PP = $29.85 |
G |
| MB = $31.34 |
Most Recent Note - 7/24/2009 4:39:36 PM
G - Quietly consolidating just -6.6% off its all-time high, above its 50 DMA line, building on a choppy base since its June 2nd high of $32.57 was reached. Subsequent deterioration below that short-term average and recent lows would raise concerns and trigger sell signals. It traded up as much as +72.42% since first featured at $18.89 in the 3/02/09 Mid-Day BreakOuts Report (read here).
>>> The latest Featured Stock Update with an annotated graph appeared on 7/21/2009. click here.
|
|
C
A
S
I |
News |
Chart |
SEC
View all notes Alert
me of new notes
Company
Profile
|
|
|
|
THESE ARE NOT BUY RECOMMENDATIONS!
Comments contained in the body of this report are technical
opinions only. The material herein has been obtained
from sources believed to be reliable and accurate, however,
its accuracy and completeness cannot be guaranteed.
This site is not an investment advisor, hence it does
not endorse or recommend any securities or other investments.
Any recommendation contained in this report may not
be suitable for all investors and it is not to be deemed
an offer or solicitation on our part with respect to
the purchase or sale of any securities. All trademarks,
service marks and trade names appearing in this report
are the property of their respective owners, and are
likewise used for identification purposes only.
This report is a service available
only to active Paid Premium Members.
You may opt-out of receiving report notifications
at any time. Questions or comments may be submitted
by writing to Premium Membership Services 665 S.E. 10 Street, Suite 201 Deerfield Beach, FL 33441-5634 or by calling 1-800-965-8307
or 954-785-1121.
|
|
|

