You are not logged in.
This means you
CAN ONLY VIEW reports that were published prior to Monday, April 14, 2025.
You
MUST UPGRADE YOUR MEMBERSHIP if you want to see any current reports.
AFTER MARKET UPDATE - TUESDAY, JULY 23RD, 2013
Previous After Market Report Next After Market Report >>>
|
|
|
|
DOW |
+22.19 |
15,567.74 |
+0.14% |
|
Volume |
623,719,030 |
+7% |
|
Volume |
1,550,531,730 |
+7% |
|
NASDAQ |
-21.12 |
3,579.27 |
-0.59% |
|
Advancers |
1,711 |
55% |
|
Advancers |
1,149 |
45% |
|
S&P 500 |
-3.14 |
1,692.39 |
-0.19% |
|
Decliners |
1,298 |
42% |
|
Decliners |
1,324 |
51% |
|
Russell 2000 |
-1.21 |
1,052.20 |
-0.11% |
|
52 Wk Highs |
266 |
|
|
52 Wk Highs |
287 |
|
|
S&P 600 |
-0.68 |
591.19 |
-0.11% |
|
52 Wk Lows |
28 |
|
|
52 Wk Lows |
12 |
|
|
 |
Indices End Mixed After Choppy Session
Kenneth J. Gruneisen - Passed the CAN SLIM® Master's Exam
The major averages finished Tuesday's session with a mixed result. Volume totals were reported higher than the prior session on the NYSE and on the Nasdaq exchange. Advancers led decliners by almost a 3-2 margin on the NYSE, but on the Nasdaq exchange decliners slightly outnumbered advancers. There were 81 high-ranked companies from the CANSLIM.net Leaders List made new 52-week highs and appeared on the CANSLIM.net BreakOuts Page, down a notch from the prior session total of 82 stocks. The list of stocks hitting new 52-week highs easily outnumbered new 52-week lows on both the NYSE and the Nasdaq exchange. There were gains for only 4 of the 12 high-ranked companies currently included on the Featured Stocks Page.
Stocks were choppy throughout the session as investors digested a batch of mixed earnings and a disappointing result in the Richmond Fed's report on July manufacturing activity. Looking at earnings, Netflix Inc (NFLX -4.47%) fell after the company topped analysts' expectations but saw weaker-than-expected subscriber growth. On the upside, The Wendy's Co (WEN +8.23%) rallied after the company reported better-than-expected results. Shares of Apple Inc (AAPL -1.7%) ended lower ahead of their earnings which were released after the close. On the M&A front, cyber security firm Sourcefire Inc (FIRE +27.78%) rallied on news that it was being acquired by Cisco Systems Inc (CSCO -0.62%).
Turning to fixed income markets, Treasuries were lower along the curve. The benchmark 10-year note was down 7/32 to yield 2.51% and the 30-year bond was off by 1/2 of a point to yield 3.58%.
The market (M criteria) has flashed substantial strength and leadership. Now in a confirmed rally, odds are considered favorable for investors' success with new buying efforts. Investors should be disciplined and selective while looking to be proactive and focused exclusively on the individual leaders best matching the winning models of the fact-based investment system. Study the companies on the CANSLIM.net Featured Stocks Page - a page showing the most action-worthy candidates' latest notes and links to additional resources including detailed analysis with data-packed graphs which are annotated by a Certified expert. The Premium Member Homepage - includes "dynamic archives" to all prior pay reports published. Watch for an announcement via email concerning the next WEBCAST.
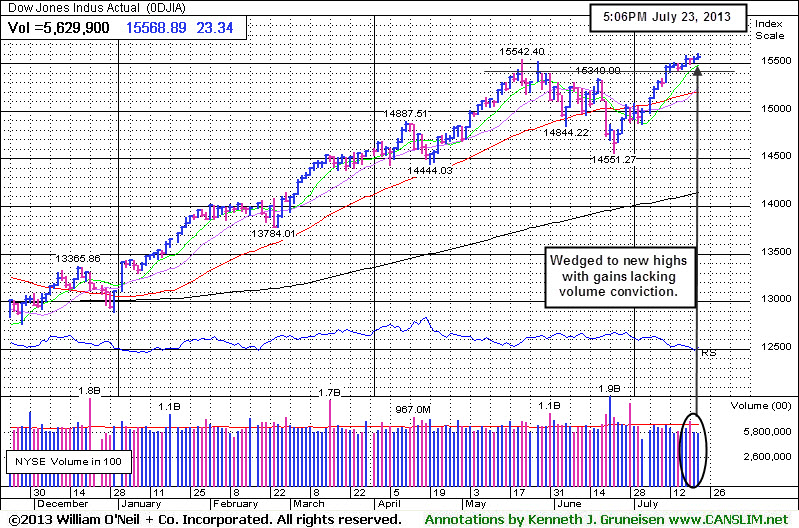
PICTURED: The Dow Jones Industrial Average is perched at all-time high, wedging higher after 4 consecutive weekly gains. The Blue Chip Index is up +18.8% year-to-date.
|
 Kenneth J. Gruneisen started out as a licensed stockbroker in August 1987, a couple of months prior to the historic stock market crash that took the Dow Jones Industrial Average down -22.6% in a single day. He has published daily fact-based fundamental and technical analysis on high-ranked stocks online for two decades. Through FACTBASEDINVESTING.COM, Kenneth provides educational articles, news, market commentary, and other information regarding proven investment systems that work in good times and bad.
Comments contained in the body of this report are technical opinions only and are not necessarily those of Gruneisen Growth Corp. The material herein has been obtained from sources believed to be reliable and accurate, however, its accuracy and completeness cannot be guaranteed. Our firm, employees, and customers may effect transactions, including transactions contrary to any recommendation herein, or have positions in the securities mentioned herein or options with respect thereto. Any recommendation contained in this report may not be suitable for all investors and it is not to be deemed an offer or solicitation on our part with respect to the purchase or sale of any securities. |
|
 |
Gold & Silver Index Rebounds Further Above 50-Day Average
Kenneth J. Gruneisen - Passed the CAN SLIM® Master's Exam
The Gold & Silver Index ($XAU +3.24%) was a standout gainer on Tuesday's mostly quiet session, rallying further after clearing its 50-day moving average (DMA) line on the prior session. The Retail Index ($RLX -0.28%) edged lower and the Healthcare Index ($HMO +0.49%) posted a modest gain. Energy-related shares were mixed as the Integrated Oil Index ($XOI +0.49%) edged higher while the Oil Services Index ($OSX -0.46%) edged lower. The Biotechnology Index ($BTK -2.06%) was a standout laggard with a large loss, and the Internet Index ($IIX -0.56%) and Semiconductor Index ($SOX -0.34%) each edged lower while the Networking Index ($NWX +0.09%) eked out a tiny gain. Financial shares were indecisive as the Broker/Dealer Index ($XBD -0.04%) and the Bank Index ($BKX +0.01%) finished flat.
Charts courtesy www.stockcharts.com
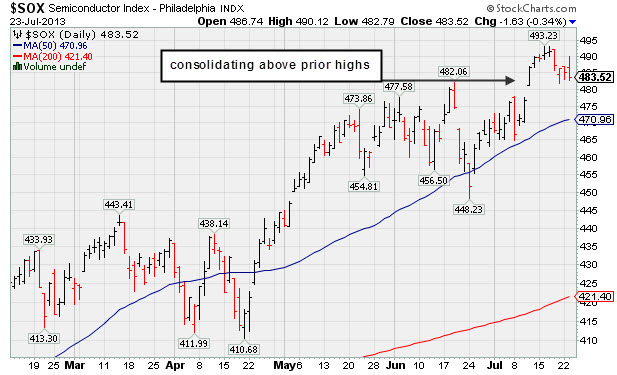
PICTURED: The Semiconductor Index ($SOX -0.34%) is consolidating above prior highs.
| Oil Services |
$OSX |
270.07 |
-1.26 |
-0.46% |
+22.67% |
| Healthcare |
$HMO |
3,463.29 |
+16.88 |
+0.49% |
+37.75% |
| Integrated Oil |
$XOI |
1,412.81 |
+6.94 |
+0.49% |
+13.77% |
| Semiconductor |
$SOX |
483.52 |
-1.63 |
-0.34% |
+25.90% |
| Networking |
$NWX |
284.49 |
+0.26 |
+0.09% |
+25.57% |
| Internet |
$IIX |
401.18 |
-2.25 |
-0.56% |
+22.68% |
| Broker/Dealer |
$XBD |
134.32 |
-0.06 |
-0.04% |
+42.39% |
| Retail |
$RLX |
839.33 |
+1.55 |
+0.19% |
+28.52% |
| Gold & Silver |
$XAU |
103.59 |
+3.25 |
+3.24% |
-37.45% |
| Bank |
$BKX |
66.71 |
+0.01 |
+0.01% |
+30.09% |
| Biotech |
$BTK |
2,127.01 |
-44.66 |
-2.06% |
+37.49% |
|
|
|
 |
Formed New Base But Fundamental Concerns Remain
Kenneth J. Gruneisen - Passed the CAN SLIM® Master's Exam
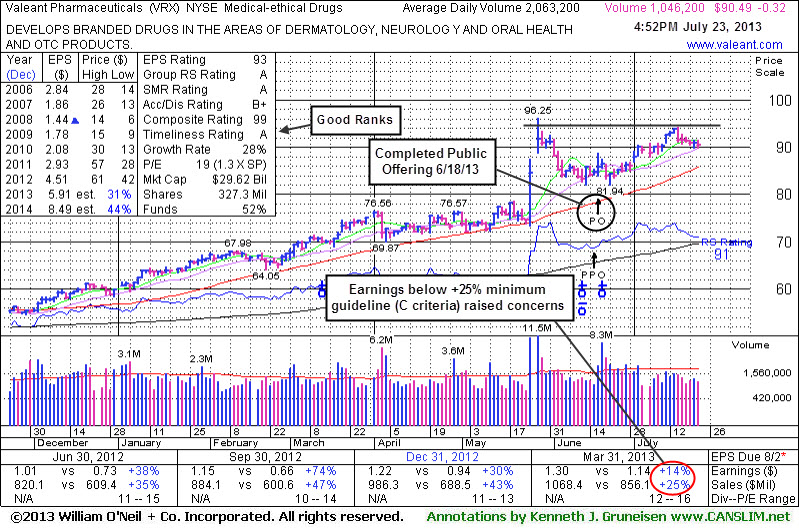
Valeant Pharmaceuticals International, Inc (VRX -$0.32 or -0.35% to $90.49) is hovering within close striking distance of its 52-week high with volume totals cooling in recent weeks. It formed a cup-with-handle base over the past 8 weeks or more, however no new pivot point has been cited. Technically, it looks like a decent set-up with no resistance remaining due to overhead supply. However, fundamentally, concerns were raised by its Mar '13 earnings report with only a +14% earnings increase, below the +25% minimum guideline (C criteria) for buy candidates. It has wedged higher with gains lacking great volume conviction since last shown in this FSU section on 7/05/13 with an annotated graph under the headline, "Holding Ground Following Offering and M&A News".
The high-ranked Medical - Ethical Drugs firm's shares spiked higher in late May at around the time of M&A news that it would buy Bausch & Lomb for $8.7 billion. It completed Public Offering on 6/18/13. The upshot of Public Offerings is that when completed the end result is typically an increase in the total number of institutional owners. Institutional owners are often supportive of their existing positions and will even accumulate more shares when they consolidate near classic support levels like the 50-day and 200-day moving average (DMA) lines, if they are still believers in the company. If too many become pessimistic and decide to unload, this is what ends up sending the stocks slicing through support.
Prior reports noted - "Investors are taught in the Certification to only buy stocks with a combination of both strong fundamentals and strong technical action, however stocks should be sold based on their technical action only. In this example, more bullish action rewarded patient investors still giving it the benefit of the doubt until any technical sell signals start adding up."
Time alone will tell if Valeant's recent acquisitions will result in stronger earnings in the upcoming quarterly comparisons. It will report its Second Quarter results on August 7, 2013. Quarterly earnings increases (C criteria) had been strong and well above the +25% guideline until the Mar '13 period. A downturn in FY '07 and '08 earnings (A criteria) has been followed by a strong earnings rebound in recent years. Return On Equity is currently reported at 37%, well above the 17% minimum guideline of the fact-based system.
The number of top-rated funds owning its shares rose from 818 in Mar '12 in to 998 in Jun '13, a reassuring trend concerning the I criteria. Its current Up/Down Volume Ratio of 2.0 is an unbiased indication that its shares have been under accumulation over the past 50 days.
 |
|
|
Color Codes Explained :
Y - Better candidates highlighted by our
staff of experts.
G - Previously featured
in past reports as yellow but may no longer be buyable under the
guidelines.
***Last / Change / Volume data in this table is the closing quote data***
Symbol/Exchange
Company Name
Industry Group |
PRICE |
CHANGE
(%Change) |
Day High |
Volume
(% DAV)
(% 50 day avg vol) |
52 Wk Hi
% From Hi |
Featured
Date |
Price
Featured |
Pivot Featured |
|
Max Buy |
AMBA
-
NASDAQ
Ambarella Inc
ELECTRONICS - Semiconductor - Specialized
|
$18.72
|
-0.52
-2.70% |
$19.32
|
636,538
50.70% of 50 DAV
50 DAV is 1,255,600
|
$19.44
-3.70%
|
7/15/2013
|
$17.87
|
PP = $18.68
|
|
MB = $19.61
|
 Most Recent Note - 7/23/2013 5:51:11 PM
Y - Holding its ground with volume totals cooling since it broke out from its latest base pattern on 7/17/13 with +65% above average volume triggering a new (or add-on) technical buy signal.
>>> The latest Featured Stock Update with an annotated graph appeared on 7/17/2013. Click here.
View all notes |
Alert me of new notes |
CANSLIM.net Company Profile |
SEC |
Zacks Reports |
StockTalk |
News |
Chart |
Request a new note
C
A N
S L
I M


|
CELG
-
NASDAQ
Celgene Corp
DRUGS - Drug Manufacturers - Major
|
$135.08
|
-3.00
-2.17% |
$138.77
|
1,989,366
66.00% of 50 DAV
50 DAV is 3,014,200
|
$138.67
-2.59%
|
7/11/2013
|
$133.25
|
PP = $131.92
|
|
MB = $138.52
|
Most Recent Note - 7/23/2013 5:52:02 PM
Y - Touched a new high but reversed into the red today. Prior highs define initial support to watch. Breakaway gap and solid gain with twice average volume on 7/11/13 triggered a technical buy signal. Disciplined investors always limit losses by selling if any stock falls more than -7% from their purchase price.
>>> The latest Featured Stock Update with an annotated graph appeared on 7/11/2013. Click here.
View all notes |
Alert me of new notes |
CANSLIM.net Company Profile |
SEC |
Zacks Reports |
StockTalk |
News |
Chart |
Request a new note
C
A N
S L
I M
|
FLT
-
NYSE
Fleetcor Technologies
DIVERSIFIED SERVICES - Business/Management Services
|
$87.08
|
-0.53
-0.60% |
$88.01
|
285,020
36.38% of 50 DAV
50 DAV is 783,400
|
$89.75
-2.97%
|
5/29/2013
|
$86.02
|
PP = $85.66
|
|
MB = $89.94
|
Most Recent Note - 7/18/2013 5:51:55 PM
G- Recently found support near its 50 DMA line with gains lacking volume conviction. Prior low ($80.28 on 6/21/13) defines the next important near-term support where a violation would raise more serious concerns. See the latest FSU analysis for more details and a new annotated graph.
>>> The latest Featured Stock Update with an annotated graph appeared on 7/18/2013. Click here.
View all notes |
Alert me of new notes |
CANSLIM.net Company Profile |
SEC |
Zacks Reports |
StockTalk |
News |
Chart |
Request a new note
C
A N
S L
I M
|
LOPE
-
NASDAQ
Grand Canyon Education
DIVERSIFIED SERVICES - Education and; Training Services
|
$35.76
|
+0.88
2.52% |
$35.86
|
1,114,908
264.01% of 50 DAV
50 DAV is 422,300
|
$36.45
-1.89%
|
6/19/2013
|
$31.47
|
PP = $34.17
|
|
MB = $35.88
|
Most Recent Note - 7/23/2013 12:51:37 PM
Y - Trading up near its "max buy" level with today's gain backed by above average volume. Prior highs in the $34 area define initial support above its 50 DMA line. Reports its second quarter results after market close on Tuesday, July 30, 2013.
>>> The latest Featured Stock Update with an annotated graph appeared on 7/19/2013. Click here.
View all notes |
Alert me of new notes |
CANSLIM.net Company Profile |
SEC |
Zacks Reports |
StockTalk |
News |
Chart |
Request a new note
C
A N
S L
I M
|
PCLN
-
NASDAQ
Priceline.Com Inc
INTERNET - Internet Software and Services
|
$895.79
|
-4.69
-0.52% |
$906.95
|
365,712
49.11% of 50 DAV
50 DAV is 744,700
|
$926.40
-3.30%
|
7/8/2013
|
$878.28
|
PP = $847.43
|
|
MB = $889.80
|
Most Recent Note - 7/19/2013 5:54:01 PM
G - Endured mild distributional pressure this week while consolidating after getting extended from its prior base. Prior highs in the $847 area define initial support to watch on pullbacks.
>>> The latest Featured Stock Update with an annotated graph appeared on 7/9/2013. Click here.
View all notes |
Alert me of new notes |
CANSLIM.net Company Profile |
SEC |
Zacks Reports |
StockTalk |
News |
Chart |
Request a new note
C
A N
S L
I M
|
Symbol/Exchange
Company Name
Industry Group |
PRICE |
CHANGE
(%Change) |
Day High |
Volume
(% DAV)
(% 50 day avg vol) |
52 Wk Hi
% From Hi |
Featured
Date |
Price
Featured |
Pivot Featured |
|
Max Buy |
PRLB
-
NYSE
Proto Labs Inc
MANUFACTURING - Small Tools and Accessories
|
$64.51
|
+0.77
1.21% |
$64.71
|
182,393
40.57% of 50 DAV
50 DAV is 449,600
|
$67.40
-4.29%
|
6/17/2013
|
$59.37
|
PP = $59.94
|
|
MB = $62.94
|
Most Recent Note - 7/19/2013 5:55:47 PM
G - Still holding its ground in a tight rage with volume totals cooling. Prior highs near $59 coincide with its 50 DMA line defining important support.
>>> The latest Featured Stock Update with an annotated graph appeared on 7/15/2013. Click here.
View all notes |
Alert me of new notes |
CANSLIM.net Company Profile |
SEC |
Zacks Reports |
StockTalk |
News |
Chart |
Request a new note
C
A N
S L
I M
|
RRTS
-
NYSE
Roadrunner Trans Systems
TRANSPORTATION - Air Delivery and Freight Service
|
$29.79
|
+0.35
1.19% |
$29.93
|
74,318
46.65% of 50 DAV
50 DAV is 159,300
|
$30.50
-2.33%
|
4/3/2013
|
$22.77
|
PP = $23.75
|
|
MB = $24.94
|
Most Recent Note - 7/22/2013 6:02:05 PM
G - Perched near its 52-week high with volume totals cooling while extended from any sound base. Reports results for the Jun '13 quarter on Wednesday, July 31, 2013 after market close. See the latest FSU analysis for more details and a new annotated graph.
>>> The latest Featured Stock Update with an annotated graph appeared on 7/22/2013. Click here.
View all notes |
Alert me of new notes |
CANSLIM.net Company Profile |
SEC |
Zacks Reports |
StockTalk |
News |
Chart |
Request a new note
C
A N
S L
I M
|
SFUN
-
NYSE
Soufun Hldgs Ltd Ads A
INTERNET - Internet Information Providers
|
$31.12
|
+0.80
2.64% |
$31.31
|
312,188
99.71% of 50 DAV
50 DAV is 313,100
|
$33.03
-5.78%
|
7/16/2013
|
$29.54
|
PP = $27.90
|
|
MB = $29.30
|
Most Recent Note - 7/23/2013 5:53:07 PM
G - Halted its slide with a small gain today after 4 consecutive losses. It is extended from its latest base. Prior highs in the $28-29 area define initial support to watch.
>>> The latest Featured Stock Update with an annotated graph appeared on 7/16/2013. Click here.
View all notes |
Alert me of new notes |
CANSLIM.net Company Profile |
SEC |
Zacks Reports |
StockTalk |
News |
Chart |
Request a new note
C
A N
S L
I M
|
SSNC
-
NASDAQ
S S & C Technologies
COMPUTER SOFTWARE and SERVICES - Application Software
|
$36.32
|
-0.62
-1.68% |
$37.36
|
256,536
63.94% of 50 DAV
50 DAV is 401,200
|
$38.47
-5.59%
|
7/11/2013
|
$35.80
|
PP = $34.54
|
|
MB = $36.27
|
Most Recent Note - 7/23/2013 5:54:28 PM
G - Ended near the session low today with a loss on light volume while retreating near its "max buy" level. Prior highs in the $34 area define initial support to watch on pullbacks.
>>> The latest Featured Stock Update with an annotated graph appeared on 7/12/2013. Click here.
View all notes |
Alert me of new notes |
CANSLIM.net Company Profile |
SEC |
Zacks Reports |
StockTalk |
News |
Chart |
Request a new note
C
A N
S L
I M
|
SSYS
-
NASDAQ
Stratasys Ltd
COMPUTER HARDWARE - Computer Peripherals
|
$87.69
|
-2.58
-2.86% |
$91.03
|
534,847
63.00% of 50 DAV
50 DAV is 849,000
|
$96.44
-9.07%
|
7/8/2013
|
$91.44
|
PP = $95.00
|
|
MB = $99.75
|
Most Recent Note - 7/22/2013 6:06:33 PM
Y - Perched within close striking distance of its 52-week high and previously stubborn resistance in the $92-94 area. Did not yet rally for a close above the pivot point based on its 5/14/13 high plus 10 cents with sufficient volume to clinch a proper technical buy signal.
>>> The latest Featured Stock Update with an annotated graph appeared on 7/8/2013. Click here.
View all notes |
Alert me of new notes |
CANSLIM.net Company Profile |
SEC |
Zacks Reports |
StockTalk |
News |
Chart |
Request a new note
C
A N
S L
I M
|
Symbol/Exchange
Company Name
Industry Group |
PRICE |
CHANGE
(%Change) |
Day High |
Volume
(% DAV)
(% 50 day avg vol) |
52 Wk Hi
% From Hi |
Featured
Date |
Price
Featured |
Pivot Featured |
|
Max Buy |
VRX
-
NYSE
Valeant Pharmaceuticals
DRUGS - Drug Manufacturers - Other
|
$90.49
|
-0.32
-0.35% |
$91.44
|
1,046,243
50.71% of 50 DAV
50 DAV is 2,063,200
|
$96.25
-5.98%
|
4/30/2013
|
$60.24
|
PP = $76.66
|
|
MB = $80.49
|
Most Recent Note - 7/23/2013 5:47:13 PM
Y- Volume totals have been cooling while consolidating near 52-week high after completing a new Public Offering on 6/18/13 following recent M&A news. Formed a cup-with-handle base over the past 8 weeks, however no new pivot point is being cited. Concerns were raised by its Mar '13 earnings report with only a +14% earnings increase, below the +25% minimum guideline (C criteria) for buy candidates. See latest FSU analysis for more details and a new annotated graph.
>>> The latest Featured Stock Update with an annotated graph appeared on 7/23/2013. Click here.
View all notes |
Alert me of new notes |
CANSLIM.net Company Profile |
SEC |
Zacks Reports |
StockTalk |
News |
Chart |
Request a new note
C
A N
S L
I M
|
YNDX
-
NASDAQ
Yandex N V Class A
INTERNET - Internet Information Providers
|
$31.45
|
-0.01
-0.03% |
$31.82
|
3,267,343
136.12% of 50 DAV
50 DAV is 2,400,400
|
$31.57
-0.38%
|
7/10/2013
|
$29.29
|
PP = $29.59
|
|
MB = $31.07
|
Most Recent Note - 7/23/2013 5:49:37 PM
G - Touched a new high today but reversed into the red. Color code is changed to green as it wedged higher above its "max buy" level with gains lacking volume conviction after finding prompt support near prior highs in the $28-29 area.
>>> The latest Featured Stock Update with an annotated graph appeared on 7/10/2013. Click here.
View all notes |
Alert me of new notes |
CANSLIM.net Company Profile |
SEC |
Zacks Reports |
StockTalk |
News |
Chart |
Request a new note
C
A N
S L
I M
|
|
|
|
THESE ARE NOT BUY RECOMMENDATIONS!
Comments contained in the body of this report are technical
opinions only. The material herein has been obtained
from sources believed to be reliable and accurate, however,
its accuracy and completeness cannot be guaranteed.
This site is not an investment advisor, hence it does
not endorse or recommend any securities or other investments.
Any recommendation contained in this report may not
be suitable for all investors and it is not to be deemed
an offer or solicitation on our part with respect to
the purchase or sale of any securities. All trademarks,
service marks and trade names appearing in this report
are the property of their respective owners, and are
likewise used for identification purposes only.
This report is a service available
only to active Paid Premium Members.
You may opt-out of receiving report notifications
at any time. Questions or comments may be submitted
by writing to Premium Membership Services 665 S.E. 10 Street, Suite 201 Deerfield Beach, FL 33441-5634 or by calling 1-800-965-8307
or 954-785-1121.
|
|
|

