You are not logged in.
This means you
CAN ONLY VIEW reports that were published prior to Wednesday, April 23, 2025.
You
MUST UPGRADE YOUR MEMBERSHIP if you want to see any current reports.
AFTER MARKET UPDATE - MONDAY, JULY 23RD, 2012
Previous After Market Report Next After Market Report >>>
|
|
|
|
DOW |
-101.11 |
12,721.46 |
-0.79% |
|
Volume |
743,098,620 |
-26% |
|
Volume |
1,526,687,420 |
-10% |
|
NASDAQ |
-35.15 |
2,890.15 |
-1.20% |
|
Advancers |
712 |
23% |
|
Advancers |
509 |
20% |
|
S&P 500 |
-12.14 |
1,350.52 |
-0.89% |
|
Decliners |
2,344 |
74% |
|
Decliners |
1,990 |
77% |
|
Russell 2000 |
-12.64 |
778.90 |
-1.60% |
|
52 Wk Highs |
100 |
|
|
52 Wk Highs |
13 |
|
|
S&P 600 |
-6.57 |
437.06 |
-1.48% |
|
52 Wk Lows |
93 |
|
|
52 Wk Lows |
103 |
|
|
 |
Major Indices Ended Above Session Lows With Lighter Volume Totals
Kenneth J. Gruneisen - Passed the CAN SLIM® Master's Exam
On Monday's session the indices ended above their worst lows but suffered damaging losses. Volume totals behind the losses were lighter on the NYSE and on the Nasdaq exchange, however, after Friday's totals had been inflated by options expirations. Decliners trumped advancing issues by more than 3-1 on the NYSE and by nearly 4-1 on the Nasdaq exchange. The total number of new 52-week highs led new 52-week lows on the NYSE, however new lows outnumbered new highs on the Nasdaq exchange. There were 5 high-ranked companies from the CANSLIM.net Leaders List made new 52-week highs and appeared on the CANSLIM.net BreakOuts Page, down from the prior session total of 22 stocks. Waning leadership is a concern, and at Monday's close there were gains for only 2 of the 17 high-ranked companies currently included on the Featured Stocks Page, again demonstrating a disconcertingly negative bias in the market's leading stocks.
Stocks were under pressure from the opening bell as fears over Europe's debt crisis were heightened. Concerns of Spain's financial health were renewed on reports that regional governments would seek bailout aid from Madrid. A Greek exit from the common currency region was also a focus after Germany's Vice Chancellor speculated that the country would be unable to meet the terms of their aid package.
On our shores, all 10 sectors on the S&P traded lower. Material stocks showed weakness after a member of China's monetary policy committee said that economic growth in the country could slow more than expected in the quarter. Freeport-McMoRan Copper & Gold Inc (FCX -3.41%) fell. On the earnings front, McDonald's Corp (MCD -2.88%) fell after the company missed analysts' expectations in the quarter. Energy stocks were also under pressure as crude oil prices slipped $3.40 to $88.43 per barrel.
Turning to fixed income, Treasuries were higher with the benchmark 10-year note up 3/16 of a point to yield 1.44%.
Investors are always reminded to limit losses if ever any stock falls more than -7% from their purchase price to steadfastly protect precious capital. The upward trend concerning the M criteria endured recent pressure, and thus far into the Q2 earnings season the market's rally has been sputtering. New buying efforts may only be justified in worthy buy candidates with strong fundamental and technical characteristics matching all key investment criteria. The best buy candidates identified by CANSLIM.net's experts are always viewable on the Featured Stocks page.
In August we will begin providing all currently upgraded members access to new monthly webcasts! A new "Market's Leading Groups" archives tab will also soon be added on the Premium Member Homepage. These changes are aimed at satisfying member requests and improving the service. If you have questions, comments or suggestions please let us know via the inquiry form here. The most recent WEBCAST (Q2 2012) is available "ON DEMAND" - CLICK HERE.
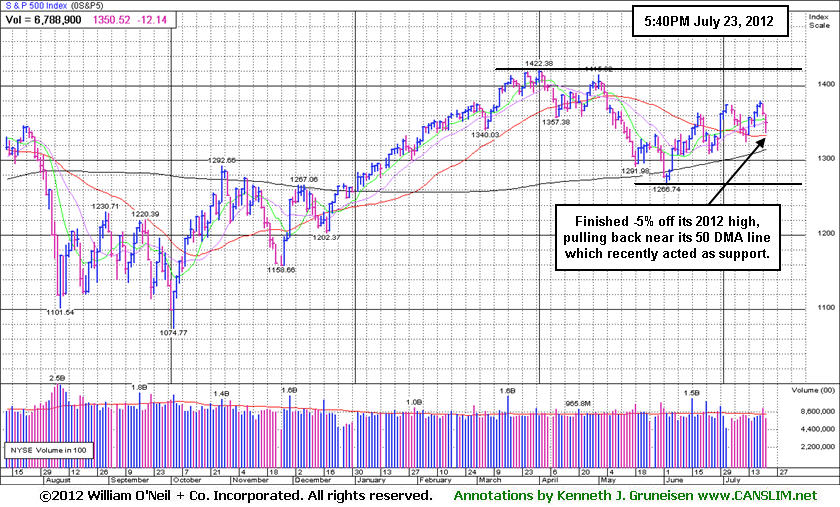
PICTURED: The S&P 500 Index fell today and ended -5% off its 2012 high, pulling back near its 50-day moving average (DMA) line which recently acted as support. The benchmark index finished the session +6.6% above its June 4th low. It resumed its rally after finding prompt support near its 200 DMA line, however waning leadership again is raising questions about the latest rally's strength.
|
 Kenneth J. Gruneisen started out as a licensed stockbroker in August 1987, a couple of months prior to the historic stock market crash that took the Dow Jones Industrial Average down -22.6% in a single day. He has published daily fact-based fundamental and technical analysis on high-ranked stocks online for two decades. Through FACTBASEDINVESTING.COM, Kenneth provides educational articles, news, market commentary, and other information regarding proven investment systems that work in good times and bad.
Comments contained in the body of this report are technical opinions only and are not necessarily those of Gruneisen Growth Corp. The material herein has been obtained from sources believed to be reliable and accurate, however, its accuracy and completeness cannot be guaranteed. Our firm, employees, and customers may effect transactions, including transactions contrary to any recommendation herein, or have positions in the securities mentioned herein or options with respect thereto. Any recommendation contained in this report may not be suitable for all investors and it is not to be deemed an offer or solicitation on our part with respect to the purchase or sale of any securities. |
|
 |
Commodity-Linked, Tech, and Financial Indexes Fell
Kenneth J. Gruneisen - Passed the CAN SLIM® Master's Exam
Commodity-linked issues faced pressure and the Gold & Silver Index ($XAU -2.74%) was a standout decliner on Monday while the Integrated Oil Index ($XOI -1.67%) and Oil Services Index ($OSX -0.80%) also lost ground. The tech sector was also weak as there were unanimous losses from the Biotechnology Index ($BTK -2.48%), Networking Index ($NWX -1.96%), Internet Index ($IIX -1.58%), and Semiconductor Index ($SOX -0.92%). Weakness in financial shares also pressure the major indices as the Broker/Dealer Index ($XBD -1.40%) and the Bank Index ($BKX -0.94%) lost ground. A modest loss from the Retail Index ($RLX -0.49%) and a loss for the Healthcare Index ($HMO -1.29%) rounded out the widely negative session.
Charts courtesy www.stockcharts.com
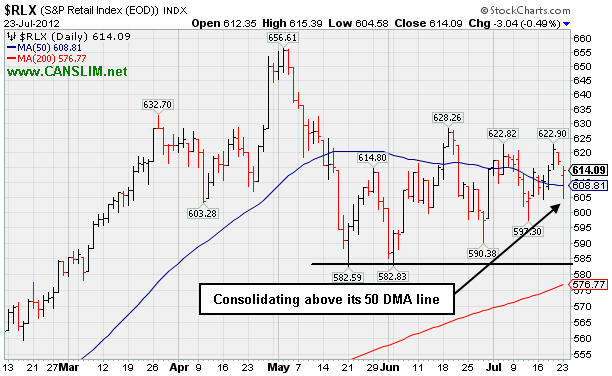
PICTURED: The Retail Index ($RLX -0.49%) is consolidating above its 50-day moving average (DMA) line, trading -6.5% off its 2012 high hit in early May.
| Oil Services |
$OSX |
214.70 |
-1.73 |
-0.80% |
-0.73% |
| Healthcare |
$HMO |
2,377.52 |
-31.08 |
-1.29% |
+4.20% |
| Integrated Oil |
$XOI |
1,177.10 |
-19.94 |
-1.67% |
-4.23% |
| Semiconductor |
$SOX |
361.66 |
-3.35 |
-0.92% |
-0.76% |
| Networking |
$NWX |
189.47 |
-3.79 |
-1.96% |
-11.94% |
| Internet |
$IIX |
292.77 |
-4.69 |
-1.58% |
+3.92% |
| Broker/Dealer |
$XBD |
80.22 |
-1.14 |
-1.40% |
-3.66% |
| Retail |
$RLX |
614.09 |
-3.04 |
-0.49% |
+17.37% |
| Gold & Silver |
$XAU |
143.54 |
-4.04 |
-2.74% |
-20.54% |
| Bank |
$BKX |
44.45 |
-0.42 |
-0.94% |
+12.87% |
| Biotech |
$BTK |
1,466.75 |
-37.30 |
-2.48% |
+34.39% |
|
|
|
 |
Slumping Further Below 50 DMA Line Following Damaging Losses
Kenneth J. Gruneisen - Passed the CAN SLIM® Master's Exam
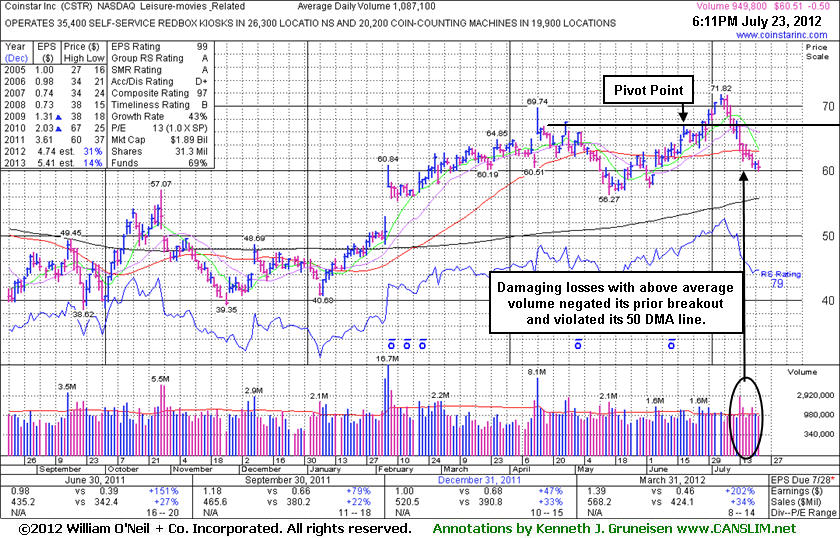
Coinstar Inc (CSTR -$0.50 or -0.82% to $60.51) sank further below its 50-day moving average (DMA) line today a small loss on near average volume. Above average volume was behind recent losses which negated its prior breakout and violated its 50 DMA line triggering technical sell signals. Disciplined investors always limit losses by selling if any stock falls more than -7% from their purchase price. It needs gains above its 50 DMA line to improve its technical stance and its near-term outlook. Meanwhile it appears vulnerable to greater damage, and the next important support level is defined by its May lows and its 200 DMA line.
Its Accumulation/Distribution Rating has slumped from a B to a D+ since it was last shown in this FSU section on 6/26/12 with an annotated graph under the headline, "Formed Cup-With Handle Base, But Watch First For Technical Breakout" after highlighted in yellow in the mid-day report (read here) with pivot point based on its 6/19/12 high after a cup-with handle base. It was then observed - "There was above average volume behind its gain, but it did not rally above its pivot point. Disciplined investors will watch for a solid volume-driven gain to confirm a breakout before taking action. It is now perched within close striking distance of its 52-week high and all-time high, however the $67-69 area has been a stubborn resistance level in recent years." It subsequently posted a gain on 6/29/12 with +42% above average volume, near the bare minimum volume threshold, yet finished above its pivot point confirming a technical buy signal. However, by 7/13/12 it was noted that damaging action had negated its technical breakout and its color code was changed to green. Since then it has failed to produce gains backed by above average volume, yet it has endured more damaging distributional pressure.
It has earned the highest possible rank of 99 for its Earnings Per Share growth, and a 97 Composite Rating. Quarterly comparisons show strong sales revenues and earnings increases (C criteria), and its annual earnings (A criteria) history has been good. The number of top-rated funds owning its shares rose from 350 in Jun '11 to 401 in Jun '12, a reassuring sign concerning the I criteria.
|
|
|
Color Codes Explained :
Y - Better candidates highlighted by our
staff of experts.
G - Previously featured
in past reports as yellow but may no longer be buyable under the
guidelines.
***Last / Change / Volume data in this table is the closing quote data***
Symbol/Exchange
Company Name
Industry Group |
PRICE |
CHANGE
(%Change) |
Day High |
Volume
(% DAV)
(% 50 day avg vol) |
52 Wk Hi
% From Hi |
Featured
Date |
Price
Featured |
Pivot Featured |
|
Max Buy |
ALXN
-
NASDAQ
Alexion Pharmaceuticals
DRUGS - Drug Manufacturers - Other
|
$98.44
|
-0.91
-0.92% |
$98.64
|
1,853,190
84.01% of 50 DAV
50 DAV is 2,205,900
|
$104.38
-5.69%
|
5/1/2012
|
$91.73
|
PP = $95.11
|
|
MB = $99.87
|
Most Recent Note - 7/20/2012 5:34:06 PM
Y - Volume totals have been cooling in recent weeks while consolidating above prior highs in the $95 area and its 50 DMA line defining important chart support. No resistance remains due to overhead supply.
>>> The latest Featured Stock Update with an annotated graph appeared on 6/29/2012. Click here.
View all notes |
Alert me of new notes |
CANSLIM.net Company Profile |
SEC |
Zacks Reports |
StockTalk |
News |
Chart |
Request a new note
C
A N
S L
I M


|
ASPS
-
NASDAQ
Altisource Ptf Sltns Sa
REAL ESTATE - Property Management/Developmen
|
$74.44
|
-1.31
-1.73% |
$75.40
|
36,558
27.72% of 50 DAV
50 DAV is 131,900
|
$76.40
-2.57%
|
6/5/2012
|
$60.01
|
PP = $63.00
|
|
MB = $66.15
|
Most Recent Note - 7/20/2012 5:36:17 PM
G - Holding its ground perched near its all-time high, extended from its prior base, and recent gains lacked great volume conviction. Prior highs in the $65 area and its 50 DMA line define near-term support to watch.
>>> The latest Featured Stock Update with an annotated graph appeared on 7/3/2012. Click here.
View all notes |
Alert me of new notes |
CANSLIM.net Company Profile |
SEC |
Zacks Reports |
StockTalk |
News |
Chart |
Request a new note
C
A N
S L
I M
|
CERN
-
NASDAQ
Cerner Corp
COMPUTER SOFTWARE and SERVICES - Healthcare Information Service
|
$76.44
|
-0.58
-0.75% |
$76.82
|
1,273,767
91.73% of 50 DAV
50 DAV is 1,388,600
|
$88.32
-13.45%
|
6/7/2012
|
$78.36
|
PP = $84.20
|
|
MB = $88.41
|
 Most Recent Note - 7/23/2012 6:39:35 PM
G - Undercut prior lows in the $75-76 area today, yet rebounded to close in the upper third of its intra-day range indicating that it was finding some institutional support. It has not formed a proper base since negating its prior breakout.
>>> The latest Featured Stock Update with an annotated graph appeared on 7/9/2012. Click here.
View all notes |
Alert me of new notes |
CANSLIM.net Company Profile |
SEC |
Zacks Reports |
StockTalk |
News |
Chart |
Request a new note
C
A N
S L
I M
|
CFNL
-
NASDAQ
Cardinal Financial Corp
BANKING - Regional - Southeast Banks
|
$12.61
|
-0.24
-1.87% |
$12.75
|
64,861
84.34% of 50 DAV
50 DAV is 76,900
|
$13.21
-4.54%
|
7/20/2012
|
$12.85
|
PP = $12.41
|
|
MB = $13.03
|
Most Recent Note - 7/20/2012 12:35:33 PM
Y - It has earned high ranks and matches favorably with the C and A criteria. Recently wedging into new high territory with gains lacking great volume conviction. Careful investors may consider a tactic they teach in the Certification called "pyramiding" to let market action dictate buying efforts. It made only limited progress since clearing prior highs weeks ago with gains backed by slightly above average volume.

There are no Featured Stock Updates™ available for this stock at this time. You may request one by clicking the Request a New Note link below
View all notes |
Alert me of new notes |
CANSLIM.net Company Profile |
SEC |
Zacks Reports |
StockTalk |
News |
Chart |
Request a new note
C
A N
S L
I M
|
CMCSA
-
NASDAQ
Comcast Corp Cl A
MEDIA - CATV Systems
|
$31.37
|
-0.81
-2.52% |
$31.79
|
14,153,371
106.49% of 50 DAV
50 DAV is 13,290,900
|
$32.78
-4.30%
|
6/11/2012
|
$29.94
|
PP = $30.98
|
|
MB = $32.53
|
Most Recent Note - 7/20/2012 5:38:02 PM
Y - Hovering in a tight range near its 52-week high, holding ground above its pivot point. No overhead supply remains to act as resistance and it is still trading below its "max buy" level.
>>> The latest Featured Stock Update with an annotated graph appeared on 7/11/2012. Click here.
View all notes |
Alert me of new notes |
CANSLIM.net Company Profile |
SEC |
Zacks Reports |
StockTalk |
News |
Chart |
Request a new note
C
A N
S L
I M
|
Symbol/Exchange
Company Name
Industry Group |
PRICE |
CHANGE
(%Change) |
Day High |
Volume
(% DAV)
(% 50 day avg vol) |
52 Wk Hi
% From Hi |
Featured
Date |
Price
Featured |
Pivot Featured |
|
Max Buy |
CSTR
-
NASDAQ
Coinstar Inc
DIVERSIFIED SERVICES - Personal Services
|
$60.51
|
-0.50
-0.82% |
$61.59
|
961,481
88.44% of 50 DAV
50 DAV is 1,087,100
|
$71.82
-15.75%
|
6/26/2012
|
$64.05
|
PP = $67.00
|
|
MB = $70.35
|
Most Recent Note - 7/23/2012 6:35:55 PM
G - Slumped further below its 50 DMA line today and needs subsequent gains above that short term average to help its technical stance. See the latest FSU analysis for more details and a new annotated graph.
>>> The latest Featured Stock Update with an annotated graph appeared on 7/23/2012. Click here.
View all notes |
Alert me of new notes |
CANSLIM.net Company Profile |
SEC |
Zacks Reports |
StockTalk |
News |
Chart |
Request a new note
C
A N
S L
I M
|
CTRX
-
NASDAQ
Catamaran Corp
COMPUTER SOFTWARE and SERVICES - Healthcare Information Service
|
$85.80
|
-4.08
-4.54% |
$88.47
|
1,416,404
121.90% of 50 DAV
50 DAV is 1,161,900
|
$104.79
-18.12%
|
6/14/2012
|
$94.71
|
PP = $100.60
|
|
MB = $105.63
|
Most Recent Note - 7/23/2012 10:31:54 AM
G - Gapped down and traded below previously noted lows in the $86 area today raising more serious concerns and triggering a more worrisome technical sell signal. A rebound above the 50 DMA line is needed to improve its technical stance.
>>> The latest Featured Stock Update with an annotated graph appeared on 7/16/2012. Click here.
View all notes |
Alert me of new notes |
CANSLIM.net Company Profile |
SEC |
Zacks Reports |
StockTalk |
News |
Chart |
Request a new note
C
A N
S L
I M
|
DG
-
NYSE
Dollar General Corp
RETAIL - Discount, Variety Stores
|
$52.32
|
-0.02
-0.04% |
$52.52
|
2,947,701
76.78% of 50 DAV
50 DAV is 3,839,400
|
$56.04
-6.64%
|
7/16/2012
|
$54.68
|
PP = $56.14
|
|
MB = $58.95
|
Most Recent Note - 7/19/2012 6:23:37 PM
Y - Volume increased behind its 2nd consecutive loss and it finished near the session low, retreating from its all-time high. It did not register volume-driven gains above its new pivot point to trigger a new (or add-on) technical buy signal. Completed another Secondary Offering on 6/05/12, its 4th Secondary Offering since September '11.
>>> The latest Featured Stock Update with an annotated graph appeared on 7/12/2012. Click here.
View all notes |
Alert me of new notes |
CANSLIM.net Company Profile |
SEC |
Zacks Reports |
StockTalk |
News |
Chart |
Request a new note
C
A N
S L
I M
|
ECHO
-
NASDAQ
Echo Global Logistics
DIVERSIFIED SERVICES - Business/Management Services
|
$17.24
|
-0.05
-0.29% |
$17.41
|
134,319
97.54% of 50 DAV
50 DAV is 137,700
|
$19.97
-13.67%
|
6/22/2012
|
$18.98
|
PP = $19.48
|
|
MB = $20.45
|
Most Recent Note - 7/20/2012 5:23:05 PM
G - Damaging loss today violated its 50 DMA line triggering a technical sell signal. Its color code is changed to green. Repeatedly noted that it did not trigger a proper technical buy signal under the fact-based system. See the latest FSU analysis for more details and a new annotated graph.
>>> The latest Featured Stock Update with an annotated graph appeared on 7/20/2012. Click here.
View all notes |
Alert me of new notes |
CANSLIM.net Company Profile |
SEC |
Zacks Reports |
StockTalk |
News |
Chart |
Request a new note
C
A N
S L
I M
|
EXPE
-
NASDAQ
Expedia Inc
INTERNET - Internet Information Providers
|
$46.38
|
-0.72
-1.53% |
$46.63
|
2,791,010
75.20% of 50 DAV
50 DAV is 3,711,300
|
$50.66
-8.45%
|
4/27/2012
|
$41.80
|
PP = $35.57
|
|
MB = $37.35
|
Most Recent Note - 7/23/2012 10:34:18 AM
G -Today's gap down and loss has it slumping back below its 50 DMA line. Prior low ($43.44 on 7/13/12) defines the next important support level to watch.
>>> The latest Featured Stock Update with an annotated graph appeared on 7/10/2012. Click here.
View all notes |
Alert me of new notes |
CANSLIM.net Company Profile |
SEC |
Zacks Reports |
StockTalk |
News |
Chart |
Request a new note
C
A N
S L
I M
|
Symbol/Exchange
Company Name
Industry Group |
PRICE |
CHANGE
(%Change) |
Day High |
Volume
(% DAV)
(% 50 day avg vol) |
52 Wk Hi
% From Hi |
Featured
Date |
Price
Featured |
Pivot Featured |
|
Max Buy |
GNC
-
NYSE
G N C Holdings Inc
RETAIL - Drug Stores
|
$37.40
|
-0.25
-0.66% |
$37.62
|
1,417,073
62.15% of 50 DAV
50 DAV is 2,280,200
|
$42.70
-12.41%
|
6/29/2012
|
$39.20
|
PP = $40.00
|
|
MB = $42.00
|
Most Recent Note - 7/23/2012 6:42:23 PM
G - Slumped further below its pivot point and under its 50 DMA line today. Its color code is changed to green, yet its finish in the upper third of its intra-day range indicated that it was finding some support. Disciplined investors always limit losses if any stock falls more than -7% from their purchase price.
>>> The latest Featured Stock Update with an annotated graph appeared on 7/5/2012. Click here.
View all notes |
Alert me of new notes |
CANSLIM.net Company Profile |
SEC |
Zacks Reports |
StockTalk |
News |
Chart |
Request a new note
C
A N
S L
I M
|
GPX
-
NYSE
G P Strategies Corp
DIVERSIFIED SERVICES - Education and Training Services
|
$17.00
|
-0.31
-1.79% |
$17.12
|
77,665
138.19% of 50 DAV
50 DAV is 56,200
|
$18.99
-10.48%
|
6/29/2012
|
$18.01
|
PP = $18.15
|
|
MB = $19.06
|
Most Recent Note - 7/23/2012 6:44:08 PM
Y - Slumped further toward its 50 DMA line today with a loss on slightly higher volume. Recent losses completely negated the prior breakout and raised concerns. Disciplined investors always limit losses by selling any stock if it falls more than -7% from their purchase price.
>>> The latest Featured Stock Update with an annotated graph appeared on 7/6/2012. Click here.
View all notes |
Alert me of new notes |
CANSLIM.net Company Profile |
SEC |
Zacks Reports |
StockTalk |
News |
Chart |
Request a new note
C
A N
S L
I M
|
N
-
NYSE
Netsuite Inc
DIVERSIFIED SERVICES - Business/Management Services
|
$49.25
|
-1.23
-2.44% |
$49.29
|
505,414
87.59% of 50 DAV
50 DAV is 577,000
|
$56.06
-12.15%
|
6/20/2012
|
$51.83
|
PP = $51.88
|
|
MB = $54.47
|
Most Recent Note - 7/23/2012 6:47:31 PM
Y - Finished near the session high today after trading under its 50 DMA line and recent lows defining important near-term support. More damaging losses would raise serious concerns and trigger a worrisome technical sell signal.
>>> The latest Featured Stock Update with an annotated graph appeared on 7/19/2012. Click here.
View all notes |
Alert me of new notes |
CANSLIM.net Company Profile |
SEC |
Zacks Reports |
StockTalk |
News |
Chart |
Request a new note
C
A N
S L
I M
|
NSM
-
NYSE
Nationstar Mtg Hldgs Inc
FINANCIAL SERVICES - Credit Services
|
$24.16
|
+0.09
0.37% |
$24.34
|
317,704
39.67% of 50 DAV
50 DAV is 800,800
|
$25.11
-3.78%
|
6/27/2012
|
$20.29
|
PP = $20.46
|
|
MB = $21.48
|
Most Recent Note - 7/23/2012 6:49:51 PM
G - Holding its ground stubbornly, perched near its 52-week high with volume totals cooling in the past week after getting extended from its prior base. Prior highs and its 50 DMA line in the $20 area define important support to watch on pullbacks.
>>> The latest Featured Stock Update with an annotated graph appeared on 6/27/2012. Click here.
View all notes |
Alert me of new notes |
CANSLIM.net Company Profile |
SEC |
Zacks Reports |
StockTalk |
News |
Chart |
Request a new note
C
A N
S L
I M
|
TDG
-
NYSE
Transdigm Group Inc
AEROSPACE/DEFENSE - Aerospace/Defense Products and; Services
|
$128.73
|
-0.97
-0.75% |
$129.10
|
228,966
48.23% of 50 DAV
50 DAV is 474,700
|
$136.34
-5.58%
|
6/18/2012
|
$127.00
|
PP = $132.79
|
|
MB = $139.43
|
Most Recent Note - 7/23/2012 6:51:33 PM
Y - Still finding support above its 50 DMA line after a recent breakout attempt lacked volume conviction. A damaging violation of that short-term average would raise concerns and trigger a technical sell signal.
>>> The latest Featured Stock Update with an annotated graph appeared on 7/18/2012. Click here.
View all notes |
Alert me of new notes |
CANSLIM.net Company Profile |
SEC |
Zacks Reports |
StockTalk |
News |
Chart |
Request a new note
C
A N
S L
I M
|
Symbol/Exchange
Company Name
Industry Group |
PRICE |
CHANGE
(%Change) |
Day High |
Volume
(% DAV)
(% 50 day avg vol) |
52 Wk Hi
% From Hi |
Featured
Date |
Price
Featured |
Pivot Featured |
|
Max Buy |
TNGO
-
NASDAQ
Tangoe Inc
COMPUTER SOFTWARE and SERVICES - Technical and System Software
|
$19.59
|
-0.96
-4.67% |
$20.16
|
522,319
107.34% of 50 DAV
50 DAV is 486,600
|
$23.05
-15.01%
|
6/27/2012
|
$21.70
|
PP = $23.15
|
|
MB = $24.31
|
Most Recent Note - 7/23/2012 4:37:56 PM
G - Traded further below its 50 DMA line and slumped toward prior lows with today's 3rd consecutive loss. Faces overhead supply up to the $23 level which has been a stubborn resistance area in recent months. It did not trigger a new technical buy signal since recently featured again in yellow.
>>> The latest Featured Stock Update with an annotated graph appeared on 6/28/2012. Click here.
View all notes |
Alert me of new notes |
CANSLIM.net Company Profile |
SEC |
Zacks Reports |
StockTalk |
News |
Chart |
Request a new note
C
A N
S L
I M
|
VSI
-
NYSE
Vitamin Shoppe Inc
SPECIALTY RETAIL - Specialty Retail, Other
|
$54.32
|
+0.05
0.09% |
$54.98
|
253,344
62.06% of 50 DAV
50 DAV is 408,200
|
$58.22
-6.70%
|
6/29/2012
|
$54.93
|
PP = $55.03
|
|
MB = $57.78
|
Most Recent Note - 7/23/2012 4:41:11 PM
Y - Managed a positive reversal today after slumping to its 50 DMA line. That important short-term average defines important support where a violation would raise concerns and trigger a technical sell signal. Recent gains after forming an 8-week cup-with-handle base lacked the volume required to trigger a proper new (or add-on) technical buy signal.
>>> The latest Featured Stock Update with an annotated graph appeared on 7/2/2012. Click here.
View all notes |
Alert me of new notes |
CANSLIM.net Company Profile |
SEC |
Zacks Reports |
StockTalk |
News |
Chart |
Request a new note
C
A N
S L
I M
|
|
|
|
THESE ARE NOT BUY RECOMMENDATIONS!
Comments contained in the body of this report are technical
opinions only. The material herein has been obtained
from sources believed to be reliable and accurate, however,
its accuracy and completeness cannot be guaranteed.
This site is not an investment advisor, hence it does
not endorse or recommend any securities or other investments.
Any recommendation contained in this report may not
be suitable for all investors and it is not to be deemed
an offer or solicitation on our part with respect to
the purchase or sale of any securities. All trademarks,
service marks and trade names appearing in this report
are the property of their respective owners, and are
likewise used for identification purposes only.
This report is a service available
only to active Paid Premium Members.
You may opt-out of receiving report notifications
at any time. Questions or comments may be submitted
by writing to Premium Membership Services 665 S.E. 10 Street, Suite 201 Deerfield Beach, FL 33441-5634 or by calling 1-800-965-8307
or 954-785-1121.
|
|
|

