You are not logged in.
This means you
CAN ONLY VIEW reports that were published prior to Monday, March 24, 2025.
You
MUST UPGRADE YOUR MEMBERSHIP if you want to see any current reports.
AFTER MARKET UPDATE - THURSDAY, JULY 23RD, 2009
Previous After Market Report Next After Market Report >>>
|
|
|
|
DOW |
+188.03 |
9,069.29 |
+2.12% |
|
Volume |
1,395,760,000 |
+29% |
|
Volume |
3,124,350,840 |
+31% |
|
NASDAQ |
+47.22 |
1,973.60 |
+2.45% |
|
Advancers |
2,563 |
82% |
|
Advancers |
2,091 |
74% |
|
S&P 500 |
+22.22 |
976.29 |
+2.33% |
|
Decliners |
492 |
16% |
|
Decliners |
636 |
22% |
|
Russell 2000 |
+17.15 |
545.85 |
+3.24% |
|
52 Wk Highs |
108 |
|
|
52 Wk Highs |
119 |
|
|
S&P 600 |
+8.70 |
289.70 |
+3.10% |
|
52 Wk Lows |
2 |
|
|
52 Wk Lows |
9 |
|
|
 |
Breadth Positive As Stocks Surge Again On Higher Volume
Kenneth J. Gruneisen - Passed the CAN SLIM® Master's Exam
The volume totals on the NYSE and the Nasdaq exchange rose over the prior session totals and were above average while advancers led decliners on the NYSE by a 5-to-1 ratio and by a 3-to-1 ratio on the Nasdaq exchange. There were 58 high-ranked companies from the CANSLIM.net Leaders List that made a new 52-week high and appeared on the CANSLIM.net BreakOuts Page, considerably up from the 36 issues that appeared on the prior session. On both exchanges new 52-week highs were in the triple digits while new 52-week lows were in the single digits. Collectively, the above facts are very encouraging signs that are a clear indication of heavier buying demand coming into stocks from institutional investors.
The tech-heavy Nasdaq Composite Index posted its 12th straight advance, and its last winning streak that long ended on January 8, 1992. The Dow Jones Industrials rallied to their first close above 9,000 since January. Better-than-expected profits at some of the nation's biggest companies also lifted the market. The biggest gainer among the blue chip index's 30 stocks was 3M Co. (MMM +7.36%), makers of Scotch tape and Post-it Notes, gapping up and rising impressively on heavy volume even after its latest earnings report for the quarter ended June 30, 2009 showed lower sales (-15%) and earnings (-14%). Hershey Co. (HSY +7.32%) gapped up after reporting a solid earnings increase (+48%), but its sales revenues growth rate has continuously been lackluster. Meanwhile, NVE Corp (NVEC +14.88%) was highlighted in yellow in Thursday's Mid-Day BreakOuts Report (read here) after it gapped up for a considerable gain on heavy volume following news of stronger sales revenues (+41%) and solid earnings increases for the quarter ended June 30, 2009.
News on the mergers and acquisitions front also helped to entice investors into buying. Bristol-Myers Squibb Co. (BMY +2.81%) announced plans to acquire Medarex Inc. (MEDX +89.17%) for about $2.1 billion, the latest in a string of acquisitions by the drug maker. Amazon.com Inc. (AMZN +5.72%) agreed to buy Zappos.com Inc., a privately held online shoe store, in a deal worth about $850 million.
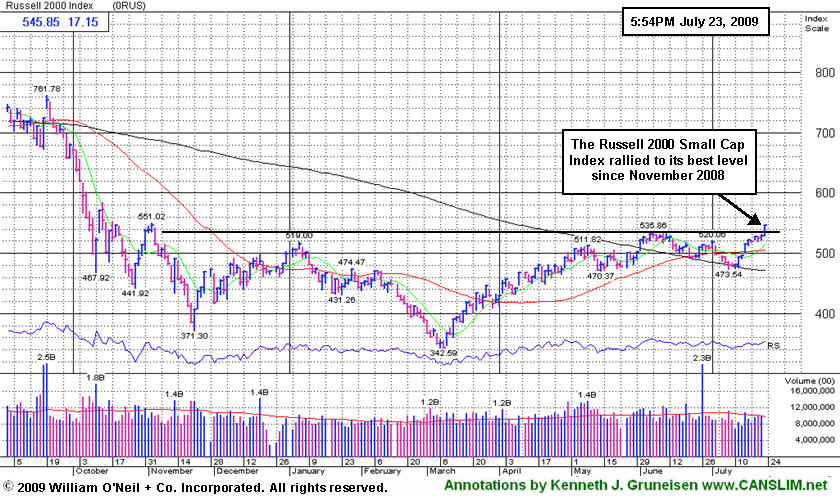
PICTURED: The Russell 2000 Small Cap Index rallied above its June highs to its best level since November 2008. Technically, that is an encouraging sign, especially due to the fact this investment system is most focused on finding high-ranked small-cap stocks with superior fundamentals and strong technical price/volume patterns.
|
 Kenneth J. Gruneisen started out as a licensed stockbroker in August 1987, a couple of months prior to the historic stock market crash that took the Dow Jones Industrial Average down -22.6% in a single day. He has published daily fact-based fundamental and technical analysis on high-ranked stocks online for two decades. Through FACTBASEDINVESTING.COM, Kenneth provides educational articles, news, market commentary, and other information regarding proven investment systems that work in good times and bad.
Comments contained in the body of this report are technical opinions only and are not necessarily those of Gruneisen Growth Corp. The material herein has been obtained from sources believed to be reliable and accurate, however, its accuracy and completeness cannot be guaranteed. Our firm, employees, and customers may effect transactions, including transactions contrary to any recommendation herein, or have positions in the securities mentioned herein or options with respect thereto. Any recommendation contained in this report may not be suitable for all investors and it is not to be deemed an offer or solicitation on our part with respect to the purchase or sale of any securities. |
|
 |
Influential Retail and Broker/Dealer Indexes Reach New 2009 Highs
Kenneth J. Gruneisen - Passed the CAN SLIM® Master's Exam
The Retail Index ($RLX +2.71%), Bank Index ($BKX +2.95%), and Broker/Dealer Index ($XBD +3.19%) were among the many groups providing a positive influence on the major averages on Thursday. The Biotechnology Index ($BTK +4.10%) led the tech sector higher, followed by the Networking Index ($NWX +3.01%) and Internet Index ($IIX +2.60%), and a smaller gain from the Semiconductor Index ($SOX +0.98%). The Healthcare Index ($HMO +2.67%) Gains in the energy group boosted the Oil Services Index ($OSX +3.88%) and Integrated Oil Index ($XOI +2.62%), meanwhile the Gold & Silver Index ($XAU +0.78%) posted a smaller gain.
Charts courtesy www.stockcharts.com
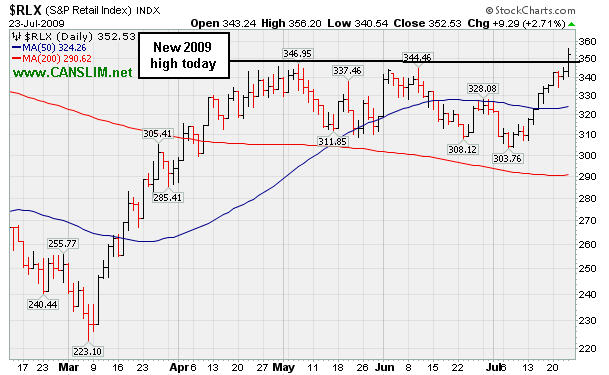
PICTURED 1: The Retail Index ($RLX +2.71%) posted a solid gain and rallied to a new 2009 high, which is an encouraging sign from this influential index.
Charts courtesy www.stockcharts.com
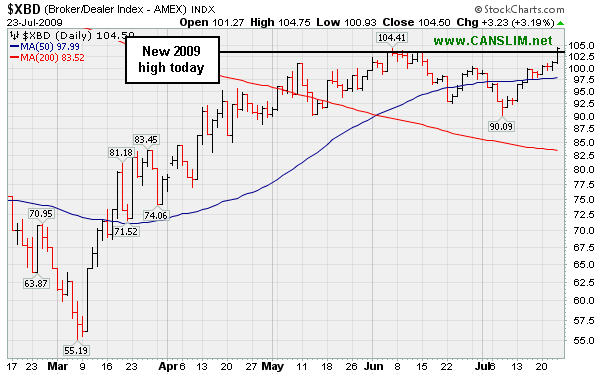
PICTURED 2: The Broker/Dealer Index ($XBD +3.19%) also posted a solid gain and rallied to a new 2009 high.
| Oil Services |
$OSX |
173.19 |
+6.47 |
+3.88% |
+42.67% |
| Healthcare |
$HMO |
1,106.07 |
+28.76 |
+2.67% |
+15.19% |
| Integrated Oil |
$XOI |
961.35 |
+24.58 |
+2.62% |
-1.87% |
| Semiconductor |
$SOX |
304.72 |
+2.95 |
+0.98% |
+43.62% |
| Networking |
$NWX |
200.10 |
+5.85 |
+3.01% |
+39.06% |
| Internet |
$IIX |
204.39 |
+5.18 |
+2.60% |
+52.79% |
| Broker/Dealer |
$XBD |
104.50 |
+3.23 |
+3.19% |
+34.89% |
| Retail |
$RLX |
352.53 |
+9.29 |
+2.71% |
+26.24% |
| Gold & Silver |
$XAU |
149.29 |
+1.15 |
+0.78% |
+20.54% |
| Bank |
$BKX |
37.32 |
+1.07 |
+2.95% |
-15.79% |
| Biotech |
$BTK |
843.93 |
+33.24 |
+4.10% |
+30.40% |
|
|
|
 |
High-Ranked Leader Pauses After 10 Straight Gains
Kenneth J. Gruneisen - Passed the CAN SLIM® Master's Exam
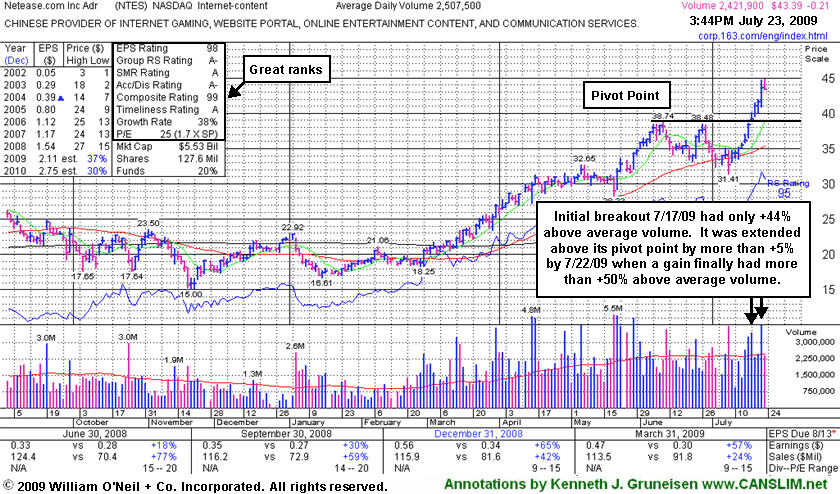
Netease.com Inc (NTES -$0.21 or -0.69% to $43.39) closed with a small loss on light volume today, breaking a streak of 10 consecutive gains that helped it get extended from its latest base. Its color code has been changed to green after an impressive winning streak was capped off with a considerable gain yesterday on +52% above average volume that lifted it well above its "max buy" level. After enduring some distribution, but finding support near its 50-day moving average line, it began rebounding toward prior chart highs. Its color code was changed to yellow with a new pivot point cited in the 7/17/09 Mid-Day Breakouts Report (read here). That day's breakout from a 5-week flat base came with only +44% above average volume behind its gain, below the guideline for a proper buy signal. The stock was extended more than +5% above its pivot point by 7/22/09 when a gain finally had more than the minimum +50% above average volume. That illustrates how making a disciplined entry was quite challenging or impossible for investors. However, patience may allow shares to be accumulated on light volume pullbacks toward prior chart highs in the $38 area which are now a very important technical support level to watch.
The number of top-rated funds owning an interest in its shares increased from 18 in June '08 to 78 in June '09, which is very reassuring news in respect to the I criteria. NTES was first featured at $26.75 in the 3/31/09 Mid-Day Breakouts Report (read here). This high-ranked Chinese Internet - Content firm was also summarized in greater detail including an annotated graph in the April 2009 issue of CANSLIM.net News (read here).
|
|
|
Color Codes Explained :
Y - Better candidates highlighted by our
staff of experts.
G - Previously featured
in past reports as yellow but may no longer be buyable under the
guidelines.
***Last / Change / Volume quote data in this table corresponds with the timestamp on the note***
Symbol/Exchange
Company Name
Industry Group |
Last |
Chg. |
Vol
% DAV |
Date Featured |
Price Featured |
Latest Pivot Point
Featured |
Status |
| Latest Max Buy Price |
CPLA
- NASDAQ
Capella Education Co
DIVERSIFIED SERVICES - Education and Training Services
|
$61.82
|
-0.46
|
92,207
43% DAV
213,062
|
7/9/2009
(Date
Featured) |
$59.69
(Price
Featured) |
PP = $62.06 |
Y |
| MB = $65.16 |
Most Recent Note - 7/23/2009 4:24:25 PM
Y - Small loss today on light volume ended a 6 session winning streak. To trigger a technical buy signal, volume should meet or exceeded the +50% above average volume guideline as a stock rises above its pivot point. Featured in yellow in the 7/09/09 Mid-Day BreakOuts Report (read here). The group has shown some leadership, yet currently has a E for a Relative Strength Rating. CPLA is a high-ranked leader in the Commercial Services-Schools Group. Its small supply of only 13.9 million shares in the float could contribute to greater price volatility in the event of institutional accumulation or distribution. The number of top-rated funds owning an interest rose from 91 in Sept '08, to 132 as of March '09, which is reassuring with respect to the I criteria. It has a very good earnings history that satisfies the C & A criteria, while recent quarters showed steady sales revenues increases in the +17-18% range.
>>> The latest Featured Stock Update with an annotated graph appeared on 7/20/2009. click here.
|
|
C
A
S
I |
News |
Chart |
SEC
View all notes Alert
me of new notes
Company
Profile
|
GMCR
- NASDAQ
Green Mtn Coffee Roastrs
FOOD & BEVERAGE - Processed & Packaged Goods
|
$68.94
|
+3.20
|
1,375,429
107% DAV
1,287,401
|
7/17/2009
(Date
Featured) |
$60.15
(Price
Featured) |
PP = $63.79 |
G |
| MB = $66.98 |
Most Recent Note - 7/23/2009 4:26:57 PM
G - Color code was changed to green after it rallied beyond its max buy level with another gain on above average volume. Blasted above its pivot point on 7/20/09 to a new all-time high with three times average volume, triggering a technical buy signal. Its recent chart highs may now be viewed as initial support to watch above its 50 DMA line. On 6/09/09 a 3:2 stock split took effect. GMCR traded up more than +158% since appearing with an annotated graph under the headline "It May Soon Be Time To Go Green" when featured in the January 2009 CANSLIM.net News (read here).
>>> The latest Featured Stock Update with an annotated graph appeared on 7/16/2009. click here.
|
|
C
A
S
I |
News |
Chart |
SEC
View all notes Alert
me of new notes
Company
Profile
|
HMSY
- NASDAQ
H M S Holdings Corp
COMPUTER SOFTWARE & SERVICES - Healthcare Information Service
|
$39.91
|
-0.68
|
316,437
99% DAV
318,882
|
2/20/2009
(Date
Featured) |
$34.08
(Price
Featured) |
PP = $38.38 |
G |
| MB = $40.30 |
Most Recent Note - 7/23/2009 4:32:04 PM
G - Loss today on higher volume was a sign of slight distributional pressure as it pulled back below its "max buy" level. This high-ranked Commercial Services - Healthcare firm previously tested prior highs in the $38 area -a very important initial support level that also coincides with its 50 DMA line. A gap up gain on 6/16/09 with heavy volume triggered a technical buy signal.
>>> The latest Featured Stock Update with an annotated graph appeared on 7/13/2009. click here.
|
|
C
A
S
I |
News |
Chart |
SEC
View all notes Alert
me of new notes
Company
Profile
|
NTES
- NASDAQ
Netease Inc Adr
INTERNET - Internet Information Providers
|
$43.29
|
-0.31
|
2,280,741
90% DAV
2,520,683
|
7/17/2009
(Date
Featured) |
$39.29
(Price
Featured) |
PP = $38.74 |
G |
| MB = $40.68 |
Most Recent Note - 7/23/2009 4:36:11 PM
G - Closed with a small loss on light volume today, breaking a streak of 10 consecutive gains which was capped off with a considerable gain on heavy volume that lifted it well above its max buy level. It is extended from its lastest base. On 7/17/09 it broke out from a 5-week flat base with +44% above average volume behind its gain. First featured at $26.75 in the 3/31/09 CANSLIM.net Mid-Day Breakouts Report (read here). This high-ranked Chinese Internet - Content firm was also summarized in greater detail including an annotated graph in the April 2009 issue of CANSLIM.net News (read here).
>>> The latest Featured Stock Update with an annotated graph appeared on 7/23/2009. click here.
|
|
C
A
S
I |
News |
Chart |
SEC
View all notes Alert
me of new notes
Company
Profile
|
NVEC
- NASDAQ
N V E Corp
ELECTRONICS - Semiconductor - Specialized
|
$54.74
|
+5.96
|
375,298
404% DAV
92,974
|
3/13/2009
(Date
Featured) |
$33.85
(Price
Featured) |
PP = $49.60 |
G |
| MB = $52.08 |
Most Recent Note - 7/23/2009 4:46:43 PM
G - It was highlighted in yellow in today's Mid-Day BreakOuts Report (read here) after it gapped up for a considerable gain on heavy volume following news of stronger sales revenues (+41%) and solid earnings increases for the quarter ended June 30, 2009. The technical action may be considered a "breakaway gap" from a valid ascending base. Color code has been changed to green after today's strong close. Patience may allow for shares to be accumulated on pullbacks, and prior highs are now an important support level. A prior breakout from what was also called an ascending base pattern failed as a wave of distribution smacked it down to support at its 50 DMA line. Quarterly sales revenues in the 6 million dollar range are still rather minuscule, leaving concerns...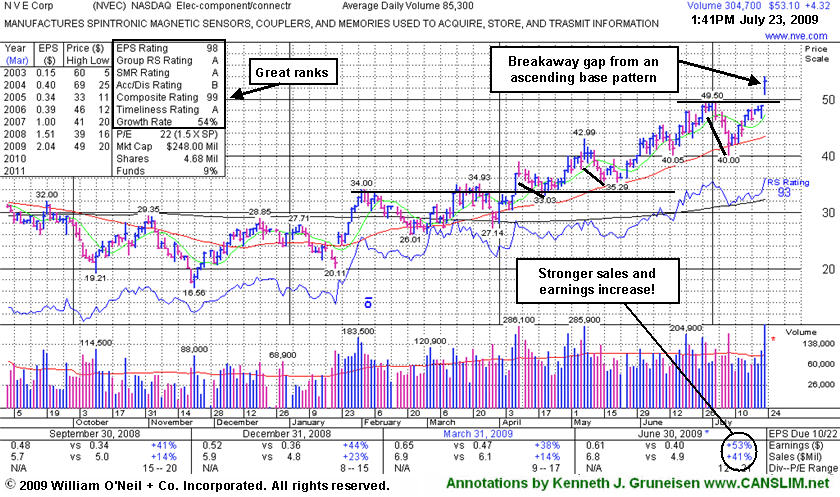
>>> The latest Featured Stock Update with an annotated graph appeared on 7/17/2009. click here.
|
|
C
A
S
I |
News |
Chart |
SEC
View all notes Alert
me of new notes
Company
Profile
|
SNDA
-
|
$59.27
|
-2.66
|
1,964,349
142% DAV
1,379,502
|
5/31/2009
(Date
Featured) |
$57.62
(Price
Featured) |
PP = $65.10 |
Y |
| MB = $68.36 |
Most Recent Note - 7/23/2009 4:55:17 PM
Y - Reversed earlier gains and closed with a loss today with heavy volume. Its 50 DMA line and recent chart lows are important support to watch now Yesterday its color code was changed to yellow with new pivot point and max buy levels noted. Detailed analysis was included when recently featured in the June 2009 issue of CANSLIM.net News. Be sure to review the "What to Look Out For" section and entire detailed summary - read here).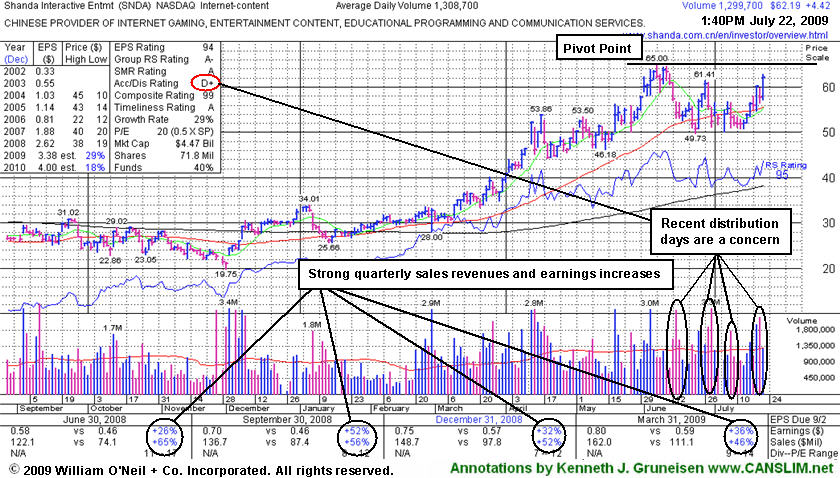
>>> The latest Featured Stock Update with an annotated graph appeared on 7/15/2009. click here.
|
|
C
A
S
I |
News |
Chart |
SEC
View all notes Alert
me of new notes
Company
Profile
|
SYNA
- NASDAQ
Synaptics Inc
COMPUTER SOFTWARE & SERVICES - Information Technology Service
|
$34.00
|
-0.37
|
1,097,657
76% DAV
1,451,962
|
5/18/2009
(Date
Featured) |
$32.58
(Price
Featured) |
PP = $34.52 |
G |
| MB = $36.25 |
Most Recent Note - 7/23/2009 4:56:06 PM
G - Small loss on average volume today, remaining below its 50 DMA line. Its outlook would improve if it rises back above that short-term average. First featured in yellow in the May 18, 2009 mid-day report (read here). The number of top-rated funds owning its shares rose from 123 in June '08 to 201 in March '09, which is good news concerning the I criteria. Its annual earnings (the A criteria) history showed a dowturn in 2006, leaving concerns, but it followed that up with strong growth the next 2 years. Its small supply of shares (the S criteria) outstanding could contribute to especially great volatility in the event of institutional accumulation or distribution.
>>> The latest Featured Stock Update with an annotated graph appeared on 7/22/2009. click here.
|
|
C
A
S
I |
News |
Chart |
SEC
View all notes Alert
me of new notes
Company
Profile
|
TNDM
- NASDAQ
Tandem Diabetes Care Inc
TELECOMMUNICATIONS - Wireless Communications
|
$30.61
|
-0.09
|
390,185
41% DAV
950,296
|
3/2/2009
(Date
Featured) |
$18.89
(Price
Featured) |
PP = $29.85 |
G |
| MB = $31.34 |
Most Recent Note - 7/23/2009 4:57:24 PM
G - Quietly consolidating just -6.7% off its all-time high, above its 50 DMA line, building on a choppy base since its June 2nd high of $32.57 was reached. Subsequent deterioration below that short-term average and recent lows would raise concerns and trigger sell signals. It traded up as much as +72.42% since first featured at $18.89 in the 3/02/09 Mid-Day BreakOuts Report (read here).
>>> The latest Featured Stock Update with an annotated graph appeared on 7/21/2009. click here.
|
|
C
A
S
I |
News |
Chart |
SEC
View all notes Alert
me of new notes
Company
Profile
|
|
|
|
THESE ARE NOT BUY RECOMMENDATIONS!
Comments contained in the body of this report are technical
opinions only. The material herein has been obtained
from sources believed to be reliable and accurate, however,
its accuracy and completeness cannot be guaranteed.
This site is not an investment advisor, hence it does
not endorse or recommend any securities or other investments.
Any recommendation contained in this report may not
be suitable for all investors and it is not to be deemed
an offer or solicitation on our part with respect to
the purchase or sale of any securities. All trademarks,
service marks and trade names appearing in this report
are the property of their respective owners, and are
likewise used for identification purposes only.
This report is a service available
only to active Paid Premium Members.
You may opt-out of receiving report notifications
at any time. Questions or comments may be submitted
by writing to Premium Membership Services 665 S.E. 10 Street, Suite 201 Deerfield Beach, FL 33441-5634 or by calling 1-800-965-8307
or 954-785-1121.
|
|
|

