You are not logged in.
This means you
CAN ONLY VIEW reports that were published prior to Monday, April 14, 2025.
You
MUST UPGRADE YOUR MEMBERSHIP if you want to see any current reports.
AFTER MARKET UPDATE - FRIDAY, JULY 20TH, 2012
Previous After Market Report Next After Market Report >>>
|
|
|
|
DOW |
-120.79 |
12,822.57 |
-0.93% |
|
Volume |
1,002,575,650 |
+33% |
|
Volume |
1,700,375,180 |
+3% |
|
NASDAQ |
-40.60 |
2,925.30 |
-1.37% |
|
Advancers |
1,005 |
32% |
|
Advancers |
649 |
25% |
|
S&P 500 |
-13.85 |
1,362.66 |
-1.01% |
|
Decliners |
2,035 |
65% |
|
Decliners |
1,818 |
71% |
|
Russell 2000 |
-10.63 |
791.54 |
-1.33% |
|
52 Wk Highs |
118 |
|
|
52 Wk Highs |
44 |
|
|
S&P 600 |
-5.45 |
443.63 |
-1.21% |
|
52 Wk Lows |
33 |
|
|
52 Wk Lows |
50 |
|
|
 |
Major Averages Fell on Session but Finished Higher for the Week
Kenneth J. Gruneisen - Passed the CAN SLIM® Master's Exam
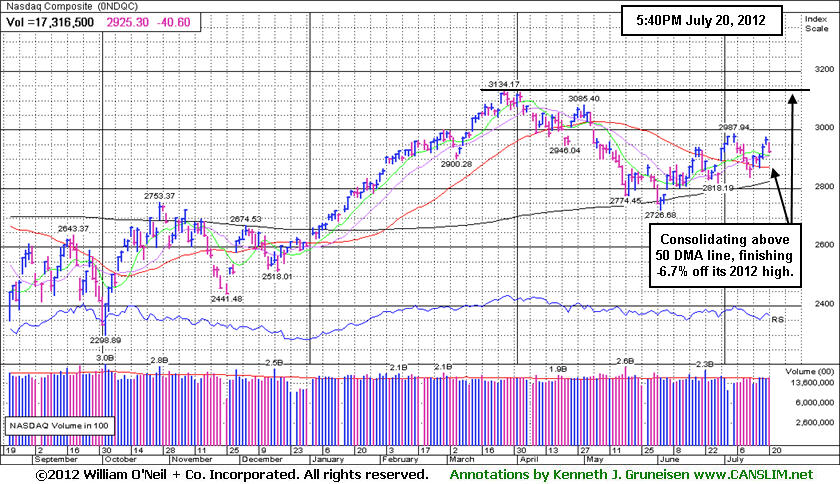
For the week, the Dow Jones Industrial Average and the S&P 500 Index both gained +0.4%, and the tech-heavy Nasdaq Composite Index gained +0.6%. On Friday's session the indices suffered losses and ended near the session lows. Behind the losses there were higher volume totals on the NYSE and on the Nasdaq exchange, an indication that institutional selling pressure was again on the rise. Advancing issues trailed decliners by a 2-1 margin on the NYSE and by nearly 3-1 on the Nasdaq exchange. The total number of new 52-week highs led new 52-week lows on the NYSE, however new lows took the lead again on the Nasdaq exchange. There were 22 high-ranked companies from the CANSLIM.net Leaders List made new 52-week highs and appeared on the CANSLIM.net BreakOuts Page, down from the prior session total of 49 stocks. At Friday's close there were gains for only 3 of the 18 high-ranked companies currently included on the Featured Stocks Page, again demonstrating a disconcertingly negative bias in the market's leading stocks.
Stocks gradually lost ground throughout the session as concerns over Europe weighed on investors. Euro zone finance ministers agreed to lend up to 100 billion Euros to help recapitalize Spain's troubled banks. Although a positive step, details surrounding the agreement heightened fears as smaller regional banks will be allowed to enter bankruptcy. On our shores, corporate earnings were largely mixed.
Shares of Google Inc (GOOG +2.99%) rallied and General Electric (GE +0.35%) posted a small gain and bucked the negative market after posting better-than-expected profit tallies. On the downside, Microsoft Corp (MSFT -1.79%) fell after posting its first net loss in earnings since going public in 1986. Also on the downside, Chipotle Mexican Grill (CMG -21.5%) fell sharply with volume 16 times average following a disappointing quarterly report.
Whole Foods Market, Inc's (WFM -7.19%) shares fell abruptly with volume spiking to nearly 4 times average. Upgraded CANSLIM.net members saw the high-ranked Retail - Super/Mini Markets firm noted at 2:18PM EST on Thursday afternoon - "Violating its 50 DMA line with today's damaging loss with above average volume following an analyst downgrade". The note warned - "It is also slumping below prior highs in the $91.50 area, triggering technical sell signals. Only a prompt rebound above its 50 DMA would help its technical stance improve." It finished the session below that important short-term average and then it gapped down today. The stock's weak finish near the session low does not bode well going into next week. Investors are always reminded to limit losses if ever any stock falls more than -7% from their purchase price to steadfastly protect precious capital.
Turning to fixed income, Treasuries are higher along the curve. The benchmark 10-year note was up by 1/2 of a point to yield 1.46% and the 30-year bond rose 1 and 1/2 points to yield 2.55%.
The upward trend concerning the M criteria endured recent pressure, yet thus far into the Q2 earnings season the market's rally has been maintained. New buying efforts may be justified in worthy buy candidates with strong fundamental and technical characteristics matching all key investment criteria. The best buy candidates identified by CANSLIM.net's experts are always viewable on the Featured Stocks page.
In August we will begin providing all currently upgraded members access to new monthly webcasts! A new "Market's Leading Groups" archives tab will also soon be added on the Premium Member Homepage. These changes are aimed at satisfying member requests and improving the service. If you have questions, comments or suggestions please let us know via the inquiry form here. The most recent WEBCAST (Q2 2012) is available "ON DEMAND" - CLICK HERE.
PICTURED: The Nasdaq Composite Index is consolidating above its 50-day moving average (DMA) line. It finished the week -6.67% off its 2012 high.
|
 Kenneth J. Gruneisen started out as a licensed stockbroker in August 1987, a couple of months prior to the historic stock market crash that took the Dow Jones Industrial Average down -22.6% in a single day. He has published daily fact-based fundamental and technical analysis on high-ranked stocks online for two decades. Through FACTBASEDINVESTING.COM, Kenneth provides educational articles, news, market commentary, and other information regarding proven investment systems that work in good times and bad.
Comments contained in the body of this report are technical opinions only and are not necessarily those of Gruneisen Growth Corp. The material herein has been obtained from sources believed to be reliable and accurate, however, its accuracy and completeness cannot be guaranteed. Our firm, employees, and customers may effect transactions, including transactions contrary to any recommendation herein, or have positions in the securities mentioned herein or options with respect thereto. Any recommendation contained in this report may not be suitable for all investors and it is not to be deemed an offer or solicitation on our part with respect to the purchase or sale of any securities. |
|
 |
Tech and Financial Indexes Led Friday's Losses
Kenneth J. Gruneisen - Passed the CAN SLIM® Master's Exam
The tech sector led Friday's pullback for US equities as the Networking Index ($NWX -2.10%), Semiconductor Index ($SOX -1.70%), Biotechnology Index ($BTK -1.29%), and the Internet Index ($IIX -1.14%) finished with unanimous losses. The Healthcare Index ($HMO -0.76%) and Retail Index ($RLX -0.63%) also created a drag on the market. The Gold & Silver Index ($XAU -0.30%) and the Integrated Oil Index ($XOI -0.36%) edged lower, meanwhile the Oil Services Index ($OSX +1.33%) posted a standout gain on the mostly negative session.
The Bank Index ($BKX -1.92%) lost ground on Friday while financial shares were a negative influence on the major averages again. Stronger action from those "leading indicators" would be preferred, while ongoing weakness remains a concern regarding the broader market's near-term outlook.
Charts courtesy www.stockcharts.com
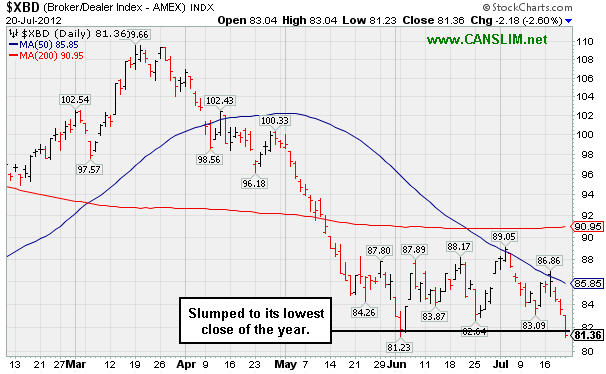
PICTURED: The Broker/Dealer Index ($XBD -2.60%) slumped to its lowest close of 2012. Its 50-day moving average line recently acted as a resistance level.
| Oil Services |
$OSX |
216.43 |
+2.84 |
+1.33% |
+0.07% |
| Healthcare |
$HMO |
2,408.60 |
-18.51 |
-0.76% |
+5.57% |
| Integrated Oil |
$XOI |
1,197.04 |
-4.36 |
-0.36% |
-2.61% |
| Semiconductor |
$SOX |
365.01 |
-6.33 |
-1.70% |
+0.16% |
| Networking |
$NWX |
193.26 |
-4.15 |
-2.10% |
-10.18% |
| Internet |
$IIX |
297.46 |
-3.42 |
-1.14% |
+5.58% |
| Broker/Dealer |
$XBD |
81.36 |
-2.18 |
-2.60% |
-2.29% |
| Retail |
$RLX |
617.13 |
-3.89 |
-0.63% |
+17.95% |
| Gold & Silver |
$XAU |
147.58 |
-0.44 |
-0.30% |
-18.30% |
| Bank |
$BKX |
44.87 |
-0.88 |
-1.92% |
+13.94% |
| Biotech |
$BTK |
1,504.05 |
-19.66 |
-1.29% |
+37.81% |
|
|
|
 |
Violated 50-Day Average After Failing to Break Out
Kenneth J. Gruneisen - Passed the CAN SLIM® Master's Exam
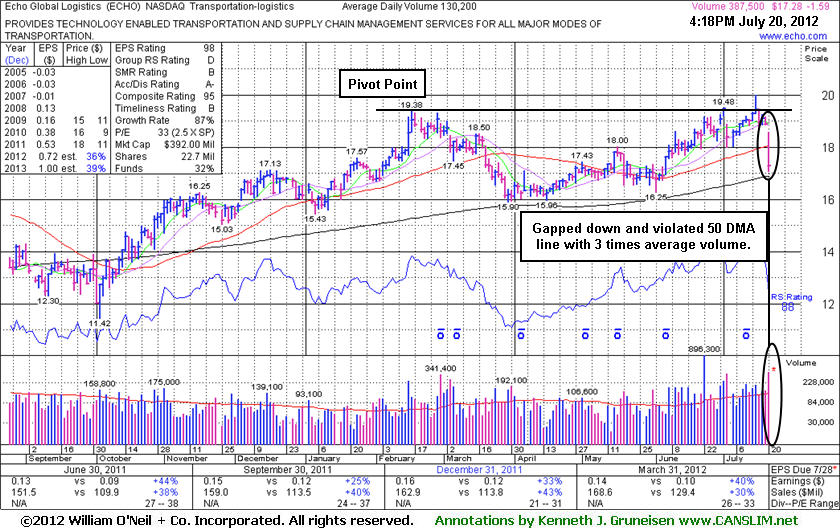
Echo Global Logistics (ECHO -$1.56 or -8.27% to $17.31) gapped down today and suffered a damaging distributional loss on heavier volume while it violated its 50-day moving average line triggering a technical sell signal. It was recently noted - "Not quite triggering a proper technical buy signal under the fact-based system", while it was pulling back on lighter volume after only briefly trading above its pivot point. The action is a reminder that getting in "early" can often be a mistake. Waiting for convincing proof of fresh institutional buying demand is very important, yet that is still no guarantee that a stock will go on to produce great gains. As always, disciplined investors limit losses if any stock falls more than -7% from their purchase price.
Ownership by top-rated funds rose from 86 in Dec '10 to 138 in Mar '12, a reassuring sign concerning the I criteria. Its fundamentals remain strong with respect to the C and A criteria. Its last appearance in this FSU section was on 6/22/12 with an annotated graph under the headline, "Rebound Near 52-Week High Makes an Ideal Set-Up", after it returned the Featured Stocks list when highlighted in that day's mid-day report in yellow (read here) with a new pivot point cited based on its 2/16/12 high plus 10 cents.
Following its appearance in this FSU section on 2/23/12 with an annotated graph under the headline, "Favorable Characteristics in Another Transportation Issue", it failed to make any further progress. Then it triggered sell signals as damaging losses negated the prior breakout and violated its 50-day moving average (DMA) line. It found support above its 200 (DMA) line.
Recent weakness among other issues in the Transportation - Logistics group is a concern, and group now has a very weak (23) Relative Strength Rating.
 |
|
|
Color Codes Explained :
Y - Better candidates highlighted by our
staff of experts.
G - Previously featured
in past reports as yellow but may no longer be buyable under the
guidelines.
***Last / Change / Volume data in this table is the closing quote data***
Symbol/Exchange
Company Name
Industry Group |
PRICE |
CHANGE
(%Change) |
Day High |
Volume
(% DAV)
(% 50 day avg vol) |
52 Wk Hi
% From Hi |
Featured
Date |
Price
Featured |
Pivot Featured |
|
Max Buy |
ALXN
-
NASDAQ
Alexion Pharmaceuticals
DRUGS - Drug Manufacturers - Other
|
$99.35
|
-0.97
-0.97% |
$100.80
|
1,697,645
77.41% of 50 DAV
50 DAV is 2,193,000
|
$104.38
-4.82%
|
5/1/2012
|
$91.73
|
PP = $95.11
|
|
MB = $99.87
|
 Most Recent Note - 7/20/2012 5:34:06 PM
Y - Volume totals have been cooling in recent weeks while consolidating above prior highs in the $95 area and its 50 DMA line defining important chart support. No resistance remains due to overhead supply.
>>> The latest Featured Stock Update with an annotated graph appeared on 6/29/2012. Click here.
View all notes |
Alert me of new notes |
CANSLIM.net Company Profile |
SEC |
Zacks Reports |
StockTalk |
News |
Chart |
Request a new note
C
A N
S L
I M


|
ASPS
-
NASDAQ
Altisource Ptf Sltns Sa
REAL ESTATE - Property Management/Developmen
|
$75.75
|
-0.12
-0.16% |
$76.07
|
63,322
47.01% of 50 DAV
50 DAV is 134,700
|
$76.40
-0.85%
|
6/5/2012
|
$60.01
|
PP = $63.00
|
|
MB = $66.15
|
Most Recent Note - 7/20/2012 5:36:17 PM
G - Holding its ground perched near its all-time high, extended from its prior base, and recent gains lacked great volume conviction. Prior highs in the $65 area and its 50 DMA line define near-term support to watch.
>>> The latest Featured Stock Update with an annotated graph appeared on 7/3/2012. Click here.
View all notes |
Alert me of new notes |
CANSLIM.net Company Profile |
SEC |
Zacks Reports |
StockTalk |
News |
Chart |
Request a new note
C
A N
S L
I M
|
CERN
-
NASDAQ
Cerner Corp
COMPUTER SOFTWARE and SERVICES - Healthcare Information Service
|
$77.02
|
-1.12
-1.43% |
$78.23
|
1,485,691
105.70% of 50 DAV
50 DAV is 1,405,600
|
$88.32
-12.79%
|
6/7/2012
|
$78.36
|
PP = $84.20
|
|
MB = $88.41
|
Most Recent Note - 7/16/2012 1:12:35 PM
G - Slumping below its 50 DMA line today raising concerns, and prior lows in the $75-76 area define the next important chart support level. It has not formed a proper base since negating its prior breakout.
>>> The latest Featured Stock Update with an annotated graph appeared on 7/9/2012. Click here.
View all notes |
Alert me of new notes |
CANSLIM.net Company Profile |
SEC |
Zacks Reports |
StockTalk |
News |
Chart |
Request a new note
C
A N
S L
I M
|
CFNL
-
NASDAQ
Cardinal Financial Corp
BANKING - Regional - Southeast Banks
|
$12.85
|
-0.15
-1.15% |
$13.00
|
124,271
162.87% of 50 DAV
50 DAV is 76,300
|
$13.21
-2.73%
|
7/20/2012
|
$12.85
|
PP = $12.41
|
|
MB = $13.03
|
Most Recent Note - 7/20/2012 12:35:33 PM
Y - It has earned high ranks and matches favorably with the C and A criteria. Recently wedging into new high territory with gains lacking great volume conviction. Careful investors may consider a tactic they teach in the Certification called "pyramiding" to let market action dictate buying efforts. It made only limited progress since clearing prior highs weeks ago with gains backed by slightly above average volume.

There are no Featured Stock Updates™ available for this stock at this time. You may request one by clicking the Request a New Note link below
View all notes |
Alert me of new notes |
CANSLIM.net Company Profile |
SEC |
Zacks Reports |
StockTalk |
News |
Chart |
Request a new note
C
A N
S L
I M
|
CMCSA
-
NASDAQ
Comcast Corp Cl A
MEDIA - CATV Systems
|
$32.18
|
-0.20
-0.62% |
$32.42
|
12,382,749
92.82% of 50 DAV
50 DAV is 13,341,100
|
$32.78
-1.83%
|
6/11/2012
|
$29.94
|
PP = $30.98
|
|
MB = $32.53
|
Most Recent Note - 7/20/2012 5:38:02 PM
Y - Hovering in a tight range near its 52-week high, holding ground above its pivot point. No overhead supply remains to act as resistance and it is still trading below its "max buy" level.
>>> The latest Featured Stock Update with an annotated graph appeared on 7/11/2012. Click here.
View all notes |
Alert me of new notes |
CANSLIM.net Company Profile |
SEC |
Zacks Reports |
StockTalk |
News |
Chart |
Request a new note
C
A N
S L
I M
|
Symbol/Exchange
Company Name
Industry Group |
PRICE |
CHANGE
(%Change) |
Day High |
Volume
(% DAV)
(% 50 day avg vol) |
52 Wk Hi
% From Hi |
Featured
Date |
Price
Featured |
Pivot Featured |
|
Max Buy |
CSTR
-
NASDAQ
Coinstar Inc
DIVERSIFIED SERVICES - Personal Services
|
$61.01
|
+0.01
0.02% |
$61.52
|
1,062,820
98.20% of 50 DAV
50 DAV is 1,082,300
|
$71.82
-15.05%
|
6/26/2012
|
$64.05
|
PP = $67.00
|
|
MB = $70.35
|
Most Recent Note - 7/19/2012 6:34:53 PM
G - Slumped further below its 50 DMA line with above average volume behind today's 5th consecutive damaging loss. Disciplined investors always limit losses by selling if any stock falls more than -7% from their purchase price.
>>> The latest Featured Stock Update with an annotated graph appeared on 6/26/2012. Click here.
View all notes |
Alert me of new notes |
CANSLIM.net Company Profile |
SEC |
Zacks Reports |
StockTalk |
News |
Chart |
Request a new note
C
A N
S L
I M
|
CTRX
-
NASDAQ
Catamaran Corp
COMPUTER SOFTWARE and SERVICES - Healthcare Information Service
|
$89.88
|
-0.44
-0.49% |
$90.43
|
606,661
52.19% of 50 DAV
50 DAV is 1,162,500
|
$104.79
-14.23%
|
6/14/2012
|
$94.71
|
PP = $100.60
|
|
MB = $105.63
|
Most Recent Note - 7/19/2012 6:37:43 PM
G - Finished in the upper half of its intra-day range today after slumping further below its 50 DMA line toward prior lows in the $86 area defining important near-term support. A rebound above the 50 DMA line is needed to improve its technical stance.
>>> The latest Featured Stock Update with an annotated graph appeared on 7/16/2012. Click here.
View all notes |
Alert me of new notes |
CANSLIM.net Company Profile |
SEC |
Zacks Reports |
StockTalk |
News |
Chart |
Request a new note
C
A N
S L
I M
|
DG
-
NYSE
Dollar General Corp
RETAIL - Discount, Variety Stores
|
$52.34
|
+0.05
0.10% |
$53.02
|
3,239,959
84.52% of 50 DAV
50 DAV is 3,833,400
|
$56.04
-6.60%
|
7/16/2012
|
$54.68
|
PP = $56.14
|
|
MB = $58.95
|
Most Recent Note - 7/19/2012 6:23:37 PM
Y - Volume increased behind its 2nd consecutive loss and it finished near the session low, retreating from its all-time high. It did not register volume-driven gains above its new pivot point to trigger a new (or add-on) technical buy signal. Completed another Secondary Offering on 6/05/12, its 4th Secondary Offering since September '11.
>>> The latest Featured Stock Update with an annotated graph appeared on 7/12/2012. Click here.
View all notes |
Alert me of new notes |
CANSLIM.net Company Profile |
SEC |
Zacks Reports |
StockTalk |
News |
Chart |
Request a new note
C
A N
S L
I M
|
ECHO
-
NASDAQ
Echo Global Logistics
DIVERSIFIED SERVICES - Business/Management Services
|
$17.29
|
-1.58
-8.37% |
$18.57
|
409,200
314.29% of 50 DAV
50 DAV is 130,200
|
$19.97
-13.42%
|
6/22/2012
|
$18.98
|
PP = $19.48
|
|
MB = $20.45
|
Most Recent Note - 7/20/2012 5:23:05 PM
G - Damaging loss today violated its 50 DMA line triggering a technical sell signal. Its color code is changed to green. Repeatedly noted that it did not trigger a proper technical buy signal under the fact-based system. See the latest FSU analysis for more details and a new annotated graph.
>>> The latest Featured Stock Update with an annotated graph appeared on 7/20/2012. Click here.
View all notes |
Alert me of new notes |
CANSLIM.net Company Profile |
SEC |
Zacks Reports |
StockTalk |
News |
Chart |
Request a new note
C
A N
S L
I M
|
EXPE
-
NASDAQ
Expedia Inc
INTERNET - Internet Information Providers
|
$47.10
|
-0.47
-0.98% |
$47.82
|
2,453,907
65.73% of 50 DAV
50 DAV is 3,733,500
|
$50.66
-7.03%
|
4/27/2012
|
$41.80
|
PP = $35.57
|
|
MB = $37.35
|
Most Recent Note - 7/19/2012 2:22:00 PM
G -Tallying its 3rd consecutive gain today while rebounding and consolidating above its 50 DMA line, showing resilience after briefly undercutting that important short-term average. Found support near prior highs in the $43 area defining an important support level.
>>> The latest Featured Stock Update with an annotated graph appeared on 7/10/2012. Click here.
View all notes |
Alert me of new notes |
CANSLIM.net Company Profile |
SEC |
Zacks Reports |
StockTalk |
News |
Chart |
Request a new note
C
A N
S L
I M
|
Symbol/Exchange
Company Name
Industry Group |
PRICE |
CHANGE
(%Change) |
Day High |
Volume
(% DAV)
(% 50 day avg vol) |
52 Wk Hi
% From Hi |
Featured
Date |
Price
Featured |
Pivot Featured |
|
Max Buy |
GNC
-
NYSE
G N C Holdings Inc
RETAIL - Drug Stores
|
$37.65
|
-0.37
-0.97% |
$37.87
|
781,083
33.93% of 50 DAV
50 DAV is 2,302,000
|
$42.70
-11.83%
|
6/29/2012
|
$39.20
|
PP = $40.00
|
|
MB = $42.00
|
Most Recent Note - 7/16/2012 1:08:11 PM
Y - Still sputtering below its pivot point and trading near its 50 DMA line today following last week's distributional action. Disciplined investors always limit losses if any stock falls more than -7% from their purchase price.
>>> The latest Featured Stock Update with an annotated graph appeared on 7/5/2012. Click here.
View all notes |
Alert me of new notes |
CANSLIM.net Company Profile |
SEC |
Zacks Reports |
StockTalk |
News |
Chart |
Request a new note
C
A N
S L
I M
|
GPX
-
NYSE
G P Strategies Corp
DIVERSIFIED SERVICES - Education and Training Services
|
$17.31
|
-0.23
-1.31% |
$17.35
|
62,442
111.70% of 50 DAV
50 DAV is 55,900
|
$18.99
-8.85%
|
6/29/2012
|
$18.01
|
PP = $18.15
|
|
MB = $19.06
|
Most Recent Note - 7/16/2012 1:09:52 PM
Y - Managed a "positive reversal" on 7/12/12, however recent losses completely negated the prior breakout and raised concerns. Disciplined investors always limit losses by selling any stock if it falls more than -7% from their purchase price.
>>> The latest Featured Stock Update with an annotated graph appeared on 7/6/2012. Click here.
View all notes |
Alert me of new notes |
CANSLIM.net Company Profile |
SEC |
Zacks Reports |
StockTalk |
News |
Chart |
Request a new note
C
A N
S L
I M
|
N
-
NYSE
Netsuite Inc
DIVERSIFIED SERVICES - Business/Management Services
|
$50.48
|
-3.10
-5.79% |
$52.93
|
837,651
147.45% of 50 DAV
50 DAV is 568,100
|
$56.06
-9.95%
|
6/20/2012
|
$51.83
|
PP = $51.88
|
|
MB = $54.47
|
Most Recent Note - 7/20/2012 5:28:53 PM
Y - Damaging loss on above average volume today erased the week's rebound above its pivot point and above previous chart highs which had been achieved by gains on lighter or average volume. Its 50 DMA line defines important near-term support. See the latest FSU analysis for more details and a new annotated graph.
>>> The latest Featured Stock Update with an annotated graph appeared on 7/19/2012. Click here.
View all notes |
Alert me of new notes |
CANSLIM.net Company Profile |
SEC |
Zacks Reports |
StockTalk |
News |
Chart |
Request a new note
C
A N
S L
I M
|
NSM
-
NYSE
Nationstar Mtg Hldgs Inc
FINANCIAL SERVICES - Credit Services
|
$24.07
|
+0.07
0.29% |
$24.19
|
313,626
39.20% of 50 DAV
50 DAV is 800,100
|
$25.11
-4.14%
|
6/27/2012
|
$20.29
|
PP = $20.46
|
|
MB = $21.48
|
Most Recent Note - 7/16/2012 5:11:01 PM
G - Hovering at its 52-week high with volume totals cooling in the past week after getting extended from its prior base. Prior highs in the $20 area define important support to watch on pullbacks.
>>> The latest Featured Stock Update with an annotated graph appeared on 6/27/2012. Click here.
View all notes |
Alert me of new notes |
CANSLIM.net Company Profile |
SEC |
Zacks Reports |
StockTalk |
News |
Chart |
Request a new note
C
A N
S L
I M
|
TDG
-
NYSE
Transdigm Group Inc
AEROSPACE/DEFENSE - Aerospace/Defense Products and; Services
|
$129.70
|
-0.27
-0.21% |
$130.64
|
265,793
55.14% of 50 DAV
50 DAV is 482,000
|
$136.34
-4.87%
|
6/18/2012
|
$127.00
|
PP = $132.79
|
|
MB = $139.43
|
Most Recent Note - 7/18/2012 6:16:34 PM
Y - Found support at its 50 DMA line after a recent breakout attempt lacked volume conviction. See the latest FSU analysis for more details and a new annotated graph.
>>> The latest Featured Stock Update with an annotated graph appeared on 7/18/2012. Click here.
View all notes |
Alert me of new notes |
CANSLIM.net Company Profile |
SEC |
Zacks Reports |
StockTalk |
News |
Chart |
Request a new note
C
A N
S L
I M
|
Symbol/Exchange
Company Name
Industry Group |
PRICE |
CHANGE
(%Change) |
Day High |
Volume
(% DAV)
(% 50 day avg vol) |
52 Wk Hi
% From Hi |
Featured
Date |
Price
Featured |
Pivot Featured |
|
Max Buy |
TNGO
-
NASDAQ
Tangoe Inc
COMPUTER SOFTWARE and SERVICES - Technical and System Software
|
$20.55
|
-1.07
-4.95% |
$21.50
|
384,508
74.19% of 50 DAV
50 DAV is 518,300
|
$23.05
-10.85%
|
6/27/2012
|
$21.70
|
PP = $23.15
|
|
MB = $24.31
|
Most Recent Note - 7/20/2012 5:31:59 PM
G - Color code is changed to green after finishing the week slumping back below its 50 DMA line hurting its technical stance. It did not trigger a new technical buy signal since recently featured again in yellow.
>>> The latest Featured Stock Update with an annotated graph appeared on 6/28/2012. Click here.
View all notes |
Alert me of new notes |
CANSLIM.net Company Profile |
SEC |
Zacks Reports |
StockTalk |
News |
Chart |
Request a new note
C
A N
S L
I M
|
VSI
-
NYSE
Vitamin Shoppe Inc
SPECIALTY RETAIL - Specialty Retail, Other
|
$54.27
|
-1.30
-2.34% |
$55.32
|
220,159
51.21% of 50 DAV
50 DAV is 429,900
|
$58.22
-6.78%
|
6/29/2012
|
$54.93
|
PP = $55.03
|
|
MB = $57.78
|
Most Recent Note - 7/16/2012 1:06:08 PM
Y - Slumping below its pivot point with today's loss. Recent gains helped it trade above the new pivot point based on its 6/22/12 high after forming an 8-week cup-with-handle base, but the gains have lacked the volume required to trigger a proper new (or add-on) technical buy signal.
>>> The latest Featured Stock Update with an annotated graph appeared on 7/2/2012. Click here.
View all notes |
Alert me of new notes |
CANSLIM.net Company Profile |
SEC |
Zacks Reports |
StockTalk |
News |
Chart |
Request a new note
C
A N
S L
I M
|
WFM
-
NASDAQ
Whole Foods Market Inc
RETAIL - Grocery Stores
|
$84.03
|
-6.51
-7.19% |
$89.00
|
6,904,248
378.73% of 50 DAV
50 DAV is 1,823,000
|
$97.25
-13.59%
|
6/13/2012
|
$89.90
|
PP = $91.60
|
|
MB = $96.18
|
Most Recent Note - 7/20/2012 5:20:17 PM
Gapped down today and suffered a considerable loss with nearly 4 times average volume. A weak finish on the prior session triggered technical sell signals by violating its 50 DMA and previously noted lows. Based on the damaging action it will be dropped from the Featured Stocks list tonight.
>>> The latest Featured Stock Update with an annotated graph appeared on 7/13/2012. Click here.
View all notes |
Alert me of new notes |
CANSLIM.net Company Profile |
SEC |
Zacks Reports |
StockTalk |
News |
Chart |
Request a new note
C
A N
S L
I M
|
|
|
|
THESE ARE NOT BUY RECOMMENDATIONS!
Comments contained in the body of this report are technical
opinions only. The material herein has been obtained
from sources believed to be reliable and accurate, however,
its accuracy and completeness cannot be guaranteed.
This site is not an investment advisor, hence it does
not endorse or recommend any securities or other investments.
Any recommendation contained in this report may not
be suitable for all investors and it is not to be deemed
an offer or solicitation on our part with respect to
the purchase or sale of any securities. All trademarks,
service marks and trade names appearing in this report
are the property of their respective owners, and are
likewise used for identification purposes only.
This report is a service available
only to active Paid Premium Members.
You may opt-out of receiving report notifications
at any time. Questions or comments may be submitted
by writing to Premium Membership Services 665 S.E. 10 Street, Suite 201 Deerfield Beach, FL 33441-5634 or by calling 1-800-965-8307
or 954-785-1121.
|
|
|

