You are not logged in.
This means you
CAN ONLY VIEW reports that were published prior to Monday, April 14, 2025.
You
MUST UPGRADE YOUR MEMBERSHIP if you want to see any current reports.
AFTER MARKET UPDATE - FRIDAY, JULY 19TH, 2013
Previous After Market Report Next After Market Report >>>
|
|
|
|
DOW |
-4.80 |
15,543.74 |
-0.03% |
|
Volume |
871,830,580 |
+30% |
|
Volume |
1,710,247,590 |
+5% |
|
NASDAQ |
-23.67 |
3,587.61 |
-0.66% |
|
Advancers |
1,525 |
49% |
|
Advancers |
1,158 |
45% |
|
S&P 500 |
+2.72 |
1,692.09 |
+0.16% |
|
Decliners |
1,451 |
47% |
|
Decliners |
1,278 |
50% |
|
Russell 2000 |
+0.21 |
1,050.48 |
+0.02% |
|
52 Wk Highs |
252 |
|
|
52 Wk Highs |
214 |
|
|
S&P 600 |
-0.10 |
590.25 |
-0.02% |
|
52 Wk Lows |
16 |
|
|
52 Wk Lows |
11 |
|
|
 |
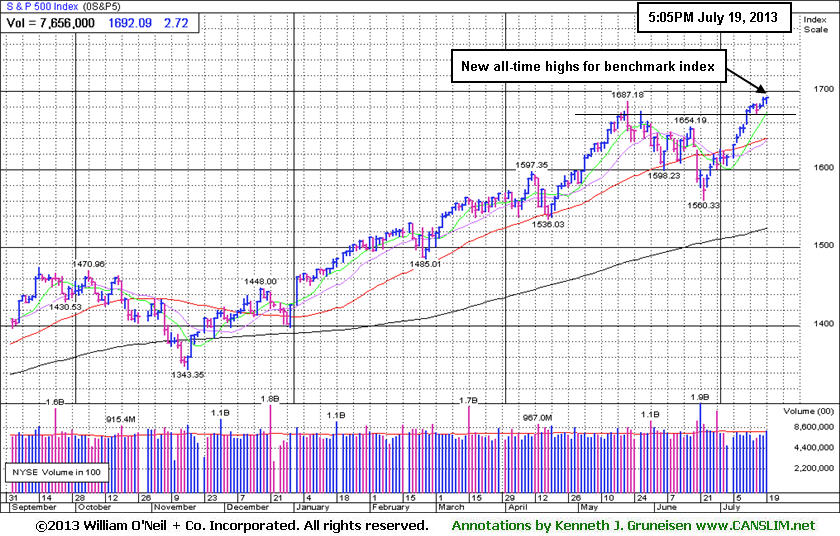
Dow Industrials and S&P 500 at All-Time Highs After 4th Week of Gains
Kenneth J. Gruneisen - Passed the CAN SLIM® Master's Exam
A retreat among tech companies pushed the Nasdaq Composite Index into negative territory for the week with a loss of nearly -0.4%. However, the Dow held onto a weekly advance of +0.5% and the S&P 500 increased +0.7% marking their fourth consecutive week of positive returns. Volume totals were reported higher than the prior session on the NYSE and on the Nasdaq exchange. Advancers and decliners were evenly mixed on the NYSE and on the Nasdaq exchange. There were 89 high-ranked companies from the CANSLIM.net Leaders List made new 52-week highs and appeared on the CANSLIM.net BreakOuts Page, up from the prior session total of 85 stocks. The list of stocks hitting new 52-week highs contracted but still easily outnumbered new 52-week lows on both the NYSE and the Nasdaq exchange. There were gains for 6 of the 12 high-ranked companies currently included on the Featured Stocks Page.
Weak earnings results from the Technology sector caused stocks to take a breather. Google Inc (GOOG -1.55%) and Microsoft Corp (MSFT -11.40%) fell after both tech giants delivered disappointing second-quarter profit tallies. Financials also lagged behind as bank stocks snapped a two-day rally. JP Morgan Chase & Co (JPM -0.37%) and Citigroup Inc (C -0.65%) lost ground. Gains in Health Care helped limit losses thanks to Johnson & Johnson's (JNJ +2.28%) advance. Industrials also finished higher as an encouraging earnings report from General Electric Co (GE +4.61%).
In fixed-income, Treasuries increased and posted back-to-back weekly gains. The 10-year note was up 13/32 to yield 2.48% and the 30-year bond gained over a full point to yield 3.56%.
The market (M criteria) has flashed substantial strength and leadership. Now in a confirmed rally, odds are considered favorable for investors' success with new buying efforts. Investors should be disciplined and selective while looking to be proactive and focused exclusively on the individual leaders best matching the winning models of the fact-based investment system. Study the companies on the CANSLIM.net Featured Stocks Page - a page showing the most action-worthy candidates' latest notes and links to additional resources including detailed analysis with data-packed graphs which are annotated by a Certified expert. The Premium Member Homepage - includes "dynamic archives" to all prior pay reports published. Watch for an announcement via email concerning the next WEBCAST.
PICTURED: The benchmark S&P 500 Index is perched at an all-time high after posting 11 gains in the span of 12 sessions, and it is up +18.65% year-to-date.
|
 Kenneth J. Gruneisen started out as a licensed stockbroker in August 1987, a couple of months prior to the historic stock market crash that took the Dow Jones Industrial Average down -22.6% in a single day. He has published daily fact-based fundamental and technical analysis on high-ranked stocks online for two decades. Through FACTBASEDINVESTING.COM, Kenneth provides educational articles, news, market commentary, and other information regarding proven investment systems that work in good times and bad.
Comments contained in the body of this report are technical opinions only and are not necessarily those of Gruneisen Growth Corp. The material herein has been obtained from sources believed to be reliable and accurate, however, its accuracy and completeness cannot be guaranteed. Our firm, employees, and customers may effect transactions, including transactions contrary to any recommendation herein, or have positions in the securities mentioned herein or options with respect thereto. Any recommendation contained in this report may not be suitable for all investors and it is not to be deemed an offer or solicitation on our part with respect to the purchase or sale of any securities. |
|
 |
Commodity-Linked Groups Led Friday's Gainers
Kenneth J. Gruneisen - Passed the CAN SLIM® Master's Exam
Commodity-linked groups were Friday's leading gainers as the Integrated Oil Index ($XOI +1.22%) and the Oil Services Index ($OSX +1.27%) posted gains and the Gold & Silver Index ($XAU +3.76%) was a standout. The Internet Index ($IIX -0.73%) and the Semiconductor Index ($SOX -0.22%) both lost ground while the Networking Index ($NWX +1.25%) led the tech sector. The Biotechnology Index ($BTK +0.45%) and the Healthcare Index ($HMO +0.69%) each posted a modest gain. The Retail Index ($RLX -0.05%) and Broker/Dealer Index ($XBD -0.02%) finished flat while the Bank Index ($BKX +0.29%) eked out a small gain.
Charts courtesy www.stockcharts.com
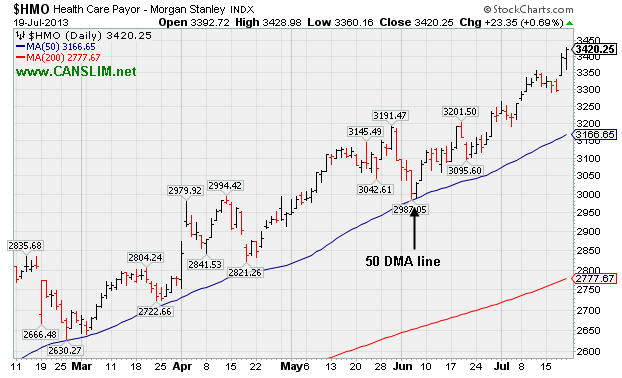
PICTURED: The Healthcare Index ($HMO +0.69%) is perched at its 2013 high. It found support at its 50-day moving average (DMA) line throughout its ongoing advance.
| Oil Services |
$OSX |
272.05 |
+3.40 |
+1.27% |
+23.57% |
| Healthcare |
$HMO |
3,420.25 |
+23.35 |
+0.69% |
+36.04% |
| Integrated Oil |
$XOI |
1,407.01 |
+17.03 |
+1.22% |
+13.30% |
| Semiconductor |
$SOX |
486.17 |
-1.05 |
-0.22% |
+26.59% |
| Networking |
$NWX |
284.35 |
+3.52 |
+1.25% |
+25.51% |
| Internet |
$IIX |
404.39 |
-2.99 |
-0.73% |
+23.67% |
| Broker/Dealer |
$XBD |
134.32 |
-0.03 |
-0.02% |
+42.40% |
| Retail |
$RLX |
837.78 |
-0.39 |
-0.05% |
+28.29% |
| Gold & Silver |
$XAU |
94.82 |
+3.44 |
+3.76% |
-42.74% |
| Bank |
$BKX |
66.05 |
+0.19 |
+0.29% |
+28.80% |
| Biotech |
$BTK |
2,167.62 |
+9.66 |
+0.45% |
+40.12% |
|
|
|
 |
Consolidating Above Prior Highs Following Latest Breakout
Kenneth J. Gruneisen - Passed the CAN SLIM® Master's Exam
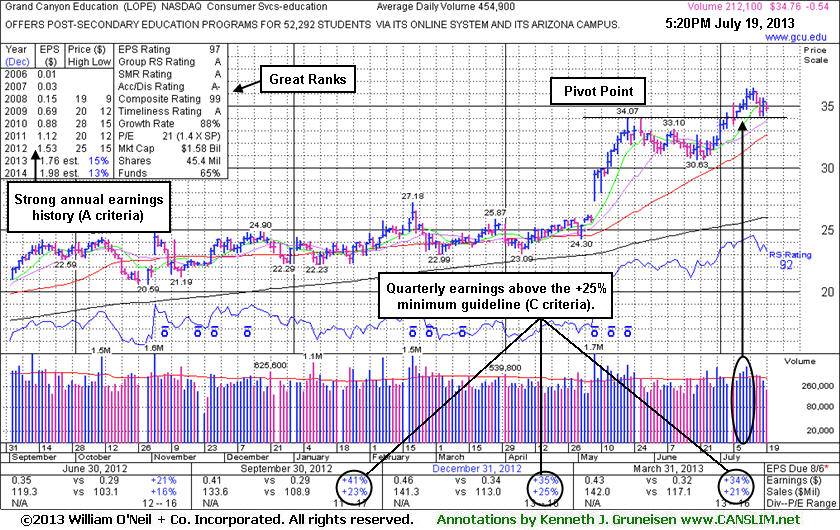
Grand Canyon Education's (LOPE -$0.54 or -1.53% to $34.76) color code was changed yellow while pulling back below its "max buy" level. It has been consolidating after a streak of volume-driven gains last week triggered a new technical buy signal and it got extended from the latest base. Prior highs in the $34 area define initial support above its 50-day moving average (DMA) line (now $32.63). Disciplined investors do not chase stocks more than +5% above their prior high or pivot point, and they always limit losses by selling if the stock falls more than -7% from their purchase price.
The Commercial Services - Schools group has shown leadership (L criteria) and currently has an A Rating. It powered above the new pivot point cited based on its 5/22/13 high plus 10 cents when it was last shown in this FSU section on 7/02/13 with an annotated graph under the headline, "Formed New Base While Perched Near All-Time Highs". As it blasted into all-time high territory back in May, rallying above an earlier pivot point and also above its April 2010 high (N criteria), it was noted - "Showing bullish technical action which may mark the beginning of a meaningful and sustained advance in price."
The number of top-rated funds owning its shares rose from 200 in Mar '12 to 288 in Jun '13, a reassuring trend concerning the I criteria. Its current Up/Down Volume Ratio of 2.3 is an unbiased indication that its shares have been under accumulation over the past 50 days. It most recently reported earnings +34% on +21% sales revenues for the Mar '13 quarter, and earnings increases were above the +25% minimum earnings guideline (C criteria) the past 3 quarterly comparisons. Its Relative Strength Rating (92) remains above the 80+ minimum guideline for buy candidates under the fact-based investment system.
|
|
|
Color Codes Explained :
Y - Better candidates highlighted by our
staff of experts.
G - Previously featured
in past reports as yellow but may no longer be buyable under the
guidelines.
***Last / Change / Volume data in this table is the closing quote data***
Symbol/Exchange
Company Name
Industry Group |
PRICE |
CHANGE
(%Change) |
Day High |
Volume
(% DAV)
(% 50 day avg vol) |
52 Wk Hi
% From Hi |
Featured
Date |
Price
Featured |
Pivot Featured |
|
Max Buy |
AMBA
-
NASDAQ
Ambarella Inc
ELECTRONICS - Semiconductor - Specialized
|
$18.96
|
+0.37
1.99% |
$18.98
|
947,183
77.09% of 50 DAV
50 DAV is 1,228,700
|
$19.30
-1.76%
|
7/15/2013
|
$17.87
|
PP = $18.68
|
|
MB = $19.61
|
Most Recent Note - 7/18/2013 12:28:44 PM
Y - Reversed into the red after early gains into new high territory today. On the prior session it broke out from its latest base pattern with +65% above average volume triggering a new (or add-on) technical buy signal. See the latest FSU analysis for more details and a new annotated graph.
>>> The latest Featured Stock Update with an annotated graph appeared on 7/17/2013. Click here.
View all notes |
Alert me of new notes |
CANSLIM.net Company Profile |
SEC |
Zacks Reports |
StockTalk |
News |
Chart |
Request a new note
C
A N
S L
I M


|
CELG
-
NASDAQ
Celgene Corp
DRUGS - Drug Manufacturers - Major
|
$135.89
|
+2.84
2.13% |
$136.45
|
3,470,753
115.50% of 50 DAV
50 DAV is 3,004,900
|
$137.80
-1.39%
|
7/11/2013
|
$133.25
|
PP = $131.92
|
|
MB = $138.52
|
Most Recent Note - 7/18/2013 12:40:33 PM
Y - Up from earlier lows after a small gap down today. Prior highs define initial support to watch. Breakaway gap and solid gain with twice average volume on 7/11/13 triggered a technical buy signal. Disciplined investors always limit losses by selling if any stock falls more than -7% from their purchase price.
>>> The latest Featured Stock Update with an annotated graph appeared on 7/11/2013. Click here.
View all notes |
Alert me of new notes |
CANSLIM.net Company Profile |
SEC |
Zacks Reports |
StockTalk |
News |
Chart |
Request a new note
C
A N
S L
I M
|
FLT
-
NYSE
Fleetcor Technologies
DIVERSIFIED SERVICES - Business/Management Services
|
$86.87
|
-0.13
-0.15% |
$87.07
|
278,235
34.95% of 50 DAV
50 DAV is 796,200
|
$89.75
-3.21%
|
5/29/2013
|
$86.02
|
PP = $85.66
|
|
MB = $89.94
|
Most Recent Note - 7/18/2013 5:51:55 PM
G- Recently found support near its 50 DMA line with gains lacking volume conviction. Prior low ($80.28 on 6/21/13) defines the next important near-term support where a violation would raise more serious concerns. See the latest FSU analysis for more details and a new annotated graph.
>>> The latest Featured Stock Update with an annotated graph appeared on 7/18/2013. Click here.
View all notes |
Alert me of new notes |
CANSLIM.net Company Profile |
SEC |
Zacks Reports |
StockTalk |
News |
Chart |
Request a new note
C
A N
S L
I M
|
LOPE
-
NASDAQ
Grand Canyon Education
DIVERSIFIED SERVICES - Education and; Training Services
|
$34.76
|
-0.54
-1.53% |
$35.33
|
212,192
46.65% of 50 DAV
50 DAV is 454,900
|
$36.45
-4.64%
|
6/19/2013
|
$31.47
|
PP = $34.17
|
|
MB = $35.88
|
Most Recent Note - 7/15/2013 6:56:54 PM
G - Inched further above its "max buy" level with today's 6th consecutive gain into new 52-week high territory. Volume-driven gains last week triggered a new technical buy signal. Prior highs in the $34 area define initial support above its 50 DMA line.
>>> The latest Featured Stock Update with an annotated graph appeared on 7/19/2013. Click here.
View all notes |
Alert me of new notes |
CANSLIM.net Company Profile |
SEC |
Zacks Reports |
StockTalk |
News |
Chart |
Request a new note
C
A N
S L
I M
|
PCLN
-
NASDAQ
Priceline.Com Inc
INTERNET - Internet Software and Services
|
$896.29
|
-3.31
-0.37% |
$900.52
|
717,855
95.55% of 50 DAV
50 DAV is 751,300
|
$926.40
-3.25%
|
7/8/2013
|
$878.28
|
PP = $847.43
|
|
MB = $889.80
|
 Most Recent Note - 7/19/2013 5:54:01 PM
G - Endured mild distributional pressure this week while consolidating after getting extended from its prior base. Prior highs in the $847 area define initial support to watch on pullbacks.
>>> The latest Featured Stock Update with an annotated graph appeared on 7/9/2013. Click here.
View all notes |
Alert me of new notes |
CANSLIM.net Company Profile |
SEC |
Zacks Reports |
StockTalk |
News |
Chart |
Request a new note
C
A N
S L
I M
|
Symbol/Exchange
Company Name
Industry Group |
PRICE |
CHANGE
(%Change) |
Day High |
Volume
(% DAV)
(% 50 day avg vol) |
52 Wk Hi
% From Hi |
Featured
Date |
Price
Featured |
Pivot Featured |
|
Max Buy |
PRLB
-
NYSE
Proto Labs Inc
MANUFACTURING - Small Tools and Accessories
|
$64.13
|
-0.43
-0.67% |
$64.70
|
234,166
52.19% of 50 DAV
50 DAV is 448,700
|
$67.40
-4.85%
|
6/17/2013
|
$59.37
|
PP = $59.94
|
|
MB = $62.94
|
Most Recent Note - 7/19/2013 5:55:47 PM
G - Still holding its ground in a tight rage with volume totals cooling. Prior highs near $59 coincide with its 50 DMA line defining important support.
>>> The latest Featured Stock Update with an annotated graph appeared on 7/15/2013. Click here.
View all notes |
Alert me of new notes |
CANSLIM.net Company Profile |
SEC |
Zacks Reports |
StockTalk |
News |
Chart |
Request a new note
C
A N
S L
I M
|
RRTS
-
NYSE
Roadrunner Trans Systems
TRANSPORTATION - Air Delivery and Freight Service
|
$29.97
|
+0.14
0.47% |
$30.00
|
87,121
52.23% of 50 DAV
50 DAV is 166,800
|
$30.50
-1.74%
|
4/3/2013
|
$22.77
|
PP = $23.75
|
|
MB = $24.94
|
Most Recent Note - 7/15/2013 6:53:03 PM
G - Wedged higher without great volume conviction after finding support above its 50 DMA line, and it is perched at its 52-week high extended from any sound base.
>>> The latest Featured Stock Update with an annotated graph appeared on 7/3/2013. Click here.
View all notes |
Alert me of new notes |
CANSLIM.net Company Profile |
SEC |
Zacks Reports |
StockTalk |
News |
Chart |
Request a new note
C
A N
S L
I M
|
SFUN
-
NYSE
Soufun Hldgs Ltd Ads A
INTERNET - Internet Information Providers
|
$31.50
|
-0.05
-0.16% |
$31.84
|
372,175
115.15% of 50 DAV
50 DAV is 323,200
|
$33.03
-4.63%
|
7/16/2013
|
$29.54
|
PP = $27.90
|
|
MB = $29.30
|
Most Recent Note - 7/17/2013 1:13:21 PM
G - Pulling back today with a volume-driven loss. Prior highs in the $28-29 area define initial support to watch. Color code was changed to green after quickly getting extended from its latest base. Considerable gain backed by 5 times average volume triggered a technical buy signal and it finished strong after highlighted in yellow with pivot point cited based on its 5/28/13 high plus 10 cents with the annotated daily graph below included in the 7/16/13 mid-day report. See the latest FSU analysis for more details plus an annotated weekly graph.

>>> The latest Featured Stock Update with an annotated graph appeared on 7/16/2013. Click here.
View all notes |
Alert me of new notes |
CANSLIM.net Company Profile |
SEC |
Zacks Reports |
StockTalk |
News |
Chart |
Request a new note
C
A N
S L
I M
|
SSNC
-
NASDAQ
S S & C Technologies
COMPUTER SOFTWARE and SERVICES - Application Software
|
$37.00
|
+0.13
0.35% |
$37.03
|
171,132
36.44% of 50 DAV
50 DAV is 469,600
|
$38.47
-3.82%
|
7/11/2013
|
$35.80
|
PP = $34.54
|
|
MB = $36.27
|
Most Recent Note - 7/19/2013 5:58:50 PM
G - Holding its ground in a tight range near its all-time high with volume totals cooling. Extended from its prior base, and prior highs in the $34 area define initial support to watch on pullbacks.
>>> The latest Featured Stock Update with an annotated graph appeared on 7/12/2013. Click here.
View all notes |
Alert me of new notes |
CANSLIM.net Company Profile |
SEC |
Zacks Reports |
StockTalk |
News |
Chart |
Request a new note
C
A N
S L
I M
|
SSYS
-
NASDAQ
Stratasys Ltd
COMPUTER HARDWARE - Computer Peripherals
|
$90.07
|
+0.53
0.59% |
$90.10
|
427,920
50.22% of 50 DAV
50 DAV is 852,100
|
$96.44
-6.61%
|
7/8/2013
|
$91.44
|
PP = $95.00
|
|
MB = $99.75
|
Most Recent Note - 7/16/2013 3:29:49 PM
Y - Encountering distributional pressure while perched at its 52-week high near previously stubborn resistance. Did not yet rally for a close above the pivot point based on its 5/14/13 high plus 10 cents with sufficient volume to clinch a proper technical buy signal.
>>> The latest Featured Stock Update with an annotated graph appeared on 7/8/2013. Click here.
View all notes |
Alert me of new notes |
CANSLIM.net Company Profile |
SEC |
Zacks Reports |
StockTalk |
News |
Chart |
Request a new note
C
A N
S L
I M
|
Symbol/Exchange
Company Name
Industry Group |
PRICE |
CHANGE
(%Change) |
Day High |
Volume
(% DAV)
(% 50 day avg vol) |
52 Wk Hi
% From Hi |
Featured
Date |
Price
Featured |
Pivot Featured |
|
Max Buy |
VRX
-
NYSE
Valeant Pharmaceuticals
DRUGS - Drug Manufacturers - Other
|
$90.80
|
-0.59
-0.65% |
$91.49
|
1,081,458
52.58% of 50 DAV
50 DAV is 2,056,800
|
$96.25
-5.66%
|
4/30/2013
|
$60.24
|
PP = $76.66
|
|
MB = $80.49
|
Most Recent Note - 7/19/2013 6:03:48 PM
Y- Completed a new Public Offering on 6/18/13 following recent M&A news. Formed a cup-with-handle base over the past 8 weeks, however no new pivot point is being cited. Concerns were raised by its Mar '13 earnings report with only a +14% earnings increase, below the +25% minimum guideline (C criteria) for buy candidates.
>>> The latest Featured Stock Update with an annotated graph appeared on 7/5/2013. Click here.
View all notes |
Alert me of new notes |
CANSLIM.net Company Profile |
SEC |
Zacks Reports |
StockTalk |
News |
Chart |
Request a new note
C
A N
S L
I M
|
YNDX
-
NASDAQ
Yandex N V Class A
INTERNET - Internet Information Providers
|
$31.20
|
+0.34
1.10% |
$31.46
|
2,370,011
99.09% of 50 DAV
50 DAV is 2,391,800
|
$31.24
-0.13%
|
7/10/2013
|
$29.29
|
PP = $29.59
|
|
MB = $31.07
|
Most Recent Note - 7/17/2013 6:42:03 PM
Y - Posted a solid gain today for a new high close following a bout of distribution on the prior session. Found prompt support near prior highs in the $28-29 area defining initial support to watch on pullbacks.
>>> The latest Featured Stock Update with an annotated graph appeared on 7/10/2013. Click here.
View all notes |
Alert me of new notes |
CANSLIM.net Company Profile |
SEC |
Zacks Reports |
StockTalk |
News |
Chart |
Request a new note
C
A N
S L
I M
|
|
|
|
THESE ARE NOT BUY RECOMMENDATIONS!
Comments contained in the body of this report are technical
opinions only. The material herein has been obtained
from sources believed to be reliable and accurate, however,
its accuracy and completeness cannot be guaranteed.
This site is not an investment advisor, hence it does
not endorse or recommend any securities or other investments.
Any recommendation contained in this report may not
be suitable for all investors and it is not to be deemed
an offer or solicitation on our part with respect to
the purchase or sale of any securities. All trademarks,
service marks and trade names appearing in this report
are the property of their respective owners, and are
likewise used for identification purposes only.
This report is a service available
only to active Paid Premium Members.
You may opt-out of receiving report notifications
at any time. Questions or comments may be submitted
by writing to Premium Membership Services 665 S.E. 10 Street, Suite 201 Deerfield Beach, FL 33441-5634 or by calling 1-800-965-8307
or 954-785-1121.
|
|
|

