You are not logged in.
This means you
CAN ONLY VIEW reports that were published prior to Monday, April 14, 2025.
You
MUST UPGRADE YOUR MEMBERSHIP if you want to see any current reports.
AFTER MARKET UPDATE - MONDAY, JULY 18TH, 2011
Previous After Market Report Next After Market Report >>>
|
|
|
|
DOW |
-94.57 |
12,385.16 |
-0.76% |
|
Volume |
874,431,220 |
-19% |
|
Volume |
1,713,908,030 |
-3% |
|
NASDAQ |
-24.69 |
2,765.11 |
-0.89% |
|
Advancers |
443 |
14% |
|
Advancers |
544 |
20% |
|
S&P 500 |
-10.70 |
1,305.44 |
-0.81% |
|
Decliners |
2,595 |
84% |
|
Decliners |
2,042 |
76% |
|
Russell 2000 |
-12.81 |
815.97 |
-1.55% |
|
52 Wk Highs |
37 |
|
|
52 Wk Highs |
36 |
|
|
S&P 600 |
-6.04 |
439.85 |
-1.35% |
|
52 Wk Lows |
95 |
|
|
52 Wk Lows |
71 |
|
|
 |
Breadth Negative Amid Growing Uncertainty
Kenneth J. Gruneisen - Passed the CAN SLIM® Master's Exam
Behind the indices' losses on Monday there was lighter volume reported on the NYSE and on the Nasdaq exchange. Friday's higher volume totals were influenced by options expirations which typically boost volume across the board. Breadth was clearly negative on Monday's session as declining issues beat advancing shares by more than 5-1 on the NYSE and by nearly 4-1 on the Nasdaq exchange. Also, new 52-week lows outnumbered new 52-week highs for the first times since June 23rd on both the NYSE and the Nasdaq exchange. There were 19 high-ranked companies from the CANSLIM.net Leaders List that made new 52-week highs and appeared on the CANSLIM.net BreakOuts Page, up just slightly from the total of 15 on the prior session. There were 6 gainers out of the 17 high-ranked leaders currently included on the Featured Stocks Page.
The stock market pared losses late in the day but still took a broad hit on worries about the U.S. debt limit and rising sovereign debt yields in Europe. The nation is still without an agreement on the debt limit two weeks before the Treasury's deadline, but stock futures did cut early losses this morning when Treasury Secretary Tim Geithner told Steve Liesman in a CNBC television interview that a possible U.S. default has been "taken off the table" by members of Congress. Uncertainty remains, and the market has shown its distaste for the lack of any meaningful agreed upon plan.
Financial stocks were the biggest losers as the results from last Friday's bank stress tests in Europe and Mr. Geithner's latest reassurances, together, failed to make believers of investors. Barclays Plc (BCS -7.1%) shares plunged on nearly 4 times average volume to lows not seen since May 2009. Bank of America Corp (BAC -2.8%) skidded to lows not seen since the same month as its U.K. counterpart. MGIC Investment (MTG -23%) shares plunged and led a slump in mortgage insurers after the company posted a loss as fewer borrowers caught up on overdue loans. The Allstate Corp (ALL -5%) fired one of its top executives over the company's performance.
In the face of a higher U.S. dollar gold rose to yet another record, nearly reaching $1,608 per ounce while building on its rally of over +7% in the past two weeks. The price of oil was down more than a dollar per barrel and closed at $95.93 per barrel. Halliburton Co (HAL +0.08%) finished flat after it posted profits that beat expectations. Meanwhile, a survey of homebuilders suggested a poor outlook, but sentiment did improve slightly in July compared to June.
Monday began a three-week period of heavy earnings announcements on Wall Street. Over 100 S&P 500 companies are scheduled to report earnings this week.
Apple Corp (AAPL +2.43%) rallied to a new all-time high ahead of its earnings report Tuesday. Int'l Business Machines (IBM -0.15%) touched new highs but finished flat ahead of its earnings reported after the close. News Corp (NWS -4.29%) fell as directors of the company began questioning its response to the phone-hacking crisis.
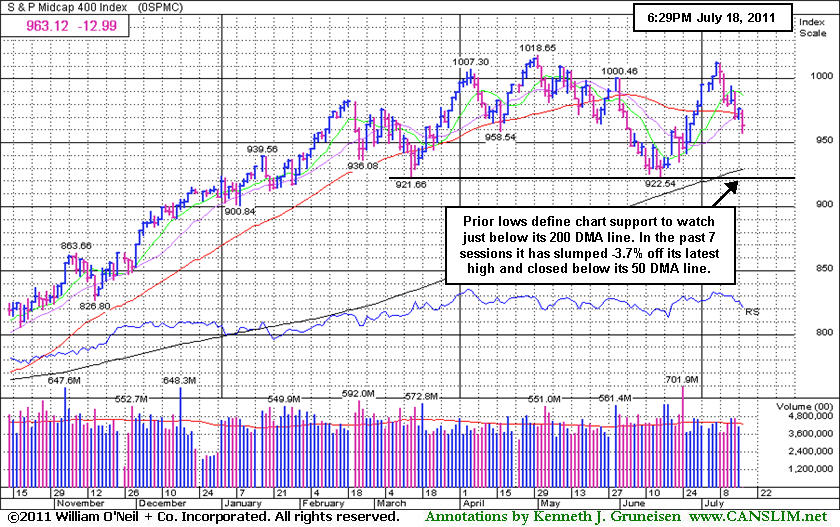
The S&P 500 Index's loss led to a close back below its sinking 50-day moving average (DMA) line. The Dow and Nasdaq traded below their respective short-term averages intra-day but managed top close above them.
Distributional pressure has put the current rally under pressure again. Our July 2011 issue of CANSLIM.net News is due to be released soon with a comprehensive summary of current market conditions that further clarifies matters concerning the M criteria! The Q2 2011 CANSLIM.net Webcast is available "ON DEMAND" now to UPGRADED MEMBERS ONLY - (CLICK HERE).
PICTURED: The S&P Mid-Cap 400 Index's prior lows define chart support to watch just below its 200 DMA line. In the past 7 sessions it has slumped -4.9% off its latest high and closed below its 50 DMA line.
|
 Kenneth J. Gruneisen started out as a licensed stockbroker in August 1987, a couple of months prior to the historic stock market crash that took the Dow Jones Industrial Average down -22.6% in a single day. He has published daily fact-based fundamental and technical analysis on high-ranked stocks online for two decades. Through FACTBASEDINVESTING.COM, Kenneth provides educational articles, news, market commentary, and other information regarding proven investment systems that work in good times and bad.
Comments contained in the body of this report are technical opinions only and are not necessarily those of Gruneisen Growth Corp. The material herein has been obtained from sources believed to be reliable and accurate, however, its accuracy and completeness cannot be guaranteed. Our firm, employees, and customers may effect transactions, including transactions contrary to any recommendation herein, or have positions in the securities mentioned herein or options with respect thereto. Any recommendation contained in this report may not be suitable for all investors and it is not to be deemed an offer or solicitation on our part with respect to the purchase or sale of any securities. |
|
 |
Financial Weakness Persists as a Negative for Market
Kenneth J. Gruneisen - Passed the CAN SLIM® Master's Exam
The financial groups continued adding to their worrisome declines on Monday as the Broker/Dealer Index ($XBD -1.33%) and Bank Index ($BKX -1.43%) sank to new 2011 lows. The Retail Index ($RLX -0.84%) also had a negative bias, and the tech sector faced pressure as the Networking Index ($NWX -2.26%), Biotechnology Index ($BTK -1.51%), Semiconductor Index ($SOX -1.39%), and Internet Index ($IIX -1.37%) suffered unanimous losses. The Healthcare Index ($HMO -1.14%) backpedaled to its 50-day moving average line with its 3rd consecutive loss. Energy-related shares ended modestly lower as the Integrated Oil Index ($XOI -0.61%) and Oil Services Index ($OSX -0.53%) edged lower. The Gold & Silver Index ($XAU +1.16%) was a standout gainer on a widely negative session.
Charts courtesy www.stockcharts.com
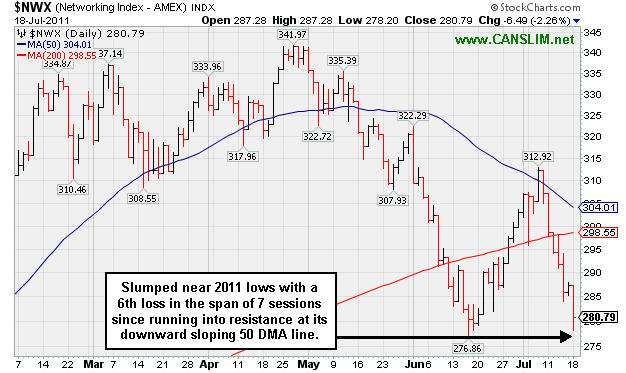
PICTURED: The Networking Index ($NWX -2.26%) slumped near 2011 lows today with a 6th loss in the span of 7 sessions since running into resistance at its downward sloping 50-day moving average (DMA) line. A few months ago it was a leading group in a stronger market, but now the path of least resistance has been leading it lower.
| Oil Services |
$OSX |
268.77 |
-1.44 |
-0.53% |
+9.65% |
| Healthcare |
$HMO |
2,405.89 |
-27.66 |
-1.14% |
+42.19% |
| Integrated Oil |
$XOI |
1,303.83 |
-8.04 |
-0.61% |
+7.47% |
| Semiconductor |
$SOX |
384.63 |
-5.44 |
-1.39% |
-6.60% |
| Networking |
$NWX |
280.79 |
-6.49 |
-2.26% |
+0.08% |
| Internet |
$IIX |
308.62 |
-4.29 |
-1.37% |
+0.29% |
| Broker/Dealer |
$XBD |
101.13 |
-1.36 |
-1.33% |
-16.78% |
| Retail |
$RLX |
538.19 |
-4.54 |
-0.84% |
+5.86% |
| Gold & Silver |
$XAU |
219.47 |
+2.52 |
+1.16% |
-3.14% |
| Bank |
$BKX |
45.63 |
-0.66 |
-1.43% |
-12.60% |
| Biotech |
$BTK |
1,413.60 |
-21.65 |
-1.51% |
+8.94% |
|
|
|
 |
Financial Services Firm Consolidating in Healthy Manner
Kenneth J. Gruneisen - Passed the CAN SLIM® Master's Exam
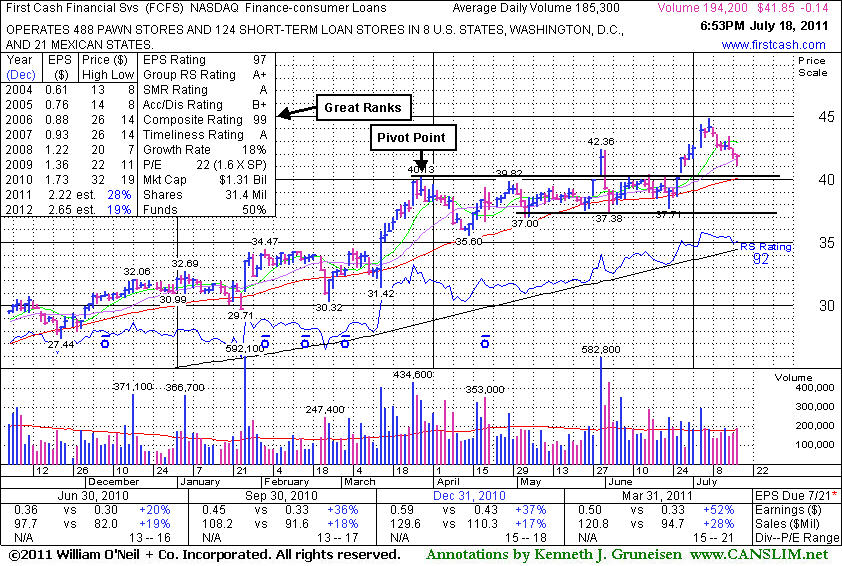
First Cash Financial Services Inc. (FCFS -$0.14 or -0.33% to $41.85) is consolidating -6.7 off its all-time high today. It is not very extended from its last base identified in earlier CANSLIM.net reports following its normal consolidation. Its color code is changed to yellow again. Prior highs in the $40-42 area define initial support areas to watch along with its 50-day moving average (DMA) line. After its last appearance in this FSU section was on 6/22/11 with an annotated graph under the headline, "Faltering After Breakout Yet Finding Support", its prior lows in the $37 area defined support. A new pivot point was not cited, however some may have considered its latest consolidation a new "square box" type base pattern. Its color code was changed to yellow based on resilience after negating its prior breakout yet finding great support, while we stuck with our earlier analysis' pivot point and "max buy" levels.
The Finance - Consumer Loans group has several other strong leaders (L criteria) in it including EZCorp Inc (EZPW) and Credit Acceptance Corp (CACC), both of which are also currently included on the Featured Stocks list.
FCFS reported earnings +52% on +28% sales revenues for the quarter ended March 31, 2011 versus the year ago period. Its annual earnings (A criteria) history has been steady. The number of top-rated funds owning its shares rose slightly from 336 in Jun '10 to 351 in Mar '11. Recent signs of improvement in the M criteria (market direction) have been followed by questionable action at best. Remember that 3 out of 4 stocks tend to follow along with the broader market averages' direction, so even if a stock has solid fundamentals there is no excuse to hold it if it falls more than -7% from your buy point.
|
|
|
Color Codes Explained :
Y - Better candidates highlighted by our
staff of experts.
G - Previously featured
in past reports as yellow but may no longer be buyable under the
guidelines.
***Last / Change / Volume data in this table is the closing quote data***
Symbol/Exchange
Company Name
Industry Group |
PRICE |
CHANGE
(%Change) |
Day High |
Volume
(% DAV)
(% 50 day avg vol) |
52 Wk Hi
% From Hi |
Featured
Date |
Price
Featured |
Pivot Featured |
|
Max Buy |
CACC
-
NASDAQ
Credit Acceptance Corp
FINANCIAL SERVICES - Credit Services
|
$81.73
|
-1.24
-1.49% |
$82.77
|
9,484
22.85% of 50 DAV
50 DAV is 41,500
|
$86.87
-5.92%
|
6/2/2011
|
$76.10
|
PP = $82.39
|
|
MB = $86.51
|
 Most Recent Note - 7/18/2011 7:37:58 PM
Y - Its loss today on light volume led to a close below its pivot point, raising some concerns. Prior high closes define support to watch above important chart support at its 50 DMA line.
>>> The latest Featured Stock Update with an annotated graph appeared on 6/27/2011. Click here.
View all notes |
Alert me of new notes |
CANSLIM.net Company Profile |
SEC |
Zacks Reports |
StockTalk |
News |
Chart |
Request a new note
C
A N
S L
I M


|
CMG
-
NYSE
Chipotle Mexican Grill
LEISURE - Restaurants
|
$327.99
|
+3.39
1.04% |
$328.36
|
764,564
97.97% of 50 DAV
50 DAV is 780,400
|
$329.80
-0.55%
|
4/1/2011
|
$274.00
|
PP = $275.10
|
|
MB = $288.86
|
Most Recent Note - 7/18/2011 7:39:05 PM
G - Up today near average volume for its second-best close ever. Extended from prior highs and an upward trendline that define chart support to watch.
>>> The latest Featured Stock Update with an annotated graph appeared on 7/8/2011. Click here.
View all notes |
Alert me of new notes |
CANSLIM.net Company Profile |
SEC |
Zacks Reports |
StockTalk |
News |
Chart |
Request a new note
C
A N
S L
I M
|
EW
-
NYSE
Edwards Lifesciences Cp
HEALTH SERVICES - Medical Appliances and Equipment
|
$89.69
|
+0.75
0.84% |
$89.97
|
909,043
123.34% of 50 DAV
50 DAV is 737,000
|
$91.82
-2.32%
|
7/6/2011
|
$89.19
|
PP = $90.48
|
|
MB = $95.00
|
Most Recent Note - 7/18/2011 12:44:22 PM
Y - This high-ranked Medical - Products firm is up from the session's earlier lows, perched within close striking distance of its 52-week and all-time highs. Since featured in the 7/06/11 mid-day report it encountered mild distributional pressure and did not rally for a strong close above its pivot point to trigger a proper technical buy signal.
>>> The latest Featured Stock Update with an annotated graph appeared on 7/7/2011. Click here.
View all notes |
Alert me of new notes |
CANSLIM.net Company Profile |
SEC |
Zacks Reports |
StockTalk |
News |
Chart |
Request a new note
C
A N
S L
I M
|
EZPW
-
NASDAQ
Ezcorp Inc Cl A
SPECIALTY RETAIL - Specialty Retail, Other
|
$36.27
|
-0.48
-1.31% |
$36.58
|
455,075
114.11% of 50 DAV
50 DAV is 398,800
|
$38.66
-6.18%
|
6/13/2011
|
$31.18
|
PP = $33.41
|
|
MB = $35.08
|
Most Recent Note - 7/14/2011 12:52:56 PM
G - Reversed into the red after a small gap up today. It is very extended from prior highs in the $33 area that define support to watch on pullbacks.
>>> The latest Featured Stock Update with an annotated graph appeared on 7/5/2011. Click here.
View all notes |
Alert me of new notes |
CANSLIM.net Company Profile |
SEC |
Zacks Reports |
StockTalk |
News |
Chart |
Request a new note
C
A N
S L
I M
|
FCFS
-
NASDAQ
First Cash Financial Svs
SPECIALTY RETAIL - Specialty Retail, Other
|
$41.85
|
-0.14
-0.33% |
$41.97
|
195,692
105.61% of 50 DAV
50 DAV is 185,300
|
$44.84
-6.67%
|
5/31/2011
|
$42.00
|
PP = $40.23
|
|
MB = $42.24
|
Most Recent Note - 7/18/2011 7:31:07 PM
Y - Consolidating -6.7% off its all-time high today, and its color code is changed to yellow while perched just under its "max buy" level. Prior highs in the $40-42 area define initial support areas to watch. See the latest FSU analysis for more details and a new annotated graph.
>>> The latest Featured Stock Update with an annotated graph appeared on 7/18/2011. Click here.
View all notes |
Alert me of new notes |
CANSLIM.net Company Profile |
SEC |
Zacks Reports |
StockTalk |
News |
Chart |
Request a new note
C
A N
S L
I M
|
Symbol/Exchange
Company Name
Industry Group |
PRICE |
CHANGE
(%Change) |
Day High |
Volume
(% DAV)
(% 50 day avg vol) |
52 Wk Hi
% From Hi |
Featured
Date |
Price
Featured |
Pivot Featured |
|
Max Buy |
FOSL
-
NASDAQ
Fossil Inc
CONSUMER DURABLES - Recreational Goods, Other
|
$128.92
|
+0.02
0.02% |
$130.50
|
626,034
79.15% of 50 DAV
50 DAV is 790,900
|
$130.46
-1.18%
|
2/1/2011
|
$73.30
|
PP = $74.44
|
|
MB = $78.16
|
Most Recent Note - 7/14/2011 12:54:56 PM
G - Perched at its all-time high after 4 consecutive volume-driven gains. It is extended from prior highs in the $107 area that now define initial support to watch near its 50 DMA line.
>>> The latest Featured Stock Update with an annotated graph appeared on 6/28/2011. Click here.
View all notes |
Alert me of new notes |
CANSLIM.net Company Profile |
SEC |
Zacks Reports |
StockTalk |
News |
Chart |
Request a new note
C
A N
S L
I M
|
HS
-
NYSE
Healthspring Inc
HEALTH SERVICES - Health Care Plans
|
$45.05
|
-0.50
-1.10% |
$45.90
|
1,068,603
127.37% of 50 DAV
50 DAV is 839,000
|
$48.95
-7.97%
|
6/16/2011
|
$42.44
|
PP = $45.21
|
|
MB = $47.47
|
Most Recent Note - 7/15/2011 4:18:50 PM
Y - Quietly consolidating this week under its "max buy" level. Prior resistance near $45 coinciding with its 50 DMA line defines an important support level to watch.
>>> The latest Featured Stock Update with an annotated graph appeared on 7/11/2011. Click here.
View all notes |
Alert me of new notes |
CANSLIM.net Company Profile |
SEC |
Zacks Reports |
StockTalk |
News |
Chart |
Request a new note
C
A N
S L
I M
|
INFA
-
NASDAQ
Informatica Corp
COMPUTER SOFTWARE and SERVICES - Business Software and Services
|
$53.70
|
+0.17
0.32% |
$54.24
|
3,189,493
252.61% of 50 DAV
50 DAV is 1,262,600
|
$62.42
-13.97%
|
7/1/2011
|
$59.36
|
PP = $60.08
|
|
MB = $63.08
|
Most Recent Note - 7/18/2011 7:27:33 PM
G - Gapped down today and undercut the prior low ($52.90 on 6/16/11) previously noted before it managed to find support make a positive reversal for a small gain with above average volume. It violated its 50 DMA line with a considerable loss on heavy volume triggering a technical sell signal last week and its color code was changed to green after its damaging streak of 7 consecutive losses.
>>> The latest Featured Stock Update with an annotated graph appeared on 7/12/2011. Click here.
View all notes |
Alert me of new notes |
CANSLIM.net Company Profile |
SEC |
Zacks Reports |
StockTalk |
News |
Chart |
Request a new note
C
A N
S L
I M
|
LULU
-
NASDAQ
Lululemon Athletica
MANUFACTURING - Textile Manufacturing
|
$60.48
|
-0.06
-0.10% |
$61.00
|
2,084,786
50.32% of 50 DAV
50 DAV is 4,143,300
|
$62.86
-3.79%
|
6/21/2011
|
$102.95
|
PP = $101.14
|
|
MB = $106.20
|
Most Recent Note - 7/14/2011 4:17:14 PM
G - Do not be confused by the 2:1 split impacting its share price effective 7/12/11 while perched near its all-time high. Its rally of better than +20% in less than 3 weeks after its recent technical breakout argues for investors to follow the investment system rule of holding stocks with such powerful early gains for 8 weeks minimum.
>>> The latest Featured Stock Update with an annotated graph appeared on 7/15/2011. Click here.
View all notes |
Alert me of new notes |
CANSLIM.net Company Profile |
SEC |
Zacks Reports |
StockTalk |
News |
Chart |
Request a new note
C
A N
S L
I M
|
MWIV
-
NASDAQ
M W I Veterinary Supply
HEALTH SERVICES - Medical Instruments and; Supplies
|
$81.13
|
-1.21
-1.47% |
$82.22
|
23,213
34.09% of 50 DAV
50 DAV is 68,100
|
$86.99
-6.74%
|
7/11/2011
|
$83.39
|
PP = $84.67
|
|
MB = $88.90
|
Most Recent Note - 7/14/2011 4:09:57 PM
Y - Down today on higher but below average volume, pulling back after a new high close on the prior session. Color code was changed to yellow with new pivot point cited based on its 5/20/11 high plus 10 cents. Volume-driven gains are needed to confirm a proper technical buy signal.
>>> The latest Featured Stock Update with an annotated graph appeared on 6/30/2011. Click here.
View all notes |
Alert me of new notes |
CANSLIM.net Company Profile |
SEC |
Zacks Reports |
StockTalk |
News |
Chart |
Request a new note
C
A N
S L
I M
|
Symbol/Exchange
Company Name
Industry Group |
PRICE |
CHANGE
(%Change) |
Day High |
Volume
(% DAV)
(% 50 day avg vol) |
52 Wk Hi
% From Hi |
Featured
Date |
Price
Featured |
Pivot Featured |
|
Max Buy |
OPNT
-
NASDAQ
Opnet Technologies
INTERNET - Internet Software and Services
|
$39.43
|
+0.62
1.60% |
$39.51
|
89,205
70.85% of 50 DAV
50 DAV is 125,900
|
$42.51
-7.25%
|
6/28/2011
|
$40.87
|
PP = $42.61
|
|
MB = $44.74
|
Most Recent Note - 7/14/2011 3:47:47 PM
G - Still sputtering today perched just above its 50 DMA line. Its color code was changed to green after mild distributional damage, and disciplined investors should note that it did not trigger a confirming technical buy signal after its new pivot point was recently cited. Recent lows near $36 define important near-term chart support.
>>> The latest Featured Stock Update with an annotated graph appeared on 7/1/2011. Click here.
View all notes |
Alert me of new notes |
CANSLIM.net Company Profile |
SEC |
Zacks Reports |
StockTalk |
News |
Chart |
Request a new note
C
A N
S L
I M
|
OTEX
-
NASDAQ
Open Text Corp
INTERNET - Internet Software and Services
|
$68.21
|
-0.52
-0.76% |
$69.25
|
326,029
111.73% of 50 DAV
50 DAV is 291,800
|
$72.32
-5.68%
|
6/1/2011
|
$65.86
|
PP = $67.18
|
|
MB = $70.54
|
Most Recent Note - 7/14/2011 1:27:09 PM
Y - It has reversed into the red today from earlier highs above its "max buy" level after a gap up. The 7/13/11 gain with volume +187% above average confirmed a technical buy signal.
>>> The latest Featured Stock Update with an annotated graph appeared on 6/24/2011. Click here.
View all notes |
Alert me of new notes |
CANSLIM.net Company Profile |
SEC |
Zacks Reports |
StockTalk |
News |
Chart |
Request a new note
C
A N
S L
I M
|
PRGO
-
NASDAQ
Perrigo Co
DRUGS - Drug Related Products
|
$90.64
|
-1.16
-1.26% |
$92.21
|
316,950
66.35% of 50 DAV
50 DAV is 477,700
|
$93.70
-3.27%
|
7/13/2011
|
$92.89
|
PP = $92.40
|
|
MB = $97.02
|
Most Recent Note - 7/18/2011 7:43:00 PM
Y - Quietly consolidating since hitting a new 52-week high on 7/13/11, it may be forming a high handle following a previously noted orderly saucer shaped base pattern. A strong volume-driven gain and close above its pivot point may trigger a technical buy signal, however it is considered a riskier late-stage setup.
>>> The latest Featured Stock Update with an annotated graph appeared on 7/13/2011. Click here.
View all notes |
Alert me of new notes |
CANSLIM.net Company Profile |
SEC |
Zacks Reports |
StockTalk |
News |
Chart |
Request a new note
C
A N
S L
I M
|
QSII
-
NASDAQ
Quality Systems Inc
COMPUTER SOFTWARE and SERVICES - Healthcare Information Service
|
$85.55
|
-1.17
-1.35% |
$86.47
|
109,241
47.60% of 50 DAV
50 DAV is 229,500
|
$92.38
-7.39%
|
7/6/2011
|
$91.26
|
PP = $91.67
|
|
MB = $96.25
|
Most Recent Note - 7/18/2011 12:07:24 PM
G - Pulling back below its 50 DMA line today, raising concerns with its 6th consecutive loss, and its color code is changed to green after slumping -8% off its high. Disciplined investors may note that it failed to convincingly trigger a new technical buy signal after recently featured in yellow in the 7/06/11 mid-day report.
>>> The latest Featured Stock Update with an annotated graph appeared on 7/6/2011. Click here.
View all notes |
Alert me of new notes |
CANSLIM.net Company Profile |
SEC |
Zacks Reports |
StockTalk |
News |
Chart |
Request a new note
C
A N
S L
I M
|
SWI
-
NYSE
Solar Winds
COMPUTER SOFTWARE and SERVICES - Application Software
|
$23.68
|
-0.16
-0.67% |
$23.74
|
899,504
106.00% of 50 DAV
50 DAV is 848,600
|
$26.68
-11.24%
|
6/7/2011
|
$24.22
|
PP = $25.05
|
|
MB = $26.30
|
Most Recent Note - 7/14/2011 3:40:11 PM
G - Color code is changed to green after a more damaging loss today with heavier volume, its 5th consecutive loss, leading to a violation of its 50 DMA line triggering a technical sell signal.
>>> The latest Featured Stock Update with an annotated graph appeared on 6/29/2011. Click here.
View all notes |
Alert me of new notes |
CANSLIM.net Company Profile |
SEC |
Zacks Reports |
StockTalk |
News |
Chart |
Request a new note
C
A N
S L
I M
|
Symbol/Exchange
Company Name
Industry Group |
PRICE |
CHANGE
(%Change) |
Day High |
Volume
(% DAV)
(% 50 day avg vol) |
52 Wk Hi
% From Hi |
Featured
Date |
Price
Featured |
Pivot Featured |
|
Max Buy |
ULTA
-
NASDAQ
Ulta Salon Cosm & Frag
SPECIALTY RETAIL - Specialty Retail, Other
|
$63.73
|
-0.58
-0.90% |
$64.20
|
436,973
48.47% of 50 DAV
50 DAV is 901,600
|
$68.80
-7.37%
|
1/6/2011
|
$36.12
|
PP = $37.34
|
|
MB = $39.21
|
Most Recent Note - 7/14/2011 3:41:22 PM
G - Quietly pulling back from its all-time high this week. It is extended from any sound base pattern and well above its 50 DMA line. It may produce more climactic gains, but disciplined investors avoid chasing extended stocks.
>>> The latest Featured Stock Update with an annotated graph appeared on 7/14/2011. Click here.
View all notes |
Alert me of new notes |
CANSLIM.net Company Profile |
SEC |
Zacks Reports |
StockTalk |
News |
Chart |
Request a new note
C
A N
S L
I M
|
ZAGG
-
NASDAQ
Zagg Inc
SPECIALTY RETAIL - Specialty Retail, Other
|
$15.76
|
+0.44
2.87% |
$15.96
|
2,706,502
115.52% of 50 DAV
50 DAV is 2,342,900
|
$15.85
-0.57%
|
6/1/2011
|
$10.92
|
PP = $10.59
|
|
MB = $11.12
|
Most Recent Note - 7/18/2011 1:14:11 PM
G - Touched a new all-time high today with its 5th consecutive gain, and no overhead supply remains to act as resistance. It could produce more climactic gains but it is extended from a sound base pattern, perched well above its 50 DMA line and recent lows defining chart support.
>>> The latest Featured Stock Update with an annotated graph appeared on 6/23/2011. Click here.
View all notes |
Alert me of new notes |
CANSLIM.net Company Profile |
SEC |
Zacks Reports |
StockTalk |
News |
Chart |
Request a new note
C
A N
S L
I M
|
|
|
|
THESE ARE NOT BUY RECOMMENDATIONS!
Comments contained in the body of this report are technical
opinions only. The material herein has been obtained
from sources believed to be reliable and accurate, however,
its accuracy and completeness cannot be guaranteed.
This site is not an investment advisor, hence it does
not endorse or recommend any securities or other investments.
Any recommendation contained in this report may not
be suitable for all investors and it is not to be deemed
an offer or solicitation on our part with respect to
the purchase or sale of any securities. All trademarks,
service marks and trade names appearing in this report
are the property of their respective owners, and are
likewise used for identification purposes only.
This report is a service available
only to active Paid Premium Members.
You may opt-out of receiving report notifications
at any time. Questions or comments may be submitted
by writing to Premium Membership Services 665 S.E. 10 Street, Suite 201 Deerfield Beach, FL 33441-5634 or by calling 1-800-965-8307
or 954-785-1121.
|
|
|

