You are not logged in.
This means you
CAN ONLY VIEW reports that were published prior to Monday, April 14, 2025.
You
MUST UPGRADE YOUR MEMBERSHIP if you want to see any current reports.
AFTER MARKET UPDATE - WEDNESDAY, JULY 17TH, 2013
Previous After Market Report Next After Market Report >>>
|
|
|
|
DOW |
+18.67 |
15,470.52 |
+0.12% |
|
Volume |
676,783,450 |
+10% |
|
Volume |
1,493,241,320 |
-2% |
|
NASDAQ |
+11.50 |
3,610.00 |
+0.32% |
|
Advancers |
1,963 |
63% |
|
Advancers |
1,470 |
57% |
|
S&P 500 |
+4.65 |
1,680.91 |
+0.28% |
|
Decliners |
1,027 |
33% |
|
Decliners |
1,020 |
39% |
|
Russell 2000 |
+3.78 |
1,042.53 |
+0.36% |
|
52 Wk Highs |
163 |
|
|
52 Wk Highs |
261 |
|
|
S&P 600 |
+1.57 |
585.72 |
+0.27% |
|
52 Wk Lows |
12 |
|
|
52 Wk Lows |
9 |
|
|
 |
Major Averages Posted Minor Gains on Fed's Accommodative Policy Stance
Kenneth J. Gruneisen - Passed the CAN SLIM® Master's Exam
The major averages managed to gain minor ground on Wednesday. Volume totals were mixed, higher than the prior session volume total on the NYSE and lower on the Nasdaq exchange. Breadth was positive as advancers led decliners by almost a 2-1 margin on the NYSE and by a 7-5 margin on the Nasdaq exchange. There were 66 high-ranked companies from the CANSLIM.net Leaders List made new 52-week highs and appeared on the CANSLIM.net BreakOuts Page, down slightly from the prior session total of 68 stocks. The list of stocks hitting new 52-week highs easily outnumbered new 52-week lows on both the NYSE and the Nasdaq exchange, and the new lows total on Nasdaq exchange fell into the single digits. There were gains for 8 of the 12 high-ranked companies currently included on the Featured Stocks Page.
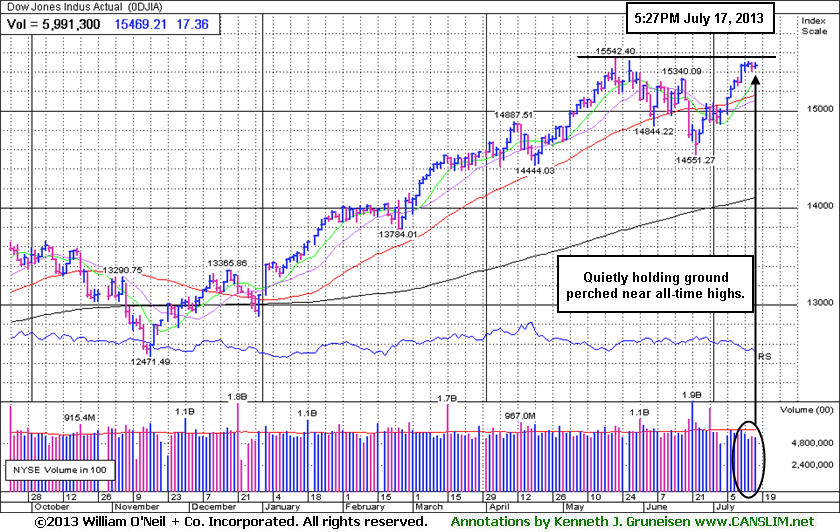
The major averages traded in a tight range as investors analyzed Fed Chairman Bernanke's testimony to Congress. His semiannual report revealed the central bank's timetable for tapering its stimulus measures is not on a preset course and the Fed's policy will remain accommodative as the economy recovers. The latest economic data was on the back burner. Housing starts unexpectedly declined by -9.9% in June to nearly a one-year low and building permits also failed to meet expectations as they fell by -7.5%.
Overall, nine of the 10 sectors on the S&P finished in positive territory. Materials paced the advance as DuPont (DD +5.28%) rallied. Financials also helped lift the market as Bank of America Corp's (BAC +2.80%) encouraging profit tally led the group higher. Utilities finished lower, dragged down by PG&E Corp's (PCG -2.65%) drop. CSX Corp (CSX +1.87%) rose following its earnings report. Technology stocks lagged behind even after Yahoo! Inc (YHOO +10.34%) advanced, as it was overshadowed by index heavyweight Microsoft's Corp (MSFT -1.46%) retreat. The sector will also garner attention with earnings results out after the close from Intel (INTC -0.41%) and International Business Machines Corp (IBM +0.36%).
In fixed-income, Treasury prices advanced. The 10-year note was up 12/32 to yield 2.49% and the 30-year bond gained 7/32 to yield 3.57%.
The market (M criteria) has flashed substantial strength and leadership on Thursday's session, making a favorable shift. Now in a confirmed rally, odds are considered favorable for investors' success with new buying efforts. Investors who have preserved their cash and confidence will be disciplined and selective while looking to be proactive and focused exclusively on the individual leaders best matching the winning models of the fact-based investment system. Study the companies on the CANSLIM.net Featured Stocks Page - a page showing the most action-worthy candidates' latest notes and links to additional resources including detailed analysis with data-packed graphs which are annotated by a Certified expert. The Premium Member Homepage - includes "dynamic archives" to all prior pay reports published. Watch for an announcement via email concerning the next WEBCAST.
PICTURED: The Dow Jones Industrial Average is quietly holding its ground perched at all-time highs. The index is up +18.05% year-to-date.
|
 Kenneth J. Gruneisen started out as a licensed stockbroker in August 1987, a couple of months prior to the historic stock market crash that took the Dow Jones Industrial Average down -22.6% in a single day. He has published daily fact-based fundamental and technical analysis on high-ranked stocks online for two decades. Through FACTBASEDINVESTING.COM, Kenneth provides educational articles, news, market commentary, and other information regarding proven investment systems that work in good times and bad.
Comments contained in the body of this report are technical opinions only and are not necessarily those of Gruneisen Growth Corp. The material herein has been obtained from sources believed to be reliable and accurate, however, its accuracy and completeness cannot be guaranteed. Our firm, employees, and customers may effect transactions, including transactions contrary to any recommendation herein, or have positions in the securities mentioned herein or options with respect thereto. Any recommendation contained in this report may not be suitable for all investors and it is not to be deemed an offer or solicitation on our part with respect to the purchase or sale of any securities. |
|
 |
Financial, Retail, Tech, and Energy-Linked Groups Rose
Kenneth J. Gruneisen - Passed the CAN SLIM® Master's Exam
The Bank Index ($BKX +0.64%) and Broker/Dealer Index ($XBD +0.24%) were both a positive influence on the major averages along with the Retail Index ($RLX +0.31%) The Networking Index ($NWX +1.28%) and Internet Index ($IIX +1.06%) led the tech sector higher while the Biotechnology Index ($BTK +0.26%) and the Semiconductor Index ($SOX +0.11%) each only eked out small gains. Energy-relates shared drifted higher as the Integrated Oil Index ($XOI +0.54%) and the Oil Services Index ($OSX +0.61%) posted modest gains. Meanwhile, the Gold & Silver Index ($XAU -2.65%) led defensive groups lower and the Healthcare Index ($HMO -0.42%) suffered a small loss.
Charts courtesy www.stockcharts.com
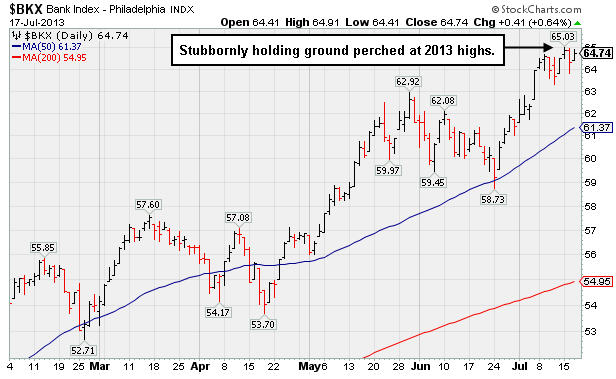
PICTURED: The Bank Index ($BKX +0.64%) has been stubbornly holding its ground perched at 2013 highs.
| Oil Services |
$OSX |
265.15 |
+1.62 |
+0.61% |
+20.44% |
| Healthcare |
$HMO |
3,296.17 |
-14.06 |
-0.42% |
+31.10% |
| Integrated Oil |
$XOI |
1,381.50 |
+7.40 |
+0.54% |
+11.25% |
| Semiconductor |
$SOX |
491.58 |
+0.52 |
+0.11% |
+28.00% |
| Networking |
$NWX |
278.15 |
+3.52 |
+1.28% |
+22.77% |
| Internet |
$IIX |
406.93 |
+4.25 |
+1.06% |
+24.44% |
| Broker/Dealer |
$XBD |
132.67 |
+0.31 |
+0.24% |
+40.64% |
| Retail |
$RLX |
840.89 |
+2.57 |
+0.31% |
+28.76% |
| Gold & Silver |
$XAU |
91.50 |
-2.49 |
-2.65% |
-44.75% |
| Bank |
$BKX |
64.74 |
+0.41 |
+0.64% |
+26.25% |
| Biotech |
$BTK |
2,164.97 |
+5.70 |
+0.26% |
+39.94% |
|
|
|
 |
Technical Breakout Backed By +65% Above Average
Kenneth J. Gruneisen - Passed the CAN SLIM® Master's Exam
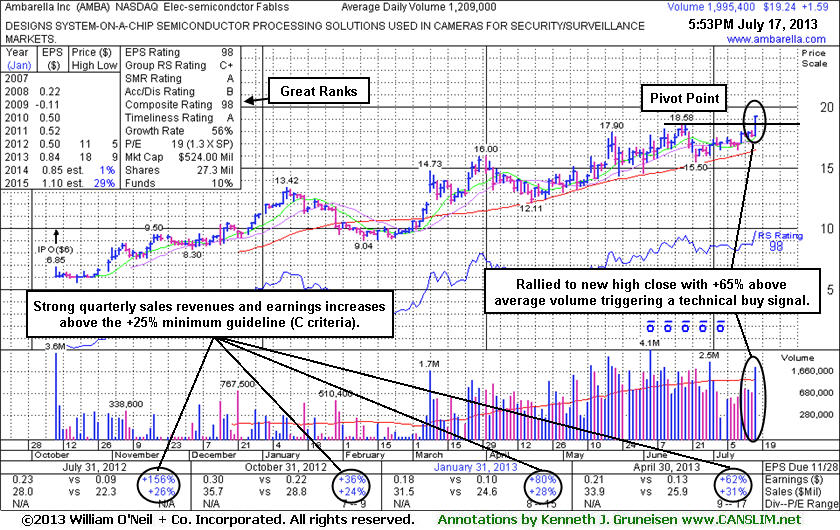
Ambarella Corporation (AMBA +$1.59 or +9.01% to $19.24) rallied above its pivot point with +65% above average volume breaking out from a short "square box" base pattern and triggering a new (or add-on) technial buy signal. It consolidated in a healthy fashion above its 50-day moving average (DMA) line while volume totals cooled in recent weeks. Its was last shown in this FSU section on 6/27/13 with an annotated graph under the headline, "Consolidating Above 50-Day Moving Average Line". Chart-readers recognize that short-term average as an important support level to watch where a violation would trigger a worrisome technical sell signal. It stayed above the 50 DMA line since blasting higher in March.
AMBA closed today's session +27.9% from the $15.04 it was when first shown in this FSU section under the headline, "Volume-Driven Gain From Cup-With-High-Handle to New 52-Week High - Tuesday, March 26, 2013 ". Keep in mind that 3 out of 4 stocks tend to move in the direction of the major averages (M criteria), yet during a confirmed rally many individual leaders generate much greater percentage gains than the major averages and index-linked ETFs. Contrasting this stock's +27.9% gain in under 5 months time, versus the S&P 500 Index's +17.8% year-to-date gain, we see a vivid example of the potential advantages investors may gain when carefully selecting individual stocks using the fact-based investment system.
It recently reported strong earnings and revenues increases for the April '13 quarter, continuing its streak of strong quarterly earnings comparisons versus the year ago periods - satisfying the C criteria with increases above the +25% minimum guideline. The high-ranked Electronics - Semiconductor firm saw the number of top-rated funds owning its shares rise from 51 in Dec '12 to 75 in Mar '13, a reassuring indication concerning the I criteria. Its current Up/Down Volume Ratio of 1.5 is also an unbiased indication that its shares have been under accumulation over the past 50 days. Its small supply (S criteria) of only 13.9 million shares in the public float can contribute to great price volatility in the event of institutional buying or selling.
|
|
|
Color Codes Explained :
Y - Better candidates highlighted by our
staff of experts.
G - Previously featured
in past reports as yellow but may no longer be buyable under the
guidelines.
***Last / Change / Volume data in this table is the closing quote data***
Symbol/Exchange
Company Name
Industry Group |
PRICE |
CHANGE
(%Change) |
Day High |
Volume
(% DAV)
(% 50 day avg vol) |
52 Wk Hi
% From Hi |
Featured
Date |
Price
Featured |
Pivot Featured |
|
Max Buy |
AMBA
-
NASDAQ
Ambarella Inc
ELECTRONICS - Semiconductor - Specialized
|
$19.24
|
+1.59
9.01% |
$19.30
|
1,995,481
165.05% of 50 DAV
50 DAV is 1,209,000
|
$18.58
3.55%
|
7/15/2013
|
$17.87
|
PP = $18.68
|
|
MB = $19.61
|
 Most Recent Note - 7/17/2013 6:38:34 PM
Y - Broke out from its latest base pattern with +65% above average volume triggering a new (or add-on) technical buy signal. See the latest FSU analysis for more details and a new annotated graph.
>>> The latest Featured Stock Update with an annotated graph appeared on 7/17/2013. Click here.
View all notes |
Alert me of new notes |
CANSLIM.net Company Profile |
SEC |
Zacks Reports |
StockTalk |
News |
Chart |
Request a new note
C
A N
S L
I M


|
CELG
-
NASDAQ
Celgene Corp
DRUGS - Drug Manufacturers - Major
|
$136.61
|
+1.56
1.15% |
$137.80
|
2,158,194
72.68% of 50 DAV
50 DAV is 2,969,400
|
$136.36
0.18%
|
7/11/2013
|
$133.25
|
PP = $131.92
|
|
MB = $138.52
|
Most Recent Note - 7/12/2013 6:21:32 PM
Y - Held its ground today. Breakaway gap and solid gain with twice average volume triggered a technical buy signal on the prior session as it finished above the new pivot point cited based on its 5/14/13 high plus 10 cents. See the latest FSU analysis for more details and an annotated graph.
>>> The latest Featured Stock Update with an annotated graph appeared on 7/11/2013. Click here.
View all notes |
Alert me of new notes |
CANSLIM.net Company Profile |
SEC |
Zacks Reports |
StockTalk |
News |
Chart |
Request a new note
C
A N
S L
I M
|
FLT
-
NYSE
Fleetcor Technologies
DIVERSIFIED SERVICES - Business/Management Services
|
$85.57
|
+0.63
0.74% |
$85.80
|
362,403
44.13% of 50 DAV
50 DAV is 821,200
|
$89.75
-4.66%
|
5/29/2013
|
$86.02
|
PP = $85.66
|
|
MB = $89.94
|
Most Recent Note - 7/15/2013 6:55:34 PM
G- Recently found support near its 50 DMA line. Prior low ($80.28 on 6/21/13) defines the next important near-term support where a violation would raise more serious concerns.
>>> The latest Featured Stock Update with an annotated graph appeared on 6/28/2013. Click here.
View all notes |
Alert me of new notes |
CANSLIM.net Company Profile |
SEC |
Zacks Reports |
StockTalk |
News |
Chart |
Request a new note
C
A N
S L
I M
|
LOPE
-
NASDAQ
Grand Canyon Education
DIVERSIFIED SERVICES - Education and; Training Services
|
$34.51
|
-0.75
-2.13% |
$35.64
|
485,103
108.04% of 50 DAV
50 DAV is 449,000
|
$36.45
-5.32%
|
6/19/2013
|
$31.47
|
PP = $34.17
|
|
MB = $35.88
|
Most Recent Note - 7/15/2013 6:56:54 PM
G - Inched further above its "max buy" level with today's 6th consecutive gain into new 52-week high territory. Volume-driven gains last week triggered a new technical buy signal. Prior highs in the $34 area define initial support above its 50 DMA line.
>>> The latest Featured Stock Update with an annotated graph appeared on 7/2/2013. Click here.
View all notes |
Alert me of new notes |
CANSLIM.net Company Profile |
SEC |
Zacks Reports |
StockTalk |
News |
Chart |
Request a new note
C
A N
S L
I M
|
PCLN
-
NASDAQ
Priceline.Com Inc
INTERNET - Internet Software and Services
|
$906.68
|
+4.63
0.51% |
$912.80
|
538,522
72.29% of 50 DAV
50 DAV is 744,900
|
$926.40
-2.13%
|
7/8/2013
|
$878.28
|
PP = $847.43
|
|
MB = $889.80
|
Most Recent Note - 7/12/2013 6:17:28 PM
G - Posted its 12th gain in the span of 13 sessions getting very extended from its prior base. Prior highs in the $847 area define initial support to watch on pullbacks.
>>> The latest Featured Stock Update with an annotated graph appeared on 7/9/2013. Click here.
View all notes |
Alert me of new notes |
CANSLIM.net Company Profile |
SEC |
Zacks Reports |
StockTalk |
News |
Chart |
Request a new note
C
A N
S L
I M
|
Symbol/Exchange
Company Name
Industry Group |
PRICE |
CHANGE
(%Change) |
Day High |
Volume
(% DAV)
(% 50 day avg vol) |
52 Wk Hi
% From Hi |
Featured
Date |
Price
Featured |
Pivot Featured |
|
Max Buy |
PRLB
-
NYSE
Proto Labs Inc
MANUFACTURING - Small Tools and Accessories
|
$64.43
|
+1.71
2.73% |
$64.50
|
273,780
60.83% of 50 DAV
50 DAV is 450,100
|
$67.40
-4.41%
|
6/17/2013
|
$59.37
|
PP = $59.94
|
|
MB = $62.94
|
Most Recent Note - 7/17/2013 6:39:58 PM
G - Small gap up gain today on light volume. Still holding its ground in a tight rage with volume totals cooling following a "negative reversal" on 6/28/13 with heavy volume. Prior highs near $59 coincide with its 50 DMA line defining important support.
>>> The latest Featured Stock Update with an annotated graph appeared on 7/15/2013. Click here.
View all notes |
Alert me of new notes |
CANSLIM.net Company Profile |
SEC |
Zacks Reports |
StockTalk |
News |
Chart |
Request a new note
C
A N
S L
I M
|
RRTS
-
NYSE
Roadrunner Trans Systems
TRANSPORTATION - Air Delivery and Freight Service
|
$29.42
|
-0.31
-1.04% |
$29.76
|
93,892
54.12% of 50 DAV
50 DAV is 173,500
|
$30.50
-3.54%
|
4/3/2013
|
$22.77
|
PP = $23.75
|
|
MB = $24.94
|
Most Recent Note - 7/15/2013 6:53:03 PM
G - Wedged higher without great volume conviction after finding support above its 50 DMA line, and it is perched at its 52-week high extended from any sound base.
>>> The latest Featured Stock Update with an annotated graph appeared on 7/3/2013. Click here.
View all notes |
Alert me of new notes |
CANSLIM.net Company Profile |
SEC |
Zacks Reports |
StockTalk |
News |
Chart |
Request a new note
C
A N
S L
I M
|
SFUN
-
NYSE
Soufun Hldgs Ltd Ads A
INTERNET - Internet Information Providers
|
$31.80
|
-1.13
-3.43% |
$32.93
|
1,221,796
395.66% of 50 DAV
50 DAV is 308,800
|
$33.03
-3.72%
|
7/16/2013
|
$29.54
|
PP = $27.90
|
|
MB = $29.30
|
Most Recent Note - 7/17/2013 1:13:21 PM
G - Pulling back today with a volume-driven loss. Prior highs in the $28-29 area define initial support to watch. Color code was changed to green after quickly getting extended from its latest base. Considerable gain backed by 5 times average volume triggered a technical buy signal and it finished strong after highlighted in yellow with pivot point cited based on its 5/28/13 high plus 10 cents with the annotated daily graph below included in the 7/16/13 mid-day report. See the latest FSU analysis for more details plus an annotated weekly graph.

>>> The latest Featured Stock Update with an annotated graph appeared on 7/16/2013. Click here.
View all notes |
Alert me of new notes |
CANSLIM.net Company Profile |
SEC |
Zacks Reports |
StockTalk |
News |
Chart |
Request a new note
C
A N
S L
I M
|
SSNC
-
NASDAQ
S S & C Technologies
COMPUTER SOFTWARE and SERVICES - Application Software
|
$36.86
|
+0.28
0.77% |
$37.01
|
351,007
74.44% of 50 DAV
50 DAV is 471,500
|
$38.47
-4.19%
|
7/11/2013
|
$35.80
|
PP = $34.54
|
|
MB = $36.27
|
Most Recent Note - 7/12/2013 6:11:49 PM
G - Rallied above its "max buy" level and its color code was changed to green. Cleared the pivot point based on its 5/08/13 high plus 10 cents cited in the 7/11/13 mid-day report (read here) and triggered a technical buy signal while rising from an orderly base with a considerable gain backed by +124% above average volume. See the latest FSU analysis for more details and a new annotated graph.
>>> The latest Featured Stock Update with an annotated graph appeared on 7/12/2013. Click here.
View all notes |
Alert me of new notes |
CANSLIM.net Company Profile |
SEC |
Zacks Reports |
StockTalk |
News |
Chart |
Request a new note
C
A N
S L
I M
|
SSYS
-
NASDAQ
Stratasys Ltd
COMPUTER HARDWARE - Computer Peripherals
|
$91.09
|
+1.67
1.87% |
$91.98
|
442,359
51.51% of 50 DAV
50 DAV is 858,700
|
$96.44
-5.55%
|
7/8/2013
|
$91.44
|
PP = $95.00
|
|
MB = $99.75
|
Most Recent Note - 7/16/2013 3:29:49 PM
Y - Encountering distributional pressure while perched at its 52-week high near previously stubborn resistance. Did not yet rally for a close above the pivot point based on its 5/14/13 high plus 10 cents with sufficient volume to clinch a proper technical buy signal.
>>> The latest Featured Stock Update with an annotated graph appeared on 7/8/2013. Click here.
View all notes |
Alert me of new notes |
CANSLIM.net Company Profile |
SEC |
Zacks Reports |
StockTalk |
News |
Chart |
Request a new note
C
A N
S L
I M
|
Symbol/Exchange
Company Name
Industry Group |
PRICE |
CHANGE
(%Change) |
Day High |
Volume
(% DAV)
(% 50 day avg vol) |
52 Wk Hi
% From Hi |
Featured
Date |
Price
Featured |
Pivot Featured |
|
Max Buy |
VRX
-
NYSE
Valeant Pharmaceuticals
DRUGS - Drug Manufacturers - Other
|
$91.45
|
-0.08
-0.09% |
$92.68
|
1,282,098
62.73% of 50 DAV
50 DAV is 2,043,900
|
$96.25
-4.99%
|
4/30/2013
|
$60.24
|
PP = $76.66
|
|
MB = $80.49
|
Most Recent Note - 7/12/2013 6:20:00 PM
G- Wedged to a new high close with today's 3rd consecutive gain lacking great volume conviction. Completed a new Public Offering on 6/18/13 following recent M&A news. Concerns were raised by its sub par Mar '13 earnings report.
>>> The latest Featured Stock Update with an annotated graph appeared on 7/5/2013. Click here.
View all notes |
Alert me of new notes |
CANSLIM.net Company Profile |
SEC |
Zacks Reports |
StockTalk |
News |
Chart |
Request a new note
C
A N
S L
I M
|
YNDX
-
NASDAQ
Yandex N V Class A
INTERNET - Internet Information Providers
|
$31.06
|
+1.50
5.07% |
$31.09
|
2,243,675
93.83% of 50 DAV
50 DAV is 2,391,100
|
$31.24
-0.58%
|
7/10/2013
|
$29.29
|
PP = $29.59
|
|
MB = $31.07
|
Most Recent Note - 7/17/2013 6:42:03 PM
Y - Posted a solid gain today for a new high close following a bout of distribution on the prior session. Found prompt support near prior highs in the $28-29 area defining initial support to watch on pullbacks.
>>> The latest Featured Stock Update with an annotated graph appeared on 7/10/2013. Click here.
View all notes |
Alert me of new notes |
CANSLIM.net Company Profile |
SEC |
Zacks Reports |
StockTalk |
News |
Chart |
Request a new note
C
A N
S L
I M
|
|
|
|
THESE ARE NOT BUY RECOMMENDATIONS!
Comments contained in the body of this report are technical
opinions only. The material herein has been obtained
from sources believed to be reliable and accurate, however,
its accuracy and completeness cannot be guaranteed.
This site is not an investment advisor, hence it does
not endorse or recommend any securities or other investments.
Any recommendation contained in this report may not
be suitable for all investors and it is not to be deemed
an offer or solicitation on our part with respect to
the purchase or sale of any securities. All trademarks,
service marks and trade names appearing in this report
are the property of their respective owners, and are
likewise used for identification purposes only.
This report is a service available
only to active Paid Premium Members.
You may opt-out of receiving report notifications
at any time. Questions or comments may be submitted
by writing to Premium Membership Services 665 S.E. 10 Street, Suite 201 Deerfield Beach, FL 33441-5634 or by calling 1-800-965-8307
or 954-785-1121.
|
|
|

