You are not logged in.
This means you
CAN ONLY VIEW reports that were published prior to Monday, March 10, 2025.
You
MUST UPGRADE YOUR MEMBERSHIP if you want to see any current reports.
AFTER MARKET UPDATE - FRIDAY, JULY 17TH, 2009
Previous After Market Report Next After Market Report >>>
|
|
|
|
DOW |
+32.12 |
8,743.94 |
+0.37% |
|
Volume |
1,290,231,520 |
+10% |
|
Volume |
1,934,425,990 |
-10% |
|
NASDAQ |
+1.58 |
1,886.61 |
+0.08% |
|
Advancers |
1,471 |
47% |
|
Advancers |
1,120 |
40% |
|
S&P 500 |
-0.36 |
940.38 |
-0.04% |
|
Decliners |
1,496 |
48% |
|
Decliners |
1,552 |
55% |
|
Russell 2000 |
-2.80 |
519.22 |
-0.54% |
|
52 Wk Highs |
48 |
|
|
52 Wk Highs |
60 |
|
|
S&P 600 |
-1.36 |
276.75 |
-0.49% |
|
52 Wk Lows |
3 |
|
|
52 Wk Lows |
12 |
|
|
 |
Indices Close With Solid Weekly Gains As Leadership Expands
Kenneth J. Gruneisen - Passed the CAN SLIM® Master's Exam
A slight loss on Friday for the S&P 500 Index ended its winning streak, yet the Dow Jones Industrial Average posted a fifth straight gain and the Nasdaq Composite made its eighth straight advance. The Dow gained 597 points on the week, matching its best weekly point gain of the year -which was for the week ended March 13th, as stocks rallied from their extreme lows. The reported volume total on the NYSE was slightly higher while the volume on the Nasdaq exchange quieted. Decliners led advancers narrowly on the NYSE, but the ratio was 3-to-2 to the negative side on the Nasdaq exchange. There were 30 high-ranked companies from the CANSLIM.net Leaders List that made a new 52-week high and appeared on the CANSLIM.net BreakOuts Page, up from the 28 issues that appeared on the prior session. In the past week there was a noticeable increase in the number of stocks hitting new highs coupled with solid weekly gains and meaningful technical improvement in the major averages. That helped the rally overcome its recent wave of distribution, and provided overall encouraging signs concerning the market's near-term outlook. As long as sufficient leadership exists (stocks making new highs) the rally will surely be sustained.
On Monday the Bank Index was a standout gainer underpinning the major averages' solid advance, and the Industry Group Watch section that evening (read here) illustrated the near term challenge it faces. The report identified several important technical hurdles including its 50-day moving average (DMA) line first, then a multi-month downward trendline, and then its 200 DMA line. By the week's end, it had cleared the first two hurdles and was encountering resistance at its long-term average. Among the catalysts for the big gain was a prominent analyst's upgrade of Goldman Sachs (GS -unchanged) ahead of its latest quarterly earnings announcement. On Wednesday, the strength in financial shares spearheaded the market's advance, prompting a look and the action in the Bank Index and Broker/Dealer Index that evening (read here). But financial stocks encountered pressure on Thursday after CIT Group Inc. (CIT +70.75%) said negotiations with federal regulators about a rescue of the small-business lender were dropped. Fear spread that the company could file for bankruptcy protection and it fell -75%, yet it rallied on Friday, repairing most of the prior session's damage as the lender sought rescue financing.
A slew of economic data during the past week included May business inventories down a sharper-than-expected -1.0% in what was the ninth straight decline. Retail sales for June increased +0.6%, which was more than expected, helped by higher gasoline and auto purchases. Meanwhile, the June Producer Price Index increased +1.8%, which was twice the expected increase and marked the sharpest jump since late 2007. Core PPI also increased. Also on Tuesday, House Democrats proposed a bill to expand health benefits in a plan that includes a public health plan option to compete against private insurers. The technical outlook is far from favorable for the healthcare group despite its inherent upside due to demographics (a huge wave of aging baby boomers), as government price and wage controls could limit the earnings potential of many healthcare firms
Semiconductor giant Intel (INTC +1.57%) helped the tech sector provide some market leadership with a big gap up on Wednesday. However, it should be noted that INTC did not rally because investors were impressed by big sales revenues and earnings increases; its rate of sales revenues and earnings deceleration declined. This brings to mind what many pundits have observed concerning the shape of the economy, that, "Things are not getting better yet, they are only getting worse at a slower rate." Tech sector giants IBM (IBM +4.32%) and Google (GOOG -2.79%) reported their latest quarterly results after Thursday's closing bell -both topping expectations. None of the aforementioned tech sector giants has produced earnings increases above the +25% minimum guideline of the investment system in any of the three latest quarterly comparisons versus the year ago period, making them bad candidates for disciplined practitioners of the proven investment approach.
Earnings news and the accompanying guidance is sure to contribute to market volatility during the next couple weeks of earnings season. Investors should have a bias toward buying only the most ideal buy candidates within the guidelines letter-by-letter, rather than forcing new buys in companies with numerous flaws and shortcomings with respect to all important criteria.
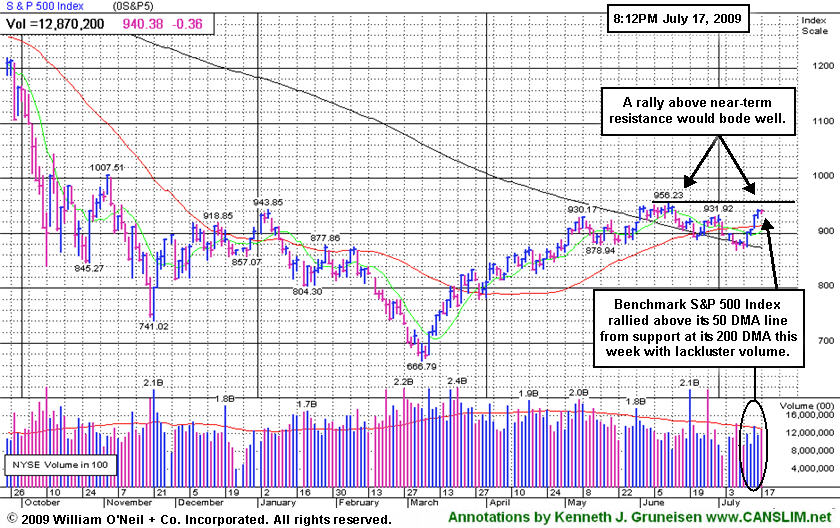
PICTURED: The benchmark S&P 500 Index climbed +7% this week rallied above its 50-day moving average (DMA) line with lackluster volume, rising from support at its 200 DMA line (which is still downward sloping). A rally above resistance at its recent chart high (956) would bode especially well, technically, and could help stocks gain even more upward momentum.
Attention: Institutional Investors
To inquire about money management services specifically designed for your needs, please email ASarhan@sourcegrp.com.
|
 Kenneth J. Gruneisen started out as a licensed stockbroker in August 1987, a couple of months prior to the historic stock market crash that took the Dow Jones Industrial Average down -22.6% in a single day. He has published daily fact-based fundamental and technical analysis on high-ranked stocks online for two decades. Through FACTBASEDINVESTING.COM, Kenneth provides educational articles, news, market commentary, and other information regarding proven investment systems that work in good times and bad.
Comments contained in the body of this report are technical opinions only and are not necessarily those of Gruneisen Growth Corp. The material herein has been obtained from sources believed to be reliable and accurate, however, its accuracy and completeness cannot be guaranteed. Our firm, employees, and customers may effect transactions, including transactions contrary to any recommendation herein, or have positions in the securities mentioned herein or options with respect thereto. Any recommendation contained in this report may not be suitable for all investors and it is not to be deemed an offer or solicitation on our part with respect to the purchase or sale of any securities. |
|
 |
Semiconductor Index Hits 2009 High With 7th Consecutive Gain
Kenneth J. Gruneisen - Passed the CAN SLIM® Master's Exam
The financial group lagged on Friday as the Bank Index ($BKX -2.16%) and Broker/Dealer Index ($XBD -0.70%) were among the session's worst decliners. The Semiconductor Index ($SOX +1.22%) led the tech sector and the Networking Index ($NWX +0.39%) posted a small gain, yet the Internet Index ($IIX -0.01%) ended flat and the Biotechnology Index ($BTK -0.53%) finished with a small loss. The Gold & Silver Index ($XAU +1.50%) and Oil Services Index ($OSX +0.78%) traded up while the Integrated Oil Index ($XOI +0.01%) ended flat. Modest gains from the Retail Index ($RLX +0.53%) and Healthcare Index ($HMO +0.56%) rounded out the mostly positive session.
Charts courtesy www.stockcharts.com
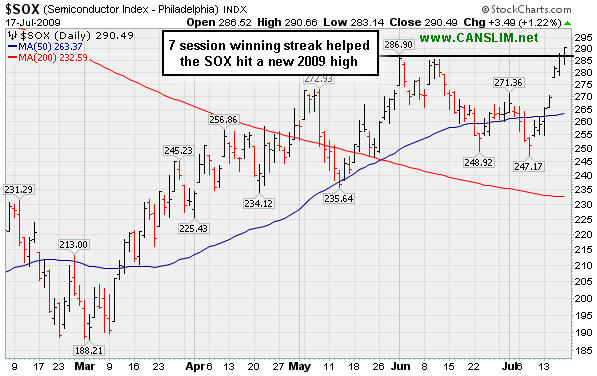
PICTURED: The Semiconductor Index ($SOX +1.22%) has a 7 session winning streak going, which helped it hit a new 2009 high on Friday.
| Oil Services |
$OSX |
164.63 |
+1.27 |
+0.78% |
+35.62% |
| Healthcare |
$HMO |
1,080.87 |
+6.05 |
+0.56% |
+12.57% |
| Integrated Oil |
$XOI |
918.68 |
+0.11 |
+0.01% |
-6.23% |
| Semiconductor |
$SOX |
290.49 |
+3.49 |
+1.22% |
+36.91% |
| Networking |
$NWX |
190.43 |
+0.74 |
+0.39% |
+32.34% |
| Internet |
$IIX |
194.17 |
-0.02 |
-0.01% |
+45.15% |
| Broker/Dealer |
$XBD |
98.46 |
-0.69 |
-0.70% |
+27.09% |
| Retail |
$RLX |
335.54 |
+1.77 |
+0.53% |
+20.15% |
| Gold & Silver |
$XAU |
144.36 |
+2.13 |
+1.50% |
+16.56% |
| Bank |
$BKX |
37.08 |
-0.82 |
-2.16% |
-16.34% |
| Biotech |
$BTK |
681.15 |
-3.64 |
-0.53% |
+5.25% |
|
|
|
 |
Small Revenues and Small Supply Of Shares - Reasons For Extra Caution
Kenneth J. Gruneisen - Passed the CAN SLIM® Master's Exam
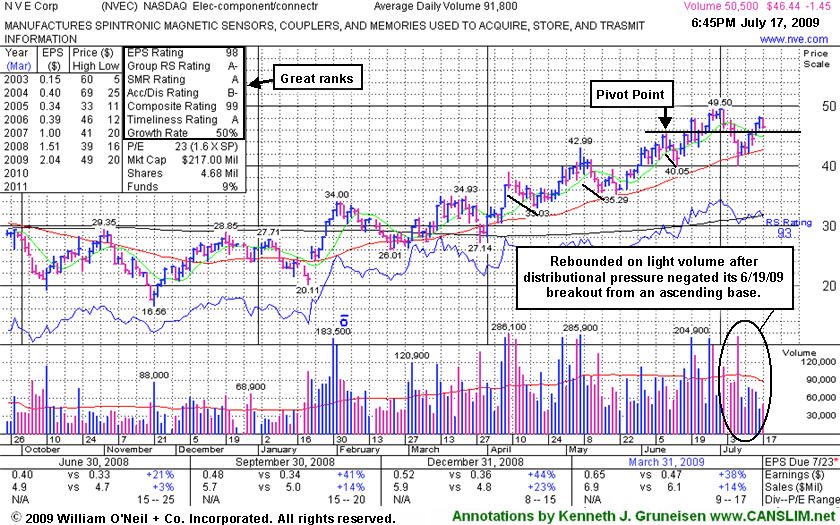
NVE Corp (NVEC -$1.45 or -3.03% to $46.44) is perched near its 52-week high after light volume gains this week helped it rally from support near its 50-day moving average (DMA) line - important support to watch, where a violation would raise concerns and trigger a technical sell signal. Its color code was changed to yellow based its resilience near its 50 DMA after its 6/19/09 breakout from an "ascending base" type pattern with volume more than 2 times average was negated. However, it needs more time to consolidate and form a sound base, especially since it briefly sank below its latest pivot point by more than -7% after its breakout.
It has a very small supply of only 4.67 million shares outstanding. This is another good reason to be especially disciplined about proper entries and exits. A small supply is generally considered a good sign with respect to the S criteria, yet could contribute to great volatility in the event of institutional accumulation or distribution. NVEC has traded up as much as +46.23% since it was first featured in yellow at $33.85 in the Friday, March 13, 2009 Mid-Day Breakouts Report (read here).
Earnings per share rose +38% in the period ended March 31, 2009 versus the year ago quarter, yet sales were up just +14% and, as previously noted, the company's sales revenues thus far have been rather minuscule. At less than $7 million per quarter in each of the past 8 quarters, sales have growing at a mostly lackluster pace percentage-wise. Companies reporting more substantial sales revenues generally make more reliable buy candidates, while companies with little "meat on the bone" can be particularly vulnerable to bad stumbles, fundamentally and technically. Nonetheless, this high-ranked Electronics - Components leader has a good quarterly and annual earnings growth history (C & A criteria).
|
|
|
Color Codes Explained :
Y - Better candidates highlighted by our
staff of experts.
G - Previously featured
in past reports as yellow but may no longer be buyable under the
guidelines.
***Last / Change / Volume quote data in this table corresponds with the timestamp on the note***
Symbol/Exchange
Company Name
Industry Group |
Last |
Chg. |
Vol
% DAV |
Date Featured |
Price Featured |
Latest Pivot Point
Featured |
Status |
| Latest Max Buy Price |
CPLA
- NASDAQ
Capella Education Co
DIVERSIFIED SERVICES - Education and Training Services
|
$60.91
|
+0.20
|
151,753
71% DAV
213,062
|
7/9/2009
(Date
Featured) |
$59.69
(Price
Featured) |
PP = $62.06 |
Y |
| MB = $65.16 |
Most Recent Note - 7/17/2009 5:37:47 PM
Y - Today was its 3rd consecutive gain with light volume, and its highest close since February, ending less than -4% off its 52-week high. A positive reversal on 7/13/09 was a sign of impressive institutional support after initially gapping down following an analyst downgrade. It had negatively reversed for a loss on the prior 2 sessions after it was featured in yellow in the 7/09/09 Mid-Day BreakOuts Report (read here). Color code is changed to yellow based on its resilience. The group has shown some leadership, yet currently has a D- for a Relative Strength Rating. CPLA is a high-ranked leader in the Commercial Services-Schools Group. Its small supply of only 13.9 million shares in the float could contribute to greater price volatility in the event of institutional accumulation or distribution. The number of top-rated funds owning an interest rose from 91 in Sept '08, to 129 as of March '09, which is reassuring with respect to the I criteria. It has a very good earnings history that satisfies the C & A criteria, while recent quarters showed steady sales revenues increases in the +17-18% range.
>>> The latest Featured Stock Update with an annotated graph appeared on 7/9/2009. click here.
|
|
C
A
S
I |
News |
Chart |
SEC
View all notes Alert
me of new notes
Company
Profile
|
GMCR
- NASDAQ
Green Mtn Coffee Roastrs
FOOD & BEVERAGE - Processed & Packaged Goods
|
$60.15
|
-0.52
|
603,980
47% DAV
1,287,401
|
7/17/2009
(Date
Featured) |
$60.15
(Price
Featured) |
PP = $63.79 |
Y |
| MB = $66.98 |
Most Recent Note - 7/17/2009 5:41:44 PM
Y - Found support this week near its 50 DMA line. That short-term average is a very important support level to watch above its recent chart low ($51.65), where violations would raise concerns and trigger technical sell signals. Color code is changed to yellow with new pivot point cited. On 6/09/09 it reached a new all-time high with a gain on light volume as a 3:2 stock split took effect. GMCR traded up more than +144% since appearing with an annotated graph under the headline "It May Soon Be Time To Go Green" when featured in the January 2009 CANSLIM.net News (read here).
>>> The latest Featured Stock Update with an annotated graph appeared on 7/16/2009. click here.
|
|
C
A
S
I |
News |
Chart |
SEC
View all notes Alert
me of new notes
Company
Profile
|
HMSY
- NASDAQ
H M S Holdings Corp
COMPUTER SOFTWARE & SERVICES - Healthcare Information Service
|
$42.26
|
+0.90
|
304,200
N/A
|
2/20/2009
(Date
Featured) |
$34.08
(Price
Featured) |
PP = $38.38 |
G |
| MB = $40.30 |
Most Recent Note - 7/17/2009 5:44:04 PM
G - Gain on light volume today for a new all-time high, getting extended from its last sound base. No overhead supply is left to hinder the progress for this Commercial Services - Healthcare firm. Recently tested prior highs in the $38 area which are a very important initial support level above its 50 DMA line. A gap up gain on 6/16/09 with heavy volume triggered a technical buy signal.
>>> The latest Featured Stock Update with an annotated graph appeared on 7/13/2009. click here.
|
|
C
A
S
I |
News |
Chart |
SEC
View all notes Alert
me of new notes
Company
Profile
|
NTES
- NASDAQ
Netease Inc Adr
INTERNET - Internet Information Providers
|
$39.17
|
+0.78
|
3,474,243
N/A
|
7/17/2009
(Date
Featured) |
$39.29
(Price
Featured) |
PP = $38.74 |
Y |
| MB = $40.68 |
Most Recent Note - 7/17/2009 5:47:04 PM
Y - Today it gapped up for a 4th consecutive session and 7th consecutive gain, hitting a new 52-week high, rising from a 5-week flat base with +44% above average volume behind its gain. Remember that volume should be at least +50% above average to confirm a sound breakout. Color code was changed to yellow and a new pivot point was noted. Its chart resembles a breakout from a "double bottom" pattern with a proper second low on 7/08/09 undercutting its 6/23/09 low. However that consolidation from its 6/10/09 high has been only 5 weeks in duration, whereas a proper double bottom is required to be a minimum of 8 weeks in length to be considered buyable within the investment system's guidelines. It found support and promptly repaired its 7/08/09 violation of its 50 DMA line which had triggered a technical sell signal. First featured at $26.75 in the 3/31/09 CANSLIM.net Mid-Day Breakouts Report (read here). This high-ranked Chinese Internet - Content firm was also summarized in greater detail including an annotated graph in the April 2009 issue of CANSLIM.net News (read here). 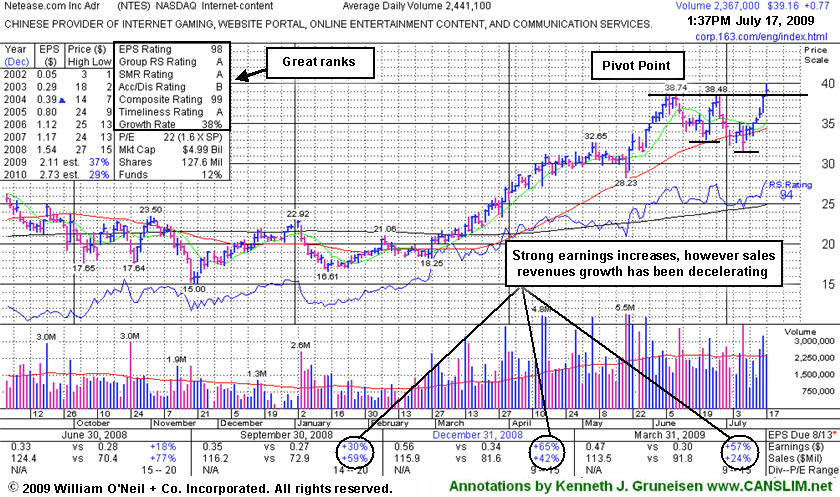
>>> The latest Featured Stock Update with an annotated graph appeared on 7/14/2009. click here.
|
|
C
A
S
I |
News |
Chart |
SEC
View all notes Alert
me of new notes
Company
Profile
|
NVEC
- NASDAQ
N V E Corp
ELECTRONICS - Semiconductor - Specialized
|
$46.44
|
-1.45
|
59,659
N/A
|
3/13/2009
(Date
Featured) |
$33.85
(Price
Featured) |
PP = $45.50 |
Y |
| MB = $47.78 |
Most Recent Note - 7/17/2009 5:53:10 PM
Y - Perched near its 52-week high after light volume gains this week helped it rally from support near its 50 DMA line - important support to watch, where a violation would raise concerns and trigger a technical sell signal. Color code is changed to yellow based its resilience near its 50 DMA after its 6/19/09 breakout from an "ascending base" type pattern was negated. Sales increases in recent comparisons have been under the +25% guideline and still rather minuscule, leaving concerns, especially in the event of any hiccups. This is a reason to be especially disciplined about proper entries and exits.
>>> The latest Featured Stock Update with an annotated graph appeared on 7/17/2009. click here.
|
|
C
A
S
I |
News |
Chart |
SEC
View all notes Alert
me of new notes
Company
Profile
|
SNDA
-
|
$55.95
|
-0.35
|
1,073,848
N/A
|
5/31/2009
(Date
Featured) |
$57.62
(Price
Featured) |
PP = $53.95 |
G |
| MB = $56.65 |
Most Recent Note - 7/17/2009 5:54:52 PM
G - Negatively reversed today yet stayed above its 50 DMA line. Subsequent deterioration below its recent chart low near $50 could raise more serious concerns and trigger a worrisome technical sell signal. Detailed analysis was included when recently featured in the June 2009 issue of CANSLIM.net News. Be sure to review the "What to Look Out For" section and entire detailed summary - read here).
>>> The latest Featured Stock Update with an annotated graph appeared on 7/15/2009. click here.
|
|
C
A
S
I |
News |
Chart |
SEC
View all notes Alert
me of new notes
Company
Profile
|
SYNA
- NASDAQ
Synaptics Inc
COMPUTER SOFTWARE & SERVICES - Information Technology Service
|
$33.84
|
+1.02
|
1,931,477
N/A
|
5/18/2009
(Date
Featured) |
$32.58
(Price
Featured) |
PP = $34.52 |
G |
| MB = $36.25 |
Most Recent Note - 7/17/2009 6:00:45 PM
G - Held its ground since its considerable loss on 7/14/09 with heavy volume indicated heavy distributional pressure, raising more concerns. A 50 DMA line violation on 7/08/09 triggered a technical sell signal. For its outlook to improve it would need to rally back above its 50 DMA line. First featured in yellow in the May 18, 2009 mid-day report (read here). The number of top-rated funds owning its shares rose from 123 in June '08 to 201 in March '09, which is good news concerning the I criteria. Its annual earnings (the A criteria) history showed a dowturn in 2006, leaving concerns, but it followed that up with strong growth the next 2 years. Its small supply of shares (the S criteria) outstanding could contribute to especially great volatility in the event of institutional accumulation or distribution.
>>> The latest Featured Stock Update with an annotated graph appeared on 7/10/2009. click here.
|
|
C
A
S
I |
News |
Chart |
SEC
View all notes Alert
me of new notes
Company
Profile
|
TNDM
- NASDAQ
Tandem Diabetes Care Inc
TELECOMMUNICATIONS - Wireless Communications
|
$28.98
|
+0.10
|
248,018
N/A
|
3/2/2009
(Date
Featured) |
$18.89
(Price
Featured) |
PP = $29.85 |
G |
| MB = $31.34 |
Most Recent Note - 7/17/2009 6:01:55 PM
G - It quietly rebounded above its 50 DMA line this week. Subsequent deterioration below that short-term average and recent lows would raise concerns and trigger sell signals. Its choppy chart offers no sound base per the investment system's guidelines. It traded up as much as +72.42% since first featured at $18.89 in the 3/02/09 Mid-Day BreakOuts Report (read here).
>>> The latest Featured Stock Update with an annotated graph appeared on 7/7/2009. click here.
|
|
C
A
S
I |
News |
Chart |
SEC
View all notes Alert
me of new notes
Company
Profile
|
|
|
|
THESE ARE NOT BUY RECOMMENDATIONS!
Comments contained in the body of this report are technical
opinions only. The material herein has been obtained
from sources believed to be reliable and accurate, however,
its accuracy and completeness cannot be guaranteed.
This site is not an investment advisor, hence it does
not endorse or recommend any securities or other investments.
Any recommendation contained in this report may not
be suitable for all investors and it is not to be deemed
an offer or solicitation on our part with respect to
the purchase or sale of any securities. All trademarks,
service marks and trade names appearing in this report
are the property of their respective owners, and are
likewise used for identification purposes only.
This report is a service available
only to active Paid Premium Members.
You may opt-out of receiving report notifications
at any time. Questions or comments may be submitted
by writing to Premium Membership Services 665 S.E. 10 Street, Suite 201 Deerfield Beach, FL 33441-5634 or by calling 1-800-965-8307
or 954-785-1121.
|
|
|

