You are not logged in.
This means you
CAN ONLY VIEW reports that were published prior to Monday, April 14, 2025.
You
MUST UPGRADE YOUR MEMBERSHIP if you want to see any current reports.
AFTER MARKET UPDATE - THURSDAY, JULY 16TH, 2009
Previous After Market Report Next After Market Report >>>
|
|
|
|
DOW |
+95.61 |
8,711.82 |
+1.11% |
|
Volume |
1,175,726,100 |
-14% |
|
Volume |
2,151,978,580 |
-17% |
|
NASDAQ |
+22.13 |
1,885.03 |
+1.19% |
|
Advancers |
2,118 |
68% |
|
Advancers |
1,684 |
60% |
|
S&P 500 |
+8.06 |
940.74 |
+0.86% |
|
Decliners |
875 |
28% |
|
Decliners |
973 |
35% |
|
Russell 2000 |
+6.38 |
522.02 |
+1.24% |
|
52 Wk Highs |
48 |
|
|
52 Wk Highs |
51 |
|
|
S&P 600 |
+3.26 |
278.11 |
+1.19% |
|
52 Wk Lows |
7 |
|
|
52 Wk Lows |
7 |
|
|
 |
Afternoon Gains Help Indices Extend Winning Streak
Kenneth J. Gruneisen - Passed the CAN SLIM® Master's Exam
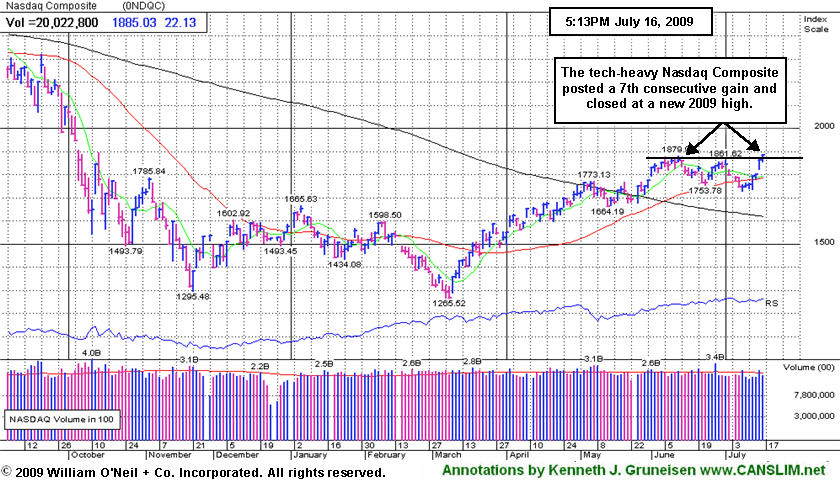
The tech-heavy Nasdaq Composite posted a 7th consecutive gain and closed at a new 2009 high. The S&P 500 Index and the Dow Jones Industrial Average also posted their fourth straight gains, however lighter volume totals on the NYSE and Nasdaq revealed a lack of great institutional conviction behind Thursday's gains. Advancers led decliners by about a 2-to-1 ratio overall, yet the bias was more positive on the NYSE than on the Nasdaq. There were 28 high-ranked companies from the CANSLIM.net Leaders List that made a new 52-week high and appeared on the CANSLIM.net BreakOuts Page, up nicely from the 20 issues that appeared on the prior session.
The market seemed uninspired for most of the session, despite the most encouraging jobless claims data in months as initial claims for the week ended July 11 came in at 522,000, which is the lowest since January. Continuing claims were down sharply from record highs of 6.9 million to less than 6.3 million, the lowest total since April. After trading flat for most of the session stocks got a boost in the late-afternoon, with tech sector gains helping offset weakness in the financial group.
Financial stocks encountered pressure after CIT Group Inc. (CIT -75%) said negotiations with federal regulators about a rescue of the small-business lender were dropped. Fear spread that the company could file for bankruptcy protection. Meanwhile, the dollar fell against other currencies, gold prices also fell, and crude oil rose 53 cents to $62.07 per barrel on the New York Mercantile Exchange.
Tech sector giants leaders IBM (IBM +3.19%) and Google (GOOG +1.01%) reported their latest quarterly results after Thursday's closing bell -both topping expectations. Earnings news and the accompanying guidance is sure to contribute to market volatility during the next couple weeks of earnings season. On Wednesday, semiconductor giant Intel (INTC +2.49%) helped the tech sector provide some market leadership. However, it should be noted that INTC did not rally because investors were impressed by big sales revenues and earnings increases; its rate of sales revenues and earnings deceleration declined. This brings to mind what many pundits have observed concerning the shape of the economy, that, "Things are not getting better yet, they are only getting worse at a slower rate."
PICTURED: The Nasdaq Composite Index's 7-session winning streak is a feat that hadn't been made in more than one year. It closed the session near its high after climbing to a new 2009 high with a gain on lighter volume.
|
 Kenneth J. Gruneisen started out as a licensed stockbroker in August 1987, a couple of months prior to the historic stock market crash that took the Dow Jones Industrial Average down -22.6% in a single day. He has published daily fact-based fundamental and technical analysis on high-ranked stocks online for two decades. Through FACTBASEDINVESTING.COM, Kenneth provides educational articles, news, market commentary, and other information regarding proven investment systems that work in good times and bad.
Comments contained in the body of this report are technical opinions only and are not necessarily those of Gruneisen Growth Corp. The material herein has been obtained from sources believed to be reliable and accurate, however, its accuracy and completeness cannot be guaranteed. Our firm, employees, and customers may effect transactions, including transactions contrary to any recommendation herein, or have positions in the securities mentioned herein or options with respect thereto. Any recommendation contained in this report may not be suitable for all investors and it is not to be deemed an offer or solicitation on our part with respect to the purchase or sale of any securities. |
|
 |
Biotech and Other Tech Groups Gain Ground
Kenneth J. Gruneisen - Passed the CAN SLIM® Master's Exam
The Networking Index ($NWX +1.62%), Semiconductor Index ($SOX +1.93%), and Internet Index ($IIX +1.22%) indexes rose as the tech sector continued to trade with a positive bias. Meanwhile, financial shares edged lower as the Broker/Dealer Index ($XBD -0.52%) and Bank Index ($BKX -0.16%) closed with small losses. However, there were gains from the Retail Index ($RLX +0.87%), Healthcare Index ($HMO +0.67%), and commodity-linked areas helping give the market a lift. The Gold & Silver Index ($XAU +0.79%), Integrated Oil Index ($XOI +0.85%), and Oil Services Index ($OSX +1.42%) posted gains.
Charts courtesy www.stockcharts.com
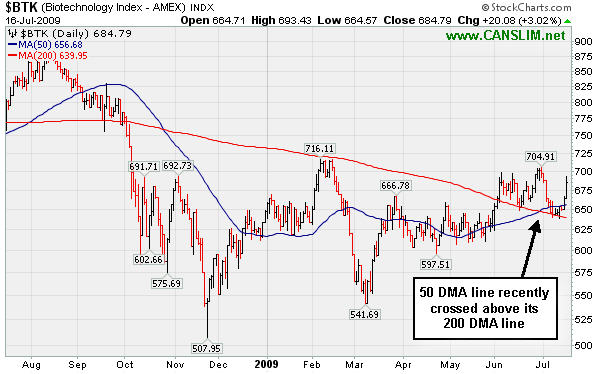
PICTURED: The Biotechnology Index ($BTK +3.02%) was a standout gainer on Thursday. A study published in the New England Journal of Medicine Thursday showed that Human Genome Sciences Inc. (HGSI +21.82%) anthrax treatment candidate ABthrax was effective in studies on animals, however the company's quarter ended March 31, 2009 was only its first profitable quarter after years of ongoing losses. Historic studies show that the market's biggest winners typically had produced several strong quarters and a few good years of solid earnings prior to the stocks making their big advances.
| Oil Services |
$OSX |
163.36 |
+2.29 |
+1.42% |
+34.57% |
| Healthcare |
$HMO |
1,074.82 |
+7.12 |
+0.67% |
+11.94% |
| Integrated Oil |
$XOI |
918.57 |
+7.72 |
+0.85% |
-6.24% |
| Semiconductor |
$SOX |
287.00 |
+5.44 |
+1.93% |
+35.27% |
| Networking |
$NWX |
189.70 |
+3.02 |
+1.62% |
+31.84% |
| Internet |
$IIX |
194.19 |
+2.35 |
+1.22% |
+45.17% |
| Broker/Dealer |
$XBD |
99.15 |
-0.52 |
-0.52% |
+27.99% |
| Retail |
$RLX |
333.77 |
+2.87 |
+0.87% |
+19.52% |
| Gold & Silver |
$XAU |
142.23 |
+1.11 |
+0.79% |
+14.84% |
| Bank |
$BKX |
37.90 |
-0.06 |
-0.16% |
-14.49% |
| Biotech |
$BTK |
684.79 |
+20.08 |
+3.02% |
+5.81% |
|
|
|
 |
Found Support at 50 Day Moving Average Recently
Kenneth J. Gruneisen - Passed the CAN SLIM® Master's Exam
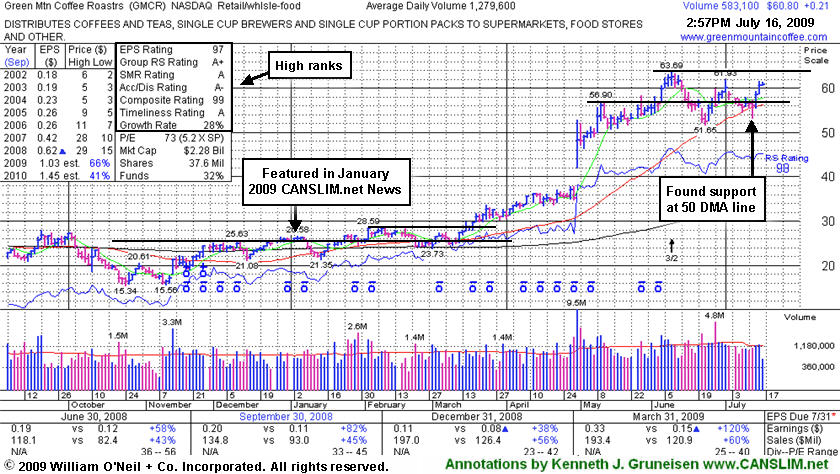
Green Mountain Coffee Roasters (GMCR +$0.08 to $60.67) recently found support when consolidating above its 50-day moving average (DMA) line. A violation of it and the recent chart low ($51.65) would raise concerns and trigger technical sell signals. Losses negated its latest breakout from a "high-tight flag" type pattern. It barely claimed its all-time high with a small gain on light volume as its 3:2 stock split took effect on 6/09/09, then subsequently slumped back into its prior base before finding support at its short-term average and rebounding. Do not be confused by the effect of the split on share prices, GMCR traded up an astonishing +144% since appearing with an annotated graph under the headline "It May Soon Be Time To Go Green" when featured in the January 2009 CANSLIM.net News (read here).
Taking a closer look at the annotated chart below that shows its action since January, a breakout on February 3rd helped it reach $28.59, but then it struggled and slumped into its prior base. At best, it built a sort of base-on-base type pattern, and it was not until mid-March that it made progress above $29 and $30, with the confirmation of a follow-through-day of big gains on higher volume from the major averages as an important reasurrance concerning the M criteria (market direction). Its big gap up on April 30th followed a short consolidation. The stock's latest appearance in this Featured Stock Update section came under the headline "Consolidating Above 50 DMA; Late-Stage Breakout Failed" (read here). Some have called it just a "second stage" base and questioned the characterization of GMCR as "late stage", however it is worth noting that the stock is currently trading more than +70% above its 200 DMA line. In the Certification program, they teach that when a stock is trading 70-100% or more above its 200 DMA line investors should probably not be looking for buy signals or reasons to hold, they shoud be watching out for sell signals which might prompt them to lock in profits!
Strong leaders tend to keep on leading, so this is not to say that another sound base might not form in due time. Investors must be especially disciplined about their entries after a stock has rallied from the low $20 range to $60 in about 4 months, and always disciplined about limiting losses if a stock ever falls more than -7% from their buy price.
 |
|
|
Color Codes Explained :
Y - Better candidates highlighted by our
staff of experts.
G - Previously featured
in past reports as yellow but may no longer be buyable under the
guidelines.
***Last / Change / Volume quote data in this table corresponds with the timestamp on the note***
Symbol/Exchange
Company Name
Industry Group |
Last |
Chg. |
Vol
% DAV |
Date Featured |
Price Featured |
Latest Pivot Point
Featured |
Status |
| Latest Max Buy Price |
CPLA
- NASDAQ
Capella Education Co
DIVERSIFIED SERVICES - Education and Training Services
|
$60.71
|
+1.42
|
143,903
N/A
|
7/9/2009
(Date
Featured) |
$59.69
(Price
Featured) |
PP = $62.06 |
G |
| MB = $65.16 |
Most Recent Note - 7/16/2009 4:16:32 PM
G - Gain today on light volume helped it rise to its highest close since February, ending less than -4% off its 52-week high. A positive reversal on 7/13/09 was a sign of impressive institutional support after initially gapping down following an analyst downgrade. It had negatively reversed for a loss on the prior 2 sessions after it was featured in yellow in the 7/09/09 Mid-Day BreakOuts Report (read here). Color code is changed to yellow based on its resilience. The group has shown some leadership, yet currently has a D- for a Relative Strength Rating. CPLA is a high-ranked leader in the Commercial Services-Schools Group. Its small supply of only 13.9 million shares in the float could contribute to greater price volatility in the event of institutional accumulation or distribution. The number of top-rated funds owning an interest rose from 91 in Sept '08, to 129 as of March '09, which is reassuring with respect to the I criteria. It has a very good earnings history that satisfies the C & A criteria, while recent quarters showed steady sales revenues increases in the +17-18% range.
>>> The latest Featured Stock Update with an annotated graph appeared on 7/9/2009. click here.
|
|
C
A
S
I |
News |
Chart |
SEC
View all notes Alert
me of new notes
Company
Profile
|
GMCR
- NASDAQ
Green Mtn Coffee Roastrs
FOOD & BEVERAGE - Processed & Packaged Goods
|
$60.67
|
+0.08
|
834,909
N/A
|
1/1/2008
(Date
Featured) |
$27.13
(Price
Featured) |
PP = $28.66 |
G |
| MB = $30.09 |
Most Recent Note - 7/16/2009 4:18:35 PM
G - Found support this week near its 50 DMA line. Its short-term average is a very important support level to watch above its recent chart low ($51.65), where violations would raise concerns and trigger technical sell signals. On 6/09/09 it reached a new all-time high with a gain on light volume as a 3:2 stock split took effect. GMCR traded up more than +144% since appearing with an annotated graph under the headline "It May Soon Be Time To Go Green" when featured in the January 2009 CANSLIM.net News (read here).
>>> The latest Featured Stock Update with an annotated graph appeared on 7/16/2009. click here.
|
|
C
A
S
I |
News |
Chart |
SEC
View all notes Alert
me of new notes
Company
Profile
|
HMSY
- NASDAQ
H M S Holdings Corp
COMPUTER SOFTWARE & SERVICES - Healthcare Information Service
|
$41.36
|
-0.02
|
147,393
N/A
|
2/20/2009
(Date
Featured) |
$34.08
(Price
Featured) |
PP = $38.38 |
G |
| MB = $40.30 |
Most Recent Note - 7/16/2009 4:25:22 PM
G - No overhead supply is left to hinder the progress for this Commercial Services - Healthcare firm which is quietly perched near all-time highs. Recently tested prior highs in the $38 area which are a very important initial support level above its 50 DMA line. A gap up gain on 6/16/09 with heavy volume triggered a technical buy signal.
>>> The latest Featured Stock Update with an annotated graph appeared on 7/13/2009. click here.
|
|
C
A
S
I |
News |
Chart |
SEC
View all notes Alert
me of new notes
Company
Profile
|
NTES
- NASDAQ
Netease Inc Adr
INTERNET - Internet Information Providers
|
$38.04
|
+1.88
|
2,525,533
N/A
|
5/21/2009
(Date
Featured) |
$31.19
(Price
Featured) |
PP = $32.75 |
G |
| MB = $34.39 |
Most Recent Note - 7/16/2009 4:06:37 PM
G - Today it gapped up for a third consecutive session and rose for a 6th consecutive session, and closed just pennies under its best ever close. It found support and promptly repaired its 7/08/09 violation of its 50 DMA line which had triggered a technical sell signal. Prior chart highs near $32 are an important technical support level to watch now. First featured at $26.75 in the 3/31/09 CANSLIM.net Mid-Day Breakouts Report (read here). This high-ranked Chinese Internet - Content firm was also summarized in greater detail including an annotated graph in the April 2009 issue of CANSLIM.net News (read here).
>>> The latest Featured Stock Update with an annotated graph appeared on 7/14/2009. click here.
|
|
C
A
S
I |
News |
Chart |
SEC
View all notes Alert
me of new notes
Company
Profile
|
NVEC
- NASDAQ
N V E Corp
ELECTRONICS - Semiconductor - Specialized
|
$47.89
|
+0.89
|
40,372
N/A
|
3/13/2009
(Date
Featured) |
$33.85
(Price
Featured) |
PP = $45.50 |
G |
| MB = $47.78 |
Most Recent Note - 7/16/2009 4:08:24 PM
G - Recently found support near its 50 DMA line and prior highs - important support to watch, where violations would raise concerns and trigger technical sell signals. Color code was changed to green based deterioration after its 6/19/09 breakout from an "ascending base" type pattern was completely negated. Sales increases in recent comparisons have been under the +25% guideline and still rather minuscule, leaving concerns, especially in the event of any hiccups. This is a reason to be especially disciplined about proper entries and exits.
>>> The latest Featured Stock Update with an annotated graph appeared on 7/8/2009. click here.
|
|
C
A
S
I |
News |
Chart |
SEC
View all notes Alert
me of new notes
Company
Profile
|
SNDA
-
|
$56.16
|
+2.32
|
1,295,817
N/A
|
5/31/2009
(Date
Featured) |
$57.62
(Price
Featured) |
PP = $53.95 |
G |
| MB = $56.65 |
Most Recent Note - 7/16/2009 3:58:09 PM
G - Gain on near average volume today helped it rally above its 50 DMA line. Subsequent deterioration below its recent chart low near $50 could raise more serious concerns and trigger a worrisome technical sell signal. Detailed analysis was included when recently featured in the June 2009 issue of CANSLIM.net News. Be sure to review the "What to Look Out For" section and entire detailed summary - read here).
>>> The latest Featured Stock Update with an annotated graph appeared on 7/15/2009. click here.
|
|
C
A
S
I |
News |
Chart |
SEC
View all notes Alert
me of new notes
Company
Profile
|
SYNA
- NASDAQ
Synaptics Inc
COMPUTER SOFTWARE & SERVICES - Information Technology Service
|
$32.71
|
-0.04
|
1,968,559
N/A
|
5/18/2009
(Date
Featured) |
$32.58
(Price
Featured) |
PP = $34.52 |
G |
| MB = $36.25 |
Most Recent Note - 7/16/2009 4:09:22 PM
G - Held its ground again today after a considerable loss on 7/14/09 with heavy volume indicated heavy distributional pressure, raising more concerns. A 50 DMA line violation on 7/08/09 triggered a technical sell signal. For its outlook to improve it would need to rally back above its 50 DMA line. First featured in yellow in the May 18, 2009 mid-day report (read here). The number of top-rated funds owning its shares rose from 123 in June '08 to 201 in March '09, which is good news concerning the I criteria. Its annual earnings (the A criteria) history showed a dowturn in 2006, leaving concerns, but it followed that up with strong growth the next 2 years. Its small supply of shares (the S criteria) outstanding could contribute to especially great volatility in the event of institutional accumulation or distribution.
>>> The latest Featured Stock Update with an annotated graph appeared on 7/10/2009. click here.
|
|
C
A
S
I |
News |
Chart |
SEC
View all notes Alert
me of new notes
Company
Profile
|
TNDM
- NASDAQ
Tandem Diabetes Care Inc
TELECOMMUNICATIONS - Wireless Communications
|
$28.84
|
-0.06
|
203,988
N/A
|
3/2/2009
(Date
Featured) |
$18.89
(Price
Featured) |
PP = $29.85 |
G |
| MB = $31.34 |
Most Recent Note - 7/16/2009 4:12:16 PM
G - Today's small loss on very light volume ended a streak of 5th consecutive small gains on very light volume. It rebounded above its 50 DMA line this week, but subsequent deterioration below that short-term average and recent lows would raise concerns and trigger sell signals. Its choppy chart offers no sound base per the investment system's guidelines. It traded up as much as +72.42% since first featured at $18.89 in the 3/02/09 Mid-Day BreakOuts Report (read here).
>>> The latest Featured Stock Update with an annotated graph appeared on 7/7/2009. click here.
|
|
C
A
S
I |
News |
Chart |
SEC
View all notes Alert
me of new notes
Company
Profile
|
|
|
|
THESE ARE NOT BUY RECOMMENDATIONS!
Comments contained in the body of this report are technical
opinions only. The material herein has been obtained
from sources believed to be reliable and accurate, however,
its accuracy and completeness cannot be guaranteed.
This site is not an investment advisor, hence it does
not endorse or recommend any securities or other investments.
Any recommendation contained in this report may not
be suitable for all investors and it is not to be deemed
an offer or solicitation on our part with respect to
the purchase or sale of any securities. All trademarks,
service marks and trade names appearing in this report
are the property of their respective owners, and are
likewise used for identification purposes only.
This report is a service available
only to active Paid Premium Members.
You may opt-out of receiving report notifications
at any time. Questions or comments may be submitted
by writing to Premium Membership Services 665 S.E. 10 Street, Suite 201 Deerfield Beach, FL 33441-5634 or by calling 1-800-965-8307
or 954-785-1121.
|
|
|

