You are not logged in.
This means you
CAN ONLY VIEW reports that were published prior to Monday, April 14, 2025.
You
MUST UPGRADE YOUR MEMBERSHIP if you want to see any current reports.
AFTER MARKET UPDATE - FRIDAY, JULY 15TH, 2011
Previous After Market Report Next After Market Report >>>
|
|
|
|
DOW |
+42.61 |
12,479.73 |
+0.34% |
|
Volume |
1,073,718,000 |
+16% |
|
Volume |
1,765,285,820 |
-7% |
|
NASDAQ |
+27.13 |
2,789.80 |
+0.98% |
|
Advancers |
1,807 |
59% |
|
Advancers |
1,525 |
57% |
|
S&P 500 |
+7.27 |
1,316.14 |
+0.56% |
|
Decliners |
1,164 |
38% |
|
Decliners |
1,056 |
39% |
|
Russell 2000 |
+5.46 |
828.78 |
+0.66% |
|
52 Wk Highs |
62 |
|
|
52 Wk Highs |
40 |
|
|
S&P 600 |
+2.55 |
445.90 |
+0.58% |
|
52 Wk Lows |
51 |
|
|
52 Wk Lows |
34 |
|
|
 |
Major Averages Halt Slide After Negative Week
Kenneth J. Gruneisen - Passed the CAN SLIM® Master's Exam
The major indices posted small gains on Friday, but for the week, the Dow Jones Industrial Average fell -1.4%, the S&P 500 Index was down -2.1%, and the Nasdaq Composite Index lost -2.5%. There was higher volume reported on the NYSE and a lower volume total on the Nasdaq exchange versus Thursday's volume totals. Advancing issues beat decliners by 3-2 on the NYSE and by 7-5 on the Nasdaq exchange. New 52-week highs narrowly outnumbered new 52-week lows on the NYSE and on the Nasdaq exchange. There were 15 high-ranked companies from the CANSLIM.net Leaders List that made new 52-week highs and appeared on the CANSLIM.net BreakOuts Page, down from the total of 22 on the prior session. There were only 7 gainers out of the 17 high-ranked leaders currently included on the Featured Stocks Page.
A disappointing reading on consumer sentiment limited overall gains for the market. The University of Michigan's July index was 63.8, much lower than analysts were expecting. Wall Street showed relief when only eight banks, none of them major, failed European Union stress tests.
Gold hit another new record and has rallied over +7% in the past two weeks. Failure to reach agreement on the nation's debt limit has been building since the U.S. was warned that it may lose its Triple-A credit rating. Financial shares have been the bane of the market in recent months. On Friday, Citigroup (C -1.64%) lost ground even though its profits exceeded forecasts.
Better-than-expected earnings results from Google Inc (GOOG +12.98%) led to a gap up gain that helped the Internet group lead the tech sector higher. Takeover announcements also eased concerns about the economy. Energy stocks rose on prospects for consolidation after BHP Billiton (BHP -1.30%) said it will purchase Petrohawk Energy Corp (HK +62.49%) for $15.1 billion. Investor Carl Icahn offered to buy Clorox (CLX +8.94%) for $12.6 billion.
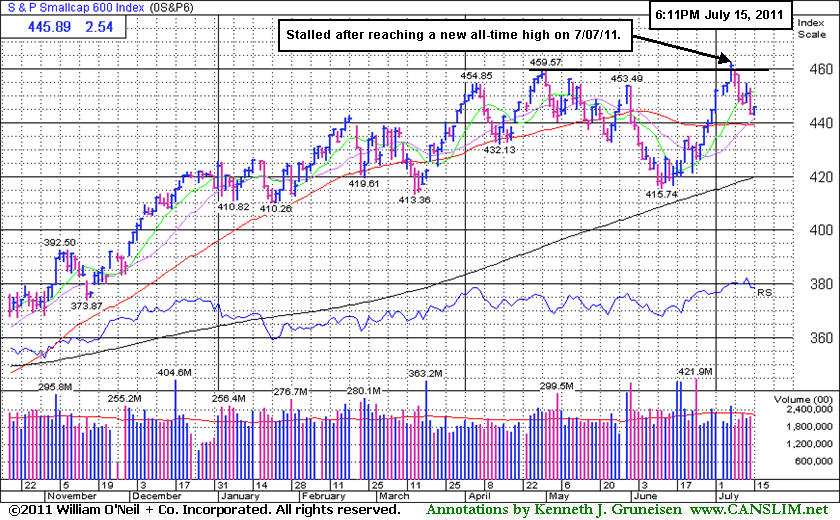
The S&P 500 Index's gain helped it promptly rebound and close back above its sinking 50-day moving average (DMA) line. Meanwhile, the Dow and Nasdaq are consolidating above their respective short-term averages.
Distributional pressure has put the current rally under pressure again. Earnings news and guidance from companies may be a catalyst for additional volatility in the coming weeks as earnings announcements roll in. Our July 2011 issue of CANSLIM.net News is due to be released soon with a comprehensive summary of current market conditions that further clarifies matters concerning the M criteria! The Q2 2011 CANSLIM.net Webcast is available "ON DEMAND" now to UPGRADED MEMBERS ONLY - (CLICK HERE).
PICTURED: The S&P Small-Cap 600 Index stalled after reaching a new all-time high on July 7th.
|
 Kenneth J. Gruneisen started out as a licensed stockbroker in August 1987, a couple of months prior to the historic stock market crash that took the Dow Jones Industrial Average down -22.6% in a single day. He has published daily fact-based fundamental and technical analysis on high-ranked stocks online for two decades. Through FACTBASEDINVESTING.COM, Kenneth provides educational articles, news, market commentary, and other information regarding proven investment systems that work in good times and bad.
Comments contained in the body of this report are technical opinions only and are not necessarily those of Gruneisen Growth Corp. The material herein has been obtained from sources believed to be reliable and accurate, however, its accuracy and completeness cannot be guaranteed. Our firm, employees, and customers may effect transactions, including transactions contrary to any recommendation herein, or have positions in the securities mentioned herein or options with respect thereto. Any recommendation contained in this report may not be suitable for all investors and it is not to be deemed an offer or solicitation on our part with respect to the purchase or sale of any securities. |
|
 |
Commodity-Linked Groups Led Gainers
Kenneth J. Gruneisen - Passed the CAN SLIM® Master's Exam
Commodity-linked groups were the standout gainers on Friday as the Integrated Oil Index ($XOI +1.78%) and Oil Services Index ($OSX +2.55%) posted solid gains and the Gold & Silver Index ($XAU +1.25%) rose. The Internet Index ($IIX +1.77%) led the tech sector while the Networking Index ($NWX +0.51%) and Semiconductor Index ($SOX +0.60%) posted smaller gains and the Biotechnology Index ($BTK -0.04%) finished flat. The Healthcare Index ($HMO -0.54%) backpedaled. While the Retail Index ($RLX +0.29%) notched a modest gain, the financial groups had a slightly negative bias and the Broker/Dealer Index ($XBD -0.40%) and Bank Index ($BKX -0.28%) slumped at their 2011 lows.
Charts courtesy www.stockcharts.com
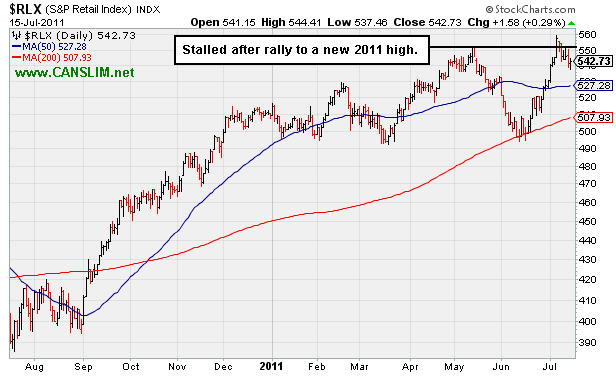
PICTURED: The Retail Index ($RLX +0.29%) stalled after rallying to a new 2011 high.
| Oil Services |
$OSX |
270.21 |
+6.72 |
+2.55% |
+10.24% |
| Healthcare |
$HMO |
2,433.55 |
-13.33 |
-0.54% |
+43.83% |
| Integrated Oil |
$XOI |
1,311.87 |
+22.88 |
+1.78% |
+8.14% |
| Semiconductor |
$SOX |
390.07 |
+2.31 |
+0.60% |
-5.28% |
| Networking |
$NWX |
287.28 |
+1.46 |
+0.51% |
+2.40% |
| Internet |
$IIX |
312.91 |
+5.43 |
+1.77% |
+1.68% |
| Broker/Dealer |
$XBD |
102.49 |
-0.42 |
-0.40% |
-15.66% |
| Retail |
$RLX |
542.73 |
+1.58 |
+0.29% |
+6.76% |
| Gold & Silver |
$XAU |
216.95 |
+2.67 |
+1.25% |
-4.25% |
| Bank |
$BKX |
46.29 |
-0.13 |
-0.28% |
-11.34% |
| Biotech |
$BTK |
1,435.25 |
-0.53 |
-0.04% |
+10.61% |
|
|
|
 |
Extended After +20% Gains in First 2-3 Weeks After Latest Breakout
Kenneth J. Gruneisen - Passed the CAN SLIM® Master's Exam
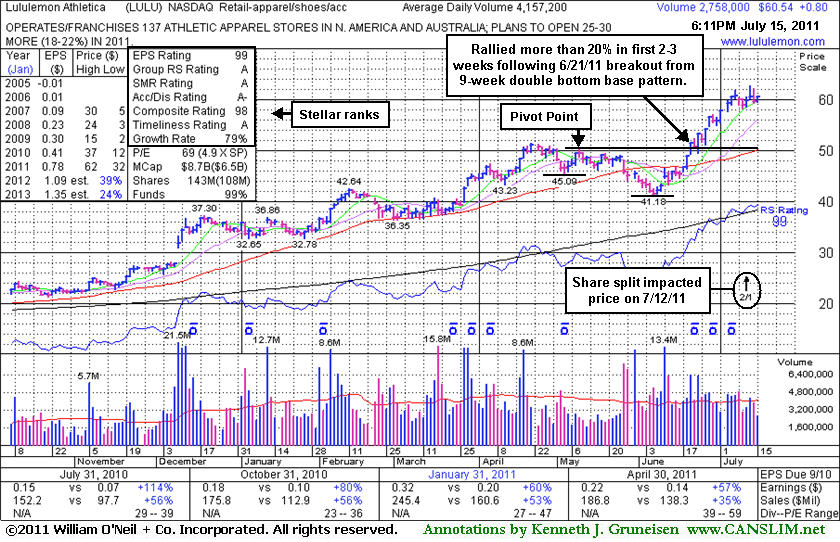
Lululemon Athletica (LULU +$0.80 or +1.34% to $60.54) is perched -3.7% off its 52-week high. Do not be confused by the 2:1 split impacting its share price effective 7/12/11 while perched near its all-time high. Its rally of better than +20% in less than 3 weeks after its recent technical breakout argues for investors to follow the investment system rule of holding stocks with such powerful early gains for 8 weeks minimum unless there is a bad technical breakdown. This rule is because many of the investment system's biggest winners and best examples among the winning models were those companies that had tallied big gains shortly after their breakouts, then went on to produce dramatic gains.
Its last appearance in this FSU section was on 6/21/11 with an annotated graph under the headline, "Volume-Driven Gain Clears Resistance For New Highs", as it hit new 52-week and all-time highs with +68% above average volume behind its gain. The 6/21/11 mid-day report noted as the previously Featured Stock had its color code changed to yellow with a new pivot point cited based on a "double bottom" base formed over the prior 9 weeks. The evening report stated - "This high-ranked Retail-Apparel firm has confirmed a new technical buy signal with its solid gain above the new pivot point cited. No overhead supply remains to hinder its progress now, and it could go on to produce more climactic gains. As always, limit losses by selling if ever a stock fall more than -7% from your purchase price."
The number of top-rated funds owning its shares rose from 260 in Sep '10 to 324 in Mar '11. The 7 latest quarterly comparisons showed strong sales revenues and impressive earnings increases (C criteria), and it maintained a good annual earnings history (A criteria) despite a patch of negative comparisons in early '09. LULU was first featured in yellow at $47.66 in the October 8, 2010 mid-day report report (read here) and it traded up as much as +163.7% in a little more than 9 months.
|
|
|
Color Codes Explained :
Y - Better candidates highlighted by our
staff of experts.
G - Previously featured
in past reports as yellow but may no longer be buyable under the
guidelines.
***Last / Change / Volume data in this table is the closing quote data***
Symbol/Exchange
Company Name
Industry Group |
PRICE |
CHANGE
(%Change) |
Day High |
Volume
(% DAV)
(% 50 day avg vol) |
52 Wk Hi
% From Hi |
Featured
Date |
Price
Featured |
Pivot Featured |
|
Max Buy |
CACC
-
NASDAQ
Credit Acceptance Corp
FINANCIAL SERVICES - Credit Services
|
$82.97
|
+0.09
0.11% |
$83.94
|
15,273
36.63% of 50 DAV
50 DAV is 41,700
|
$86.87
-4.49%
|
6/2/2011
|
$76.10
|
PP = $82.39
|
|
MB = $86.51
|
Most Recent Note - 7/13/2011 8:51:50 PM
Y - Quietly consolidating after its 6/30/11 technical breakout, holding its ground above its pivot point, and it is not extended beyond its "max buy" level. Prior highs in the $80-82 area define initial support to watch on pullbacks.
>>> The latest Featured Stock Update with an annotated graph appeared on 6/27/2011. Click here.
View all notes |
Alert me of new notes |
CANSLIM.net Company Profile |
SEC |
Zacks Reports |
StockTalk |
News |
Chart |
Request a new note
C
A N
S L
I M


|
CMG
-
NYSE
Chipotle Mexican Grill
LEISURE - Restaurants
|
$324.60
|
-0.03
-0.01% |
$326.18
|
833,250
105.26% of 50 DAV
50 DAV is 791,600
|
$329.80
-1.58%
|
4/1/2011
|
$274.00
|
PP = $275.10
|
|
MB = $288.86
|
Most Recent Note - 7/13/2011 8:52:48 PM
G - Up today with slightly above average volume. Extended from prior highs and an upward trendline that define chart support to watch.
>>> The latest Featured Stock Update with an annotated graph appeared on 7/8/2011. Click here.
View all notes |
Alert me of new notes |
CANSLIM.net Company Profile |
SEC |
Zacks Reports |
StockTalk |
News |
Chart |
Request a new note
C
A N
S L
I M
|
EW
-
NYSE
Edwards Lifesciences Cp
HEALTH SERVICES - Medical Appliances and Equipment
|
$88.94
|
-1.01
-1.12% |
$90.19
|
845,492
114.29% of 50 DAV
50 DAV is 739,800
|
$91.82
-3.14%
|
7/6/2011
|
$89.19
|
PP = $90.48
|
|
MB = $95.00
|
Most Recent Note - 7/13/2011 8:53:23 PM
Y - This high-ranked Medical - Products firm is still quietly perched within close striking distance of its 52-week and all-time highs. Disciplined investors will watch first for volume-driven gains and a strong close above its pivot point to trigger a proper technical buy signal.
>>> The latest Featured Stock Update with an annotated graph appeared on 7/7/2011. Click here.
View all notes |
Alert me of new notes |
CANSLIM.net Company Profile |
SEC |
Zacks Reports |
StockTalk |
News |
Chart |
Request a new note
C
A N
S L
I M
|
EZPW
-
NASDAQ
Ezcorp Inc Cl A
SPECIALTY RETAIL - Specialty Retail, Other
|
$36.75
|
+0.20
0.55% |
$37.13
|
319,403
80.35% of 50 DAV
50 DAV is 397,500
|
$38.66
-4.94%
|
6/13/2011
|
$31.18
|
PP = $33.41
|
|
MB = $35.08
|
Most Recent Note - 7/14/2011 12:52:56 PM
G - Reversed into the red after a small gap up today. It is very extended from prior highs in the $33 area that define support to watch on pullbacks.
>>> The latest Featured Stock Update with an annotated graph appeared on 7/5/2011. Click here.
View all notes |
Alert me of new notes |
CANSLIM.net Company Profile |
SEC |
Zacks Reports |
StockTalk |
News |
Chart |
Request a new note
C
A N
S L
I M
|
FCFS
-
NASDAQ
First Cash Financial Svs
SPECIALTY RETAIL - Specialty Retail, Other
|
$41.99
|
-0.42
-0.99% |
$42.48
|
166,307
89.61% of 50 DAV
50 DAV is 185,600
|
$44.84
-6.36%
|
5/31/2011
|
$42.00
|
PP = $40.23
|
|
MB = $42.24
|
Most Recent Note - 7/13/2011 8:46:31 PM
G - Consolidating -5% off its all-time high today, slightly extended from its prior base. Prior highs in the $40-42 area define initial support areas to watch.
>>> The latest Featured Stock Update with an annotated graph appeared on 6/22/2011. Click here.
View all notes |
Alert me of new notes |
CANSLIM.net Company Profile |
SEC |
Zacks Reports |
StockTalk |
News |
Chart |
Request a new note
C
A N
S L
I M
|
Symbol/Exchange
Company Name
Industry Group |
PRICE |
CHANGE
(%Change) |
Day High |
Volume
(% DAV)
(% 50 day avg vol) |
52 Wk Hi
% From Hi |
Featured
Date |
Price
Featured |
Pivot Featured |
|
Max Buy |
FOSL
-
NASDAQ
Fossil Inc
CONSUMER DURABLES - Recreational Goods, Other
|
$128.90
|
+0.87
0.68% |
$129.58
|
509,682
64.57% of 50 DAV
50 DAV is 789,300
|
$130.46
-1.20%
|
2/1/2011
|
$73.30
|
PP = $74.44
|
|
MB = $78.16
|
Most Recent Note - 7/14/2011 12:54:56 PM
G - Perched at its all-time high after 4 consecutive volume-driven gains. It is extended from prior highs in the $107 area that now define initial support to watch near its 50 DMA line.
>>> The latest Featured Stock Update with an annotated graph appeared on 6/28/2011. Click here.
View all notes |
Alert me of new notes |
CANSLIM.net Company Profile |
SEC |
Zacks Reports |
StockTalk |
News |
Chart |
Request a new note
C
A N
S L
I M
|
HS
-
NYSE
Healthspring Inc
HEALTH SERVICES - Health Care Plans
|
$45.55
|
-0.93
-2.00% |
$46.76
|
793,778
94.61% of 50 DAV
50 DAV is 839,000
|
$48.95
-6.95%
|
6/16/2011
|
$42.44
|
PP = $45.21
|
|
MB = $47.47
|
 Most Recent Note - 7/15/2011 4:18:50 PM
Y - Quietly consolidating this week under its "max buy" level. Prior resistance near $45 coinciding with its 50 DMA line defines an important support level to watch.
>>> The latest Featured Stock Update with an annotated graph appeared on 7/11/2011. Click here.
View all notes |
Alert me of new notes |
CANSLIM.net Company Profile |
SEC |
Zacks Reports |
StockTalk |
News |
Chart |
Request a new note
C
A N
S L
I M
|
INFA
-
NASDAQ
Informatica Corp
COMPUTER SOFTWARE and SERVICES - Business Software and Services
|
$53.53
|
-2.86
-5.07% |
$56.83
|
4,043,721
333.75% of 50 DAV
50 DAV is 1,211,600
|
$62.42
-14.24%
|
7/1/2011
|
$59.36
|
PP = $60.08
|
|
MB = $63.08
|
Most Recent Note - 7/15/2011 4:15:47 PM
G - Violated its 50 DMA line with a considerable loss on heavy volume triggering a technical sell signal. Its color code is changed to green after its damaging streak of 7 consecutive losses. Its prior low ($52.90 on 6/16/11) defines the next important chart support level to watch.
>>> The latest Featured Stock Update with an annotated graph appeared on 7/12/2011. Click here.
View all notes |
Alert me of new notes |
CANSLIM.net Company Profile |
SEC |
Zacks Reports |
StockTalk |
News |
Chart |
Request a new note
C
A N
S L
I M
|
LULU
-
NASDAQ
Lululemon Athletica
MANUFACTURING - Textile Manufacturing
|
$60.54
|
+0.80
1.34% |
$60.78
|
2,759,205
66.37% of 50 DAV
50 DAV is 4,157,200
|
$62.86
-3.69%
|
6/21/2011
|
$102.95
|
PP = $101.14
|
|
MB = $106.20
|
Most Recent Note - 7/14/2011 4:17:14 PM
G - Do not be confused by the 2:1 split impacting its share price effective 7/12/11 while perched near its all-time high. Its rally of better than +20% in less than 3 weeks after its recent technical breakout argues for investors to follow the investment system rule of holding stocks with such powerful early gains for 8 weeks minimum.
>>> The latest Featured Stock Update with an annotated graph appeared on 7/15/2011. Click here.
View all notes |
Alert me of new notes |
CANSLIM.net Company Profile |
SEC |
Zacks Reports |
StockTalk |
News |
Chart |
Request a new note
C
A N
S L
I M
|
MWIV
-
NASDAQ
M W I Veterinary Supply
HEALTH SERVICES - Medical Instruments and; Supplies
|
$82.34
|
-0.60
-0.72% |
$83.47
|
51,878
75.96% of 50 DAV
50 DAV is 68,300
|
$86.99
-5.35%
|
7/11/2011
|
$83.39
|
PP = $84.67
|
|
MB = $88.90
|
Most Recent Note - 7/14/2011 4:09:57 PM
Y - Down today on higher but below average volume, pulling back after a new high close on the prior session. Color code was changed to yellow with new pivot point cited based on its 5/20/11 high plus 10 cents. Volume-driven gains are needed to confirm a proper technical buy signal.
>>> The latest Featured Stock Update with an annotated graph appeared on 6/30/2011. Click here.
View all notes |
Alert me of new notes |
CANSLIM.net Company Profile |
SEC |
Zacks Reports |
StockTalk |
News |
Chart |
Request a new note
C
A N
S L
I M
|
Symbol/Exchange
Company Name
Industry Group |
PRICE |
CHANGE
(%Change) |
Day High |
Volume
(% DAV)
(% 50 day avg vol) |
52 Wk Hi
% From Hi |
Featured
Date |
Price
Featured |
Pivot Featured |
|
Max Buy |
OPNT
-
NASDAQ
Opnet Technologies
INTERNET - Internet Software and Services
|
$38.81
|
-0.55
-1.40% |
$39.42
|
119,527
95.39% of 50 DAV
50 DAV is 125,300
|
$42.51
-8.70%
|
6/28/2011
|
$40.87
|
PP = $42.61
|
|
MB = $44.74
|
Most Recent Note - 7/14/2011 3:47:47 PM
G - Still sputtering today perched just above its 50 DMA line. Its color code was changed to green after mild distributional damage, and disciplined investors should note that it did not trigger a confirming technical buy signal after its new pivot point was recently cited. Recent lows near $36 define important near-term chart support.
>>> The latest Featured Stock Update with an annotated graph appeared on 7/1/2011. Click here.
View all notes |
Alert me of new notes |
CANSLIM.net Company Profile |
SEC |
Zacks Reports |
StockTalk |
News |
Chart |
Request a new note
C
A N
S L
I M
|
OTEX
-
NASDAQ
Open Text Corp
INTERNET - Internet Software and Services
|
$68.73
|
+0.06
0.09% |
$69.47
|
357,408
123.67% of 50 DAV
50 DAV is 289,000
|
$72.32
-4.96%
|
6/1/2011
|
$65.86
|
PP = $67.18
|
|
MB = $70.54
|
Most Recent Note - 7/14/2011 1:27:09 PM
Y - It has reversed into the red today from earlier highs above its "max buy" level after a gap up. The 7/13/11 gain with volume +187% above average confirmed a technical buy signal.
>>> The latest Featured Stock Update with an annotated graph appeared on 6/24/2011. Click here.
View all notes |
Alert me of new notes |
CANSLIM.net Company Profile |
SEC |
Zacks Reports |
StockTalk |
News |
Chart |
Request a new note
C
A N
S L
I M
|
PRGO
-
NASDAQ
Perrigo Co
DRUGS - Drug Related Products
|
$91.80
|
-0.83
-0.90% |
$93.19
|
374,897
77.36% of 50 DAV
50 DAV is 484,600
|
$93.70
-2.03%
|
7/13/2011
|
$92.89
|
PP = $92.40
|
|
MB = $97.02
|
Most Recent Note - 7/13/2011 9:37:59 PM
Y - Hit a new 52-week high today after a small gap up, rising from an orderly saucer shaped 11-week base with a shorter than 1-week handle. Color code was changed to yellow with new pivot point cited based on its 52-week high plus 10 cents. A strong volume-driven gain and close above its pivot may trigger a technical buy signal, however it is considered a riskier late-stage setup. See the latest FSU analysis for more details and a new annotated graph.
>>> The latest Featured Stock Update with an annotated graph appeared on 7/13/2011. Click here.
View all notes |
Alert me of new notes |
CANSLIM.net Company Profile |
SEC |
Zacks Reports |
StockTalk |
News |
Chart |
Request a new note
C
A N
S L
I M
|
QSII
-
NASDAQ
Quality Systems Inc
COMPUTER SOFTWARE and SERVICES - Healthcare Information Service
|
$86.72
|
-0.75
-0.86% |
$87.72
|
212,252
92.89% of 50 DAV
50 DAV is 228,500
|
$92.38
-6.13%
|
7/6/2011
|
$91.26
|
PP = $91.67
|
|
MB = $96.25
|
Most Recent Note - 7/13/2011 8:56:28 PM
Y - Pulled back with below average volume for a 3rd consecutive loss today. It touched a new all-time high last week and has formed cup-with-handle base. A volume-driven gain above its pivot point is still needed to trigger a new technical buy signal.
>>> The latest Featured Stock Update with an annotated graph appeared on 7/6/2011. Click here.
View all notes |
Alert me of new notes |
CANSLIM.net Company Profile |
SEC |
Zacks Reports |
StockTalk |
News |
Chart |
Request a new note
C
A N
S L
I M
|
SWI
-
NYSE
Solarwinds Inc
COMPUTER SOFTWARE and SERVICES - Application Software
|
$23.84
|
-0.01
-0.04% |
$24.07
|
1,442,147
165.10% of 50 DAV
50 DAV is 873,500
|
$26.68
-10.64%
|
6/7/2011
|
$24.22
|
PP = $25.05
|
|
MB = $26.30
|
Most Recent Note - 7/14/2011 3:40:11 PM
G - Color code is changed to green after a more damaging loss today with heavier volume, its 5th consecutive loss, leading to a violation of its 50 DMA line triggering a technical sell signal.
>>> The latest Featured Stock Update with an annotated graph appeared on 6/29/2011. Click here.
View all notes |
Alert me of new notes |
CANSLIM.net Company Profile |
SEC |
Zacks Reports |
StockTalk |
News |
Chart |
Request a new note
C
A N
S L
I M
|
Symbol/Exchange
Company Name
Industry Group |
PRICE |
CHANGE
(%Change) |
Day High |
Volume
(% DAV)
(% 50 day avg vol) |
52 Wk Hi
% From Hi |
Featured
Date |
Price
Featured |
Pivot Featured |
|
Max Buy |
ULTA
-
NASDAQ
Ulta Salon Cosm & Frag
SPECIALTY RETAIL - Specialty Retail, Other
|
$64.31
|
+0.98
1.55% |
$64.33
|
584,023
64.69% of 50 DAV
50 DAV is 902,800
|
$68.80
-6.53%
|
1/6/2011
|
$36.12
|
PP = $37.34
|
|
MB = $39.21
|
Most Recent Note - 7/14/2011 3:41:22 PM
G - Quietly pulling back from its all-time high this week. It is extended from any sound base pattern and well above its 50 DMA line. It may produce more climactic gains, but disciplined investors avoid chasing extended stocks.
>>> The latest Featured Stock Update with an annotated graph appeared on 7/14/2011. Click here.
View all notes |
Alert me of new notes |
CANSLIM.net Company Profile |
SEC |
Zacks Reports |
StockTalk |
News |
Chart |
Request a new note
C
A N
S L
I M
|
ZAGG
-
NASDAQ
Zagg Inc
SPECIALTY RETAIL - Specialty Retail, Other
|
$15.32
|
+0.89
6.17% |
$15.40
|
3,006,379
131.15% of 50 DAV
50 DAV is 2,292,300
|
$15.85
-3.34%
|
6/1/2011
|
$10.92
|
PP = $10.59
|
|
MB = $11.12
|
Most Recent Note - 7/15/2011 4:10:41 PM
G - Rallied today with above average volume for a new high close. It is extended from a sound base, well above its 50 DMA line and recently lows defining chart support.
>>> The latest Featured Stock Update with an annotated graph appeared on 6/23/2011. Click here.
View all notes |
Alert me of new notes |
CANSLIM.net Company Profile |
SEC |
Zacks Reports |
StockTalk |
News |
Chart |
Request a new note
C
A N
S L
I M
|
|
|
|
THESE ARE NOT BUY RECOMMENDATIONS!
Comments contained in the body of this report are technical
opinions only. The material herein has been obtained
from sources believed to be reliable and accurate, however,
its accuracy and completeness cannot be guaranteed.
This site is not an investment advisor, hence it does
not endorse or recommend any securities or other investments.
Any recommendation contained in this report may not
be suitable for all investors and it is not to be deemed
an offer or solicitation on our part with respect to
the purchase or sale of any securities. All trademarks,
service marks and trade names appearing in this report
are the property of their respective owners, and are
likewise used for identification purposes only.
This report is a service available
only to active Paid Premium Members.
You may opt-out of receiving report notifications
at any time. Questions or comments may be submitted
by writing to Premium Membership Services 665 S.E. 10 Street, Suite 201 Deerfield Beach, FL 33441-5634 or by calling 1-800-965-8307
or 954-785-1121.
|
|
|

