You are not logged in.
This means you
CAN ONLY VIEW reports that were published prior to Monday, April 14, 2025.
You
MUST UPGRADE YOUR MEMBERSHIP if you want to see any current reports.
AFTER MARKET UPDATE - THURSDAY, JULY 15TH, 2010
Previous After Market Report Next After Market Report >>>
|
|
|
|
DOW |
-7.41 |
10,359.31 |
-0.07% |
|
Volume |
1,116,892,890 |
+6% |
|
Volume |
1,934,691,240 |
-9% |
|
NASDAQ |
-0.76 |
2,249.08 |
-0.03% |
|
Advancers |
1,454 |
46% |
|
Advancers |
884 |
32% |
|
S&P 500 |
+1.31 |
1,096.48 |
+0.12% |
|
Decliners |
1,549 |
50% |
|
Decliners |
1,759 |
64% |
|
Russell 2000 |
-5.54 |
634.62 |
-0.87% |
|
52 Wk Highs |
88 |
|
|
52 Wk Highs |
22 |
|
|
S&P 600 |
-2.95 |
341.37 |
-0.86% |
|
52 Wk Lows |
12 |
|
|
52 Wk Lows |
33 |
|
|
 |
Friday's Plunge Quickly Negated the Week's Gains
Adam Sarhan, Contributing Writer,
The major averages plunged on Friday after Citigroup (C -6.25%) and Bank of America (BAC -9.16%) released their latest quarterly results, meanwhile consumer confidence and consumer prices both fell. The losses erased what would have been another positive week on Wall Street. Volume was reported higher than Thursday's session on both exchanges due to options expirations. There were only 4 high-ranked companies from the CANSLIM.net Leaders List that made a new 52-week high and appeared on the CANSLIM.net BreakOuts Page, lower than the 16 issues that appeared on the prior session. Decliners trumped advancers by almost a 4-to-1 ratio on the NYSE and over a 7-to-1 ratio on the Nasdaq exchange. New 52-week highs solidly outnumbered new 52-week lows on the NYSE but trailed on the Nasdaq exchange. For the rally to have ongoing success it will be critical for a healthy crop of leaders to continue showing up hitting new 52-week highs.
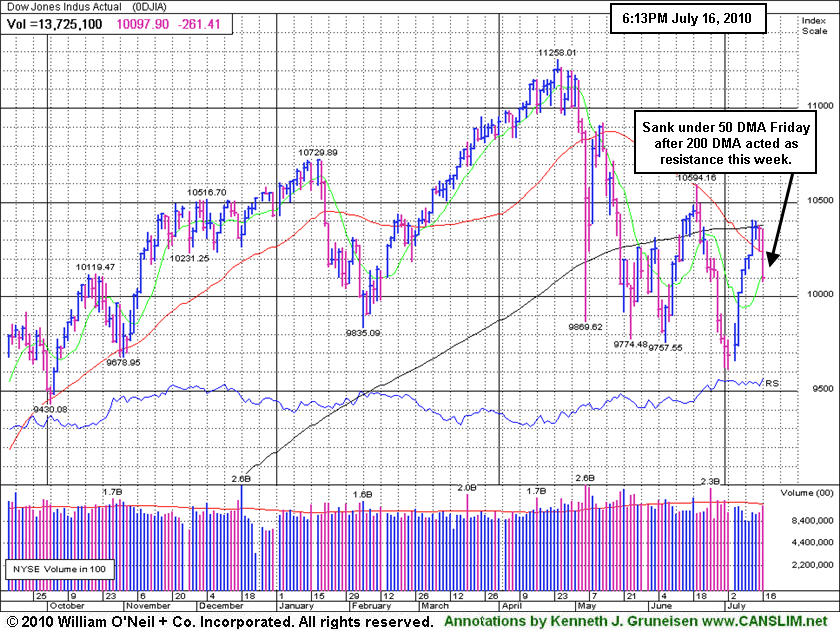
The major averages ended slightly higher on Monday after spending most of the day trading between positive and negative territory ahead of Alcoa Inc's. (AA -3.97%) Q2 results. After Monday's closing bell, the largest US aluminum company kicked off earnings season and reported a profitable Q2 and said sales rose +22%. Stocks enjoyed hefty gains on Tuesday after the government said the trade deficit topped $1 trillion. Technically, it was encouraging to see the Dow Jones Industrial Average rally above its 50-day moving average (DMA) line and rise above a downward trendline. Tuesday's gain also helped the S&P 600 Small Cap Index rally above the April - June downward trendline which was shown on the graph included in Friday evening's commentary (read here). The benchmark S&P 500 Index is now challenging its 50 DMA line, yet it faces resistance at its short-term average and it also remains trading under its 200 DMA line. The Nasdaq Composite Index has rallied very near its 50 and 200 DMA lines which have now converged. The NYSE Composite Index, which was noted in this commentary recently as the first major index to violate its 50 DMA line and the see its 50 and 200 DMA lines form a "death cross", rallied for its first close above its 50 DMA since May 3rd.
On Wednesday, the major averages ended mixed to slightly higher as they consolidated Tuesday's large move.The benchmark S&P 500 Index snapped a streak of 6 straight gains after retail sales fell last month and the Fed released the minutes of its latest meeting. The Commerce Department said retail sales fell -0.5% last month which topped the Street's estimate and followed a -1.1% decline in May. Most of the decline came from the ailing automobile sector, excluding auto dealers, demand fell -0.1% which matched the median estimate. Elsewhere, the Federal Reserve released the minutes of its latest meeting which showed a less than stellar economic outlook. Fed officials said the economy has “softened” which sparked concern of a double dip recession.
On Thursday, stocks erased earlier losses and closed near their intra-day highs as investor's digested a slew of important data: JP Morgan (JPM -3.61%) reported their latest quarterly result, weekly jobless claims and producer prices fell, Goldman Sachs (GS +0.65%) settled with the SEC for $550 million, BP (BP-4.68%) plugged the broken well, the Senate sent President Obama the largest financial regulatory bill since the Great Depression, and the latest read on the manufacturing industry was disappointing. It was somewhat encouraging to see the market shrug off earlier weakness and close near its intra-day highs even though the Nasdaq Composite Index and the Dow Jones Industrial Average snapped 7-day winning streaks.
Over the next few weeks, it will be very interesting to see how companies fared last quarter and, equally important, to see how the market reacts to the numbers. Analysts believe that Q2 earnings for S&P 500 companies rose +34%.
Looking forward, the window remains open for disciplined investors to carefully buy high-ranked stocks. Since the current rally began on July 1, the major averages have rallied on suspiciously light volume for the most part. It is ideal to see volume expand as the major averages break above resistance and see a new batch of high-ranked leaders trigger fresh technical buy signals. These latest improvements are helping to confirm this nascent rally and provide a reassurance that odds are more favorable for successful investing using the fact-based system.
PICTURED: The Dow Jones Industrial Average sank under its 50 DMA line on Friday after encountering resistance this week at its 200 DMA line.
|
|
|
 |
Internet Index Posted 8th Straight Gain
Kenneth J. Gruneisen - Passed the CAN SLIM® Master's Exam
Financial shares were mixed as the Broker/Dealer Index ($XBD +1.04%) posted a gain but the Bank Index ($BKX -0.48%) slumped. The Retail Index ($RLX +0.71%) and the Healthcare Index ($HMO +0.52%) posted small gains, and the Integrated Oil Index ($XOI +1.03%) and Oil Services Index ($OSX +0.25%) ended higher. The Semiconductor Index ($SOX -0.21%) drifted lower while there were small gains from the Internet Index ($IIX +0.06%), Biotechnology Index ($BTK +0.22%), and Networking Index ($NWX +0.23%).
Charts courtesy www.stockcharts.com
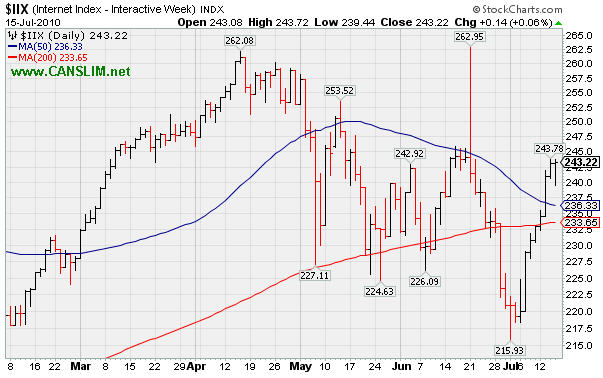
PICTURED: The Internet Index ($IIX +0.06%) edged higher, ralling further above its 50-day and 200-day movimg average (DMA) lines with an 8th consecutive gain. Following Thursday's close, Internet goliath Google Inc (GOOG +0.55%) announced disappointing results and traded lower.
| Oil Services |
$OSX |
178.29 |
+0.44 |
+0.25% |
-8.53% |
| Healthcare |
$HMO |
1,470.38 |
+7.64 |
+0.52% |
-0.17% |
| Integrated Oil |
$XOI |
971.83 |
+9.93 |
+1.03% |
-9.02% |
| Semiconductor |
$SOX |
361.09 |
-0.77 |
-0.21% |
+0.33% |
| Networking |
$NWX |
246.39 |
+0.56 |
+0.23% |
+6.64% |
| Internet |
$IIX |
243.22 |
+0.14 |
+0.06% |
+4.00% |
| Broker/Dealer |
$XBD |
104.04 |
+1.07 |
+1.04% |
-9.57% |
| Retail |
$RLX |
403.93 |
+2.85 |
+0.71% |
-1.75% |
| Gold & Silver |
$XAU |
173.06 |
-0.73 |
-0.42% |
+2.86% |
| Bank |
$BKX |
49.91 |
-0.24 |
-0.48% |
+16.86% |
| Biotech |
$BTK |
1,048.68 |
+2.28 |
+0.22% |
+11.31% |
|
|
|
 |
Winning Streak Continues Despite Weaker Earnings Growth
Kenneth J. Gruneisen - Passed the CAN SLIM® Master's Exam
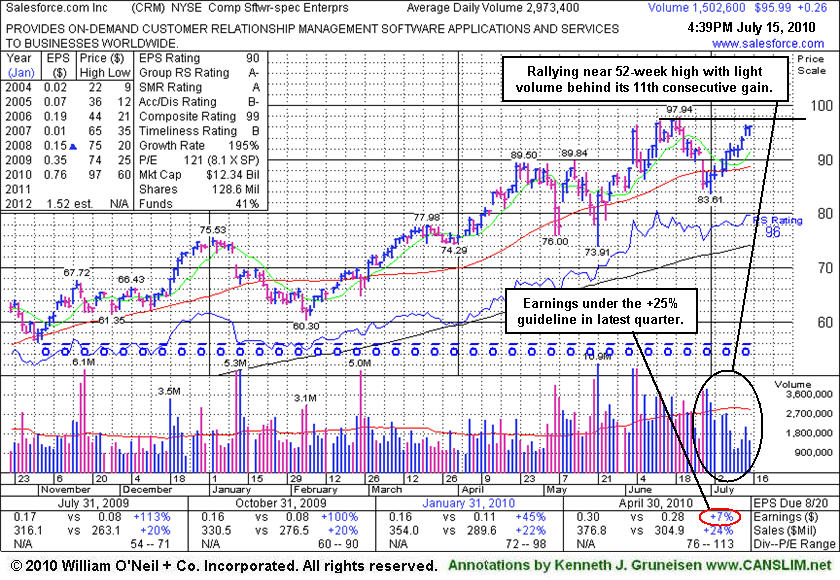
Salesforce.com, Inc. (CRM +$0.26 or +0.27% to $95.99) is approaching its 52-week high with volume totals light while posting an 11th consecutive gain. Although it has been working on building a new base, concerns have been raised by its weaker earnings, making it a questionable candidate for additional buying efforts. It found support after briefly undercutting its 50-day moving average (DMA) line. CRM traded up +108% since featured in a Stock Bulletin on 8/16/09 under the headline "Forces Have Been Favorable For Software Services Firm."
For the quarter ended April 30, 2010 it showed only a +7% earnings per share increase, a difficult comparison marking its first increase below the +25% minimum guideline in years, raising some concern especially while sales revenues again showed mild acceleration. New (or add-on) buying efforts might not be appropriate because of that fundamental flaw for this high-ranked Computer Software - Enterprise firm. Meanwhile those with open positions might choose to give it the benefit of the doubt until a more worrisome technical sell signal might raise greater concerns. The increase in institutional (I criteria) ownership has been encouraging in the past, and the number of top-rated funds owning its shares rose from 283 in Sep '09 to 328 in Jun '10.
|
|
|
Color Codes Explained :
Y - Better candidates highlighted by our
staff of experts.
G - Previously featured
in past reports as yellow but may no longer be buyable under the
guidelines.
***Last / Change / Volume data in this table is the closing quote data***
Symbol/Exchange
Company Name
Industry Group |
PRICE |
CHANGE
(%Change) |
Day High |
Volume
(% DAV)
(% 50 day avg vol) |
52 Wk Hi
% From Hi |
Featured
Date |
Price
Featured |
Pivot Featured |
|
Max Buy |
AAPL
-
NASDAQ
Apple Inc
COMPUTER HARDWARE - Personal Computers
|
$251.45
|
-1.28
-0.51% |
$256.97
|
29,322,740
100.99% of 50 DAV
50 DAV is 29,036,000
|
$279.01
-9.88%
|
6/17/2010
|
$270.95
|
PP = $272.56
|
|
MB = $286.19
|
 Most Recent Note - 7/15/2010 4:31:56 PM
G - Holding its ground following a 7/13/10 loss on heavier than average volume and close below its 50 DMA line. Recent lows in the $242-243 area define important chart support to watch. Recent gains lacked volume after it failed to trigger a proper technical buy signal and then encountered heavy distributional pressure.
>>> The latest Featured Stock Update with an annotated graph appeared on 7/12/2010. Click here.
View all notes |
Alert me of new notes |
CANSLIM.net Company Profile |
SEC |
Zacks Reports |
StockTalk |
News |
Chart |
Request a new note
C
A N
S L
I M


|
ABV
-
NYSE
Comp De Bebidas Adr
FOOD and BEVERAGE - Beverages - Brewers
|
$106.43
|
+0.79
0.75% |
$106.59
|
813,439
108.39% of 50 DAV
50 DAV is 750,500
|
$109.33
-2.65%
|
6/29/2010
|
$104.74
|
PP = $109.33
|
|
MB = $114.80
|
Most Recent Note - 7/14/2010 4:54:56 PM
Y - This Brazil-based beverage firm is quietly perched within close striking distance of its 52-week high. It found support near its 50 DMA line recently and has not yet traded above its pivot point since featured in the 6/29/10 mid-day report (read here).
>>> The latest Featured Stock Update with an annotated graph appeared on 6/29/2010. Click here.
View all notes |
Alert me of new notes |
CANSLIM.net Company Profile |
SEC |
Zacks Reports |
StockTalk |
News |
Chart |
Request a new note
C
A N
S L
I M
|
BIDU
-
NASDAQ
Baidu Inc Ads
INTERNET - Internet Information Providers
|
$75.64
|
+0.61
0.81% |
$75.85
|
8,520,664
58.83% of 50 DAV
50 DAV is 14,483,300
|
$82.29
-8.08%
|
7/14/2010
|
$75.03
|
PP = $78.59
|
|
MB = $82.52
|
Most Recent Note - 7/15/2010 4:32:58 PM
Y - Color code was changed to yellow with new pivot point cited based on 6/21/10 high after a proper double-bottom pattern of sufficient length. Disciplined investors avoid the temptation to get in "early" and watch for a proper technical buy signal.
>>> The latest Featured Stock Update with an annotated graph appeared on 7/14/2010. Click here.
View all notes |
Alert me of new notes |
CANSLIM.net Company Profile |
SEC |
Zacks Reports |
StockTalk |
News |
Chart |
Request a new note
C
A N
S L
I M
|
CRM
-
NYSE
Salesforce.Com Inc
INTERNET - Internet Software and Services
|
$95.99
|
+0.26
0.27% |
$96.21
|
1,524,777
51.62% of 50 DAV
50 DAV is 2,953,600
|
$97.94
-1.99%
|
6/2/2010
|
$88.44
|
PP = $89.60
|
|
MB = $94.08
|
Most Recent Note - 7/15/2010 4:46:45 PM
G - Approaching its 52-week high with volume totals light while posting an 11th consecutive gain.
>>> The latest Featured Stock Update with an annotated graph appeared on 6/22/2010. Click here.
View all notes |
Alert me of new notes |
CANSLIM.net Company Profile |
SEC |
Zacks Reports |
StockTalk |
News |
Chart |
Request a new note
C
A N
S L
I M
|
DECK
-
NASDAQ
Deckers Outdoor Corp
CONSUMER NON-DURABLES - Textile - Apparel Footwear
|
$46.31
|
-0.83
-1.76% |
$47.06
|
954,292
61.88% of 50 DAV
50 DAV is 1,542,200
|
$56.12
-17.48%
|
6/11/2010
|
$157.34
|
PP = $158.57
|
|
MB = $166.50
|
Most Recent Note - 7/13/2010 6:43:02 PM
G - Small gain today with light volume, still struggling below its 50 DMA line which may now act as resistance. A rally above that short-term average would help its outlook, technically. Do not be confused, as the most recent Featured Price, Pivot Point and Max Buy levels have been adjusted to account for a stock split 3:1 effective as of 7/06/10.
>>> The latest Featured Stock Update with an annotated graph appeared on 7/1/2010. Click here.
View all notes |
Alert me of new notes |
CANSLIM.net Company Profile |
SEC |
Zacks Reports |
StockTalk |
News |
Chart |
Request a new note
C
A N
S L
I M
|
Symbol/Exchange
Company Name
Industry Group |
PRICE |
CHANGE
(%Change) |
Day High |
Volume
(% DAV)
(% 50 day avg vol) |
52 Wk Hi
% From Hi |
Featured
Date |
Price
Featured |
Pivot Featured |
|
Max Buy |
FFIV
-
NASDAQ
F 5 Networks Inc
INTERNET - Internet Software and Services
|
$78.70
|
+0.83
1.07% |
$78.98
|
867,408
50.86% of 50 DAV
50 DAV is 1,705,400
|
$79.21
-0.64%
|
6/16/2010
|
$74.50
|
PP = $74.10
|
|
MB = $77.81
|
Most Recent Note - 7/15/2010 4:55:06 PM
G - Gain today on light volume for its best close ever. Above its "max buy" level now, it did not trigger a proper technical buy signal recently. Color code was changed to green.
>>> The latest Featured Stock Update with an annotated graph appeared on 7/7/2010. Click here.
View all notes |
Alert me of new notes |
CANSLIM.net Company Profile |
SEC |
Zacks Reports |
StockTalk |
News |
Chart |
Request a new note
C
A N
S L
I M
|
MELI
-
NASDAQ
Mercadolibre Inc
INTERNET - Internet Software and; Services
|
$62.28
|
+1.28
2.10% |
$62.46
|
676,383
70.74% of 50 DAV
50 DAV is 956,200
|
$62.14
0.23%
|
5/13/2010
|
$54.21
|
PP = $55.85
|
|
MB = $58.64
|
Most Recent Note - 7/15/2010 4:56:26 PM
G - Small gain today with lighter volume a new 52-week high. Color code was changed to green after rising back above its "max buy" level.
>>> The latest Featured Stock Update with an annotated graph appeared on 6/30/2010. Click here.
View all notes |
Alert me of new notes |
CANSLIM.net Company Profile |
SEC |
Zacks Reports |
StockTalk |
News |
Chart |
Request a new note
C
A N
S L
I M
|
NEM
-
NYSE
Newmont Mining Corp
METALS and MINING - Gold
|
$60.70
|
-1.02
-1.65% |
$62.20
|
7,649,014
75.98% of 50 DAV
50 DAV is 10,066,800
|
$63.38
-4.23%
|
6/22/2010
|
$59.60
|
PP = $59.67
|
|
MB = $62.65
|
Most Recent Note - 7/15/2010 4:58:40 PM
Y - Quietly hovering near all-time highs with no overhead supply to act as resistance.
>>> The latest Featured Stock Update with an annotated graph appeared on 7/9/2010. Click here.
View all notes |
Alert me of new notes |
CANSLIM.net Company Profile |
SEC |
Zacks Reports |
StockTalk |
News |
Chart |
Request a new note
C
A N
S L
I M
|
ROVI
-
NASDAQ
Rovi Corp
COMPUTER SOFTWARE andamp; SERVICES - Security Software andamp; Services
|
$42.73
|
-0.47
-1.09% |
$43.48
|
1,274,601
85.53% of 50 DAV
50 DAV is 1,490,300
|
$43.67
-2.15%
|
6/3/2010
|
$38.70
|
PP = $40.16
|
|
MB = $42.17
|
Most Recent Note - 7/14/2010 6:16:40 PM
G - Gain on lighter volume today for a new 52-week high. Prior resistance in the $40 is now an important chart support level above its 50 DMA line.
>>> The latest Featured Stock Update with an annotated graph appeared on 6/28/2010. Click here.
View all notes |
Alert me of new notes |
CANSLIM.net Company Profile |
SEC |
Zacks Reports |
StockTalk |
News |
Chart |
Request a new note
C
A N
S L
I M
|
THOR
-
NASDAQ
Thoratec Corp
HEALTH SERVICES - Medical Instruments and Supplies
|
$44.97
|
+0.08
0.18% |
$45.33
|
225,303
20.96% of 50 DAV
50 DAV is 1,074,700
|
$47.93
-6.18%
|
6/3/2010
|
$44.38
|
PP = $45.35
|
|
MB = $47.62
|
Most Recent Note - 7/12/2010 5:19:18 PM
Y - Quietly consolidating above support at its a 50 DMA line, an important support level.
>>> The latest Featured Stock Update with an annotated graph appeared on 6/23/2010. Click here.
View all notes |
Alert me of new notes |
CANSLIM.net Company Profile |
SEC |
Zacks Reports |
StockTalk |
News |
Chart |
Request a new note
C
A N
S L
I M
|
Symbol/Exchange
Company Name
Industry Group |
PRICE |
CHANGE
(%Change) |
Day High |
Volume
(% DAV)
(% 50 day avg vol) |
52 Wk Hi
% From Hi |
Featured
Date |
Price
Featured |
Pivot Featured |
|
Max Buy |
ULTA
-
NASDAQ
Ulta Salon Cosm & Frag
SPECIALTY RETAIL - Specialty Retail, Other
|
$23.30
|
-0.30
-1.27% |
$23.56
|
378,697
54.82% of 50 DAV
50 DAV is 690,800
|
$26.75
-12.90%
|
5/28/2010
|
$25.58
|
PP = $25.86
|
|
MB = $27.15
|
Most Recent Note - 7/14/2010 6:28:16 PM
G - Small loss today on light volume led to a close just under its 50 DMA line. Its May - June chart lows in the $21 area define the next support level just above its 200 DMA line.
>>> The latest Featured Stock Update with an annotated graph appeared on 6/25/2010. Click here.
View all notes |
Alert me of new notes |
CANSLIM.net Company Profile |
SEC |
Zacks Reports |
StockTalk |
News |
Chart |
Request a new note
C
A N
S L
I M
|
VIT
-
NYSE
Vanceinfo Tech Inc Ads
COMPUTER SOFTWARE and SERVICES - Business Software and Services
|
$25.22
|
+0.22
0.88% |
$25.32
|
523,598
77.74% of 50 DAV
50 DAV is 673,500
|
$26.90
-6.25%
|
7/8/2010
|
$25.20
|
PP = $26.58
|
|
MB = $27.91
|
Most Recent Note - 7/15/2010 5:03:59 PM
Y - Positive reversal after intra-day weakness today. It has formed a handle on the right side of its 11-week cup shaped pattern now. It did not trigger a buy signal with respect to the pivot point cited after gapping up on 7/08/10, when it briefly matched its all-time high and appeared in the mid-day report (read here).
>>> The latest Featured Stock Update with an annotated graph appeared on 7/8/2010. Click here.
View all notes |
Alert me of new notes |
CANSLIM.net Company Profile |
SEC |
Zacks Reports |
StockTalk |
News |
Chart |
Request a new note
C
A N
S L
I M
|
|
|
|
THESE ARE NOT BUY RECOMMENDATIONS!
Comments contained in the body of this report are technical
opinions only. The material herein has been obtained
from sources believed to be reliable and accurate, however,
its accuracy and completeness cannot be guaranteed.
This site is not an investment advisor, hence it does
not endorse or recommend any securities or other investments.
Any recommendation contained in this report may not
be suitable for all investors and it is not to be deemed
an offer or solicitation on our part with respect to
the purchase or sale of any securities. All trademarks,
service marks and trade names appearing in this report
are the property of their respective owners, and are
likewise used for identification purposes only.
This report is a service available
only to active Paid Premium Members.
You may opt-out of receiving report notifications
at any time. Questions or comments may be submitted
by writing to Premium Membership Services 665 S.E. 10 Street, Suite 201 Deerfield Beach, FL 33441-5634 or by calling 1-800-965-8307
or 954-785-1121.
|
|
|


