You are not logged in.
This means you
CAN ONLY VIEW reports that were published prior to Monday, February 26, 2024.
You
MUST UPGRADE YOUR MEMBERSHIP if you want to see any current reports.
AFTER MARKET UPDATE - THURSDAY, JULY 14TH, 2022
Previous After Market Report Next After Market Report >>>
|
|
|
|
DOW |
-142.62 |
30,630.17 |
-0.46% |
|
Volume |
904,371,635 |
+5% |
|
Volume |
4,429,850,500 |
+1% |
|
NASDAQ |
+3.60 |
11,251.19 |
+0.03% |
|
Advancers |
798 |
26% |
|
Advancers |
1,433 |
33% |
|
S&P 500 |
-11.40 |
3,790.38 |
-0.30% |
|
Decliners |
2,284 |
74% |
|
Decliners |
2,845 |
66% |
|
Russell 2000 |
-18.53 |
1,707.51 |
-1.07% |
|
52 Wk Highs |
3 |
|
|
52 Wk Highs |
17 |
|
|
S&P 600 |
-9.95 |
1,113.73 |
-0.89% |
|
52 Wk Lows |
379 |
|
|
52 Wk Lows |
447 |
|
|
 |
Indices Continue Slump Toward Prior Lows With Higher Volume Losses
Kenneth J. Gruneisen - Passed the CAN SLIM® Master's Exam
The Dow lost 142 points, while the S&P 500 eased 0.3%, with both benchmarks falling for a fifth straight session. The Nasdaq Composite closed just above the flat line. Volume totals reported were higher than the prior session on the NYSE and higher on the Nasdaq exchange, indicative of more distributional pressure or selling from the institutional crowd. Decliners led advancers by almost a 3-1 margin on the NYSE and by a 2-1 margin on the Nasdaq exchange. There was 1 high-ranked company from the Leaders List that hit a new 52-week high and was listed on the BreakOuts Page, versus the total of 2 on the prior session. New 52-week lows totals expanded and outnumbered shrinking new 52-week highs totals on the NYSE and on the Nasdaq exchange. The brief new market uptrend is already under pressure (M criteria). Any sustainable rally requires a healthy crop of leading stocks hitting new highs, but leadership has been very thin.
Chart courtesy of www.stockcharts.com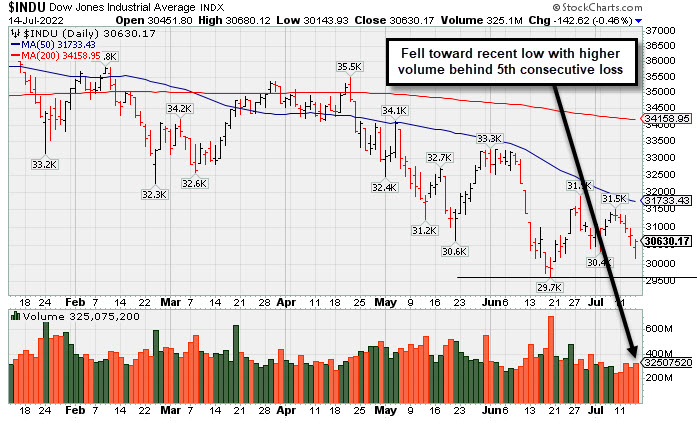 PICTURED: The Dow Jones Industrial Average fell toward the recent low with higher volume behind its 5th consecutive loss.
U.S. stocks finished mostly lower Thursday, though the major averages recovered from their worst levels as investors recalibrated their expectations for the trajectory of the Federal Reserve’s (Fed) monetary policy tightening. Treasuries fluctuated, with the yield on the 10-year note up five basis points (0.05%) to 2.96%. Meanwhile, the two-year note yield held steady at 3.13%. Notably, the gap between the two yields is the most negative since 2000.
Another update on inflation reinforced expectations for an aggressive rate hike at the Fed’s upcoming July 26-27 policy meeting. The Producer Price Index (PPI) climbed 1.1% in June, surpassing expectations and also rising from the prior 0.9% increase. However the 8.2% annual advance in core PPI (ex-food and energy) was the smallest since November. Market participants also weighed separate comments from Fed Governor Waller and St. Louis Fed President Bullard (voter) who both reiterated calls for a 75 basis point (0.75%) interest rate increase in July. Market pricing for a 100 basis point (1.00%) rate hike in July fell from a nearly 90% probability to around 40% on the heels of their comments.
Meanwhile, earnings from some of Wall Street’s biggest banks weighed on sentiment. JPMorgan Chase & Co. (JPM -3.49%) slid after its profit and revenue fell below estimates. The bank said it would pause its share buybacks and noted an increase in its reserves for bad loans amid a high level of economic uncertainty. Elsewhere, Morgan Stanley (MS -0.39%) fell after reporting disappointing results.
|
 Kenneth J. Gruneisen started out as a licensed stockbroker in August 1987, a couple of months prior to the historic stock market crash that took the Dow Jones Industrial Average down -22.6% in a single day. He has published daily fact-based fundamental and technical analysis on high-ranked stocks online for two decades. Through FACTBASEDINVESTING.COM, Kenneth provides educational articles, news, market commentary, and other information regarding proven investment systems that work in good times and bad.
Comments contained in the body of this report are technical opinions only and are not necessarily those of Gruneisen Growth Corp. The material herein has been obtained from sources believed to be reliable and accurate, however, its accuracy and completeness cannot be guaranteed. Our firm, employees, and customers may effect transactions, including transactions contrary to any recommendation herein, or have positions in the securities mentioned herein or options with respect thereto. Any recommendation contained in this report may not be suitable for all investors and it is not to be deemed an offer or solicitation on our part with respect to the purchase or sale of any securities. |
|
 |
Commodity-Linked Groups and Financial Indexes Led Pullback
Kenneth J. Gruneisen - Passed the CAN SLIM® Master's Exam
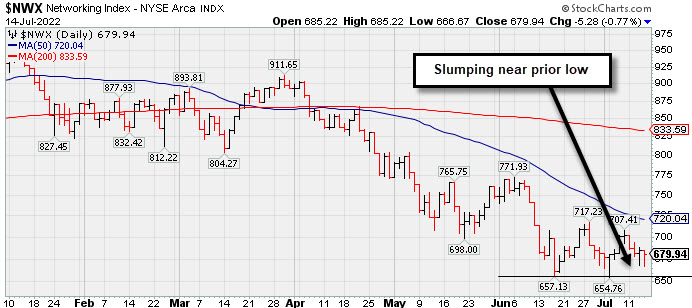
Financial shares had a negative bias as the Bank Index ($BKX -2.01%) and Broker/Dealer Index ($XBD -1.48%) both lost ground, weighing on the major averages. Commodity-linked groups had a negative bias as the Gold & Silver Index ($XAU -4.46%), Oil Services Index ($OSX -3.62%), and Integrated Oil Index ($XOI -2.49%) suffered unanimous losses. The tech sector was mixed as the Semiconductor Index ($SOX +1.92%) posted a solid gain, meanwhile the Networking Index ($NWX -0.77%) edged lower and the Biotech Index ($BTK -1.82%) slumped for a larger loss. The Retail Index ($RLX +0.29%) eked out a small gain.
PICTURED: The Networking Index ($NWX -0.77%) has been below its 50-day moving average (line) since April and remains sputtering near the prior lows.
| Oil Services |
$OSX |
57.60 |
-2.16 |
-3.62% |
+9.25% |
| Integrated Oil |
$XOI |
1,369.28 |
-35.02 |
-2.49% |
+16.22% |
| Semiconductor |
$SOX |
2,626.92 |
+49.55 |
+1.92% |
-33.43% |
| Networking |
$NWX |
679.94 |
-5.28 |
-0.77% |
-29.98% |
| Broker/Dealer |
$XBD |
384.02 |
-5.75 |
-1.48% |
-21.12% |
| Retail |
$RLX |
2,966.49 |
+8.44 |
+0.29% |
-29.81% |
| Gold & Silver |
$XAU |
103.44 |
-4.83 |
-4.46% |
-21.91% |
| Bank |
$BKX |
98.36 |
-2.02 |
-2.01% |
-25.61% |
| Biotech |
$BTK |
4,686.37 |
-87.05 |
-1.82% |
-15.08% |
|
|
|
 |
Featured Stocks
Kenneth J. Gruneisen - Passed the CAN SLIM® Master's Exam
|
|
|
Color Codes Explained :
Y - Better candidates highlighted by our
staff of experts.
G - Previously featured
in past reports as yellow but may no longer be buyable under the
guidelines.
***Last / Change / Volume data in this table is the closing quote data***
Symbol/Exchange
Company Name
Industry Group |
PRICE |
CHANGE
(%Change) |
Day High |
Volume
(% DAV)
(% 50 day avg vol) |
52 Wk Hi
% From Hi |
Featured
Date |
Price
Featured |
Pivot Featured |
|
Max Buy |
 LLY
-
NYSE
LLY
-
NYSE
Eli Lilly & Co
Medical-Diversified
|
$326.89
|
+4.43
1.37% |
$327.76
|
1,885,699
62.75% of 50 DAV
50 DAV is 3,005,000
|
$334.52
-2.28%
|
5/16/2022
|
$302.46
|
PP = $314.10
|
|
MB = $329.81
|
 Most Recent Note - 7/14/2022 4:02:10 PM
Y - Managed a "positive reversal" today while quietly consolidating, holding its ground with light volume totals in recent weeks. Its 50 DMA line ($306.85) defines near-term support above prior lows.
>>> FEATURED STOCK ARTICLE : Lilly Quietly Wedged to a New All-Time High This Week - 7/8/2022 |
View all notes |
Set NEW NOTE alert |
Company Profile |
SEC
News |
Chart |
Request a new note
C
A
S
I |
IMXI
-
NASDAQ
International Money Exp
Financial Svcs-Specialty
|
$21.34
|
-0.57
-2.60% |
$21.74
|
343,488
84.60% of 50 DAV
50 DAV is 406,000
|
$22.94
-6.97%
|
7/1/2022
|
$21.27
|
PP = $21.38
|
|
MB = $22.45
|
Most Recent Note - 7/14/2022 3:54:07 PM
Y - Encountered distributional pressure near the 52-week high. Its 50 DMA line ($20.29) defines important near-term support to watch. Fundamentals through the Mar '22 quarter have been strong.
>>> FEATURED STOCK ARTICLE : Volume Heavy While Rallying from Double Bottom Base - 7/1/2022 |
View all notes |
Set NEW NOTE alert |
Company Profile |
SEC
News |
Chart |
Request a new note
C
A
S
I |
HRMY
-
NASDAQ
Harmony Biosciences Hldg
Medical-Biomed/Biotech
|
$52.97
|
-0.96
-1.78% |
$54.06
|
346,484
65.13% of 50 DAV
50 DAV is 532,000
|
$57.13
-7.28%
|
7/6/2022
|
$54.12
|
PP = $52.85
|
|
MB = $55.49
|
Most Recent Note - 7/14/2022 3:52:04 PM
Y - Pulled back with lighter volume behind today's 5th consecutive loss as consolidates near its high after triggering a technical buy signal. Prior highs in the $52-54 area define initial support to watch on pullbacks. Reported strong sales revenues and earnings increases in quarterly comparisons through Mar '22 versus the year ago periods. Annual earnings history is limited. Completed its $24 IPO on 8/19/20.
>>> FEATURED STOCK ARTICLE : Volume-Driven Breakout For Biotech Firm - 7/6/2022 |
View all notes |
Set NEW NOTE alert |
Company Profile |
SEC
News |
Chart |
Request a new note
C
A
S
I |
CI
-
NYSE
Cigna Corp
Medical-Managed Care
|
$264.91
|
-8.84
-3.23% |
$266.82
|
2,223,798
116.00% of 50 DAV
50 DAV is 1,917,000
|
$282.33
-6.17%
|
7/7/2022
|
$276.55
|
PP = $273.68
|
|
MB = $287.36
|
Most Recent Note - 7/14/2022 3:50:59 PM
Y - Gapped down today undercutting prior highs in the $273 area raising concerns, retreating from its all-time high hit this week. Finished in the upper half of its intra-day range after testing support near its 50 DMA line ($261.9). More damaging losses would raise greater concerns.
>>> FEATURED STOCK ARTICLE : Volume-Driven Breakout for Cigna Corp - 7/7/2022 |
View all notes |
Set NEW NOTE alert |
Company Profile |
SEC
News |
Chart |
Request a new note
C
A
S
I |
|
|
|
THESE ARE NOT BUY RECOMMENDATIONS!
Comments contained in the body of this report are technical
opinions only. The material herein has been obtained
from sources believed to be reliable and accurate, however,
its accuracy and completeness cannot be guaranteed.
This site is not an investment advisor, hence it does
not endorse or recommend any securities or other investments.
Any recommendation contained in this report may not
be suitable for all investors and it is not to be deemed
an offer or solicitation on our part with respect to
the purchase or sale of any securities. All trademarks,
service marks and trade names appearing in this report
are the property of their respective owners, and are
likewise used for identification purposes only.
This report is a service available
only to active Paid Premium Members.
You may opt-out of receiving report notifications
at any time. Questions or comments may be submitted
by writing to Premium Membership Services 665 S.E. 10 Street, Suite 201 Deerfield Beach, FL 33441-5634 or by calling 1-800-965-8307
or 954-785-1121.
|
|
|