You are not logged in.
This means you
CAN ONLY VIEW reports that were published prior to Monday, April 14, 2025.
You
MUST UPGRADE YOUR MEMBERSHIP if you want to see any current reports.
AFTER MARKET UPDATE - THURSDAY, JULY 14TH, 2011
Previous After Market Report Next After Market Report >>>
|
|
|
|
DOW |
-54.49 |
12,437.12 |
-0.44% |
|
Volume |
925,212,220 |
+5% |
|
Volume |
1,888,948,730 |
+3% |
|
NASDAQ |
-34.25 |
2,762.67 |
-1.22% |
|
Advancers |
680 |
22% |
|
Advancers |
596 |
22% |
|
S&P 500 |
-8.85 |
1,308.87 |
-0.67% |
|
Decliners |
2,312 |
74% |
|
Decliners |
1,981 |
74% |
|
Russell 2000 |
-13.66 |
823.32 |
-1.63% |
|
52 Wk Highs |
46 |
|
|
52 Wk Highs |
56 |
|
|
S&P 600 |
-7.38 |
443.35 |
-1.64% |
|
52 Wk Lows |
45 |
|
|
52 Wk Lows |
35 |
|
|
 |
Major Averages Erased Early Gains and Closed Lower With More Volume
Kenneth J. Gruneisen - Passed the CAN SLIM® Master's Exam
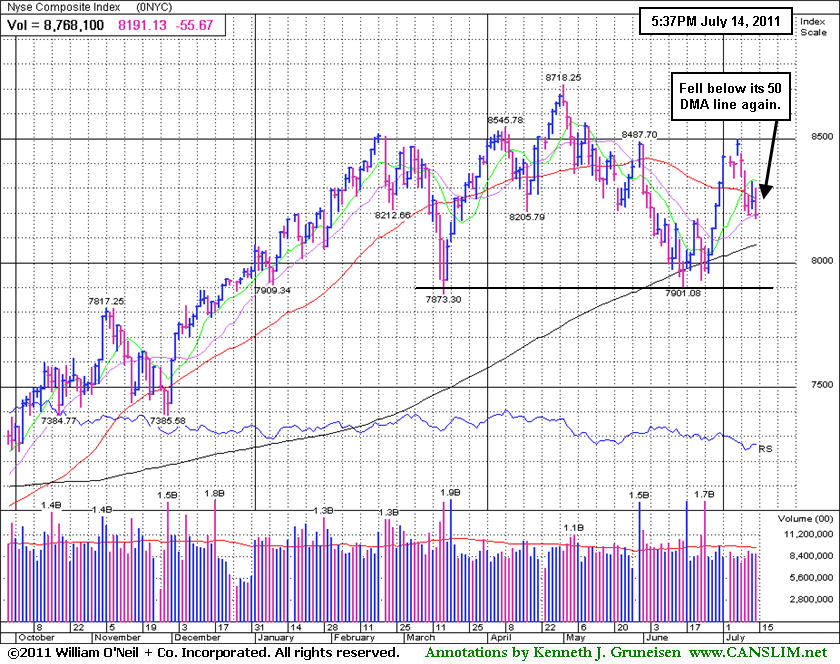
The stock market started with early gains but again its gains faded, and ultimately the Dow Jones Industrial Average, S&P 500 Index, and Nasdaq Composite Index finished with losses on Thursday. There were slightly higher volume totals reported on the NYSE and on the Nasdaq exchange, which indicated a pick-up in institutional selling. Decliners led advancers by more than a 3-1 ratio on the NYSE and on the Nasdaq exchange. New 52-week highs narrowly outnumbered new 52-week lows on the NYSE and on the Nasdaq exchange. There were 22 high-ranked companies from the CANSLIM.net Leaders List that made new 52-week highs and appeared on the CANSLIM.net BreakOuts Page, down from the total of 42 on the prior session. There were only 2 gainers out of the 17 high-ranked leaders currently included on the Featured Stocks Page.
Failure to reach agreement on the nation's debt limit has been dampening enthusiasm for stocks. President Obama may invite Congressional leaders to a Camp David summit after Moody's Corp (MCO -0.90%) said the U.S. may lose its Triple-A credit rating. Federal Reserve Chairman Ben Bernanke told lawmakers the central bank is not prepared "at this point" to take action to stimulate the economy. The comment was considered by some as a signal that markets did not correctly interpret Bernanke's remark on Wednesday that the Fed was prepared to act if necessary.
New data on jobs and retail sales were only mildly positive. Initial jobless claims declined more than expected in the latest week, but continue to signal a depressed jobs market. June retail sales unexpectedly increased, but the gain was only +0.1% compared to the previous month.
The market’s early rally was triggered by JP Morgan Chase (JPM +1.84%) after earnings beat expectations. MBIA Inc (MBIA +9.15%) rallied on a report Bank of America Corp (BAC +1.27%) made a settlement offer in a dispute over defective mortgages. ConocoPhillips (COP +1.63%) rallied on news the company plans to split into two separate businesses. Yum! Brands Inc (YUM +1.42%) rose after earnings beat forecasts. Marriott Int'l Inc (MAR -6.60%) declined after its profits missed estimates.
The S&P 500 Index sank to a close below its 50-day moving average (DMA) line while the Dow and Nasdaq stayed above their respective short-term averages. Distributional pressure has put the current rally under pressure again. Earnings news and guidance from companies may be a catalyst for additional volatility in the coming weeks as earnings announcements roll in. Our July 2011 issue of CANSLIM.net News is due to be released soon with a comprehensive summary of current market conditions that further clarifies matters concerning the M criteria! The Q2 2011 CANSLIM.net Webcast is available "ON DEMAND" now to UPGRADED MEMBERS ONLY - (CLICK HERE).
PICTURED: The NYSE Composite Index slumped below its 50 DMA line again.
|
 Kenneth J. Gruneisen started out as a licensed stockbroker in August 1987, a couple of months prior to the historic stock market crash that took the Dow Jones Industrial Average down -22.6% in a single day. He has published daily fact-based fundamental and technical analysis on high-ranked stocks online for two decades. Through FACTBASEDINVESTING.COM, Kenneth provides educational articles, news, market commentary, and other information regarding proven investment systems that work in good times and bad.
Comments contained in the body of this report are technical opinions only and are not necessarily those of Gruneisen Growth Corp. The material herein has been obtained from sources believed to be reliable and accurate, however, its accuracy and completeness cannot be guaranteed. Our firm, employees, and customers may effect transactions, including transactions contrary to any recommendation herein, or have positions in the securities mentioned herein or options with respect thereto. Any recommendation contained in this report may not be suitable for all investors and it is not to be deemed an offer or solicitation on our part with respect to the purchase or sale of any securities. |
|
 |
Tech, Financial, Retail, Defensive, and Energy Groups Falling
Kenneth J. Gruneisen - Passed the CAN SLIM® Master's Exam
The tech sector was hit hardest on Thursday as the Networking Index ($NWX -2.06%), Internet Index ($IIX -1.81%), Semiconductor Index ($SOX -1.55%), and Biotechnology Index ($BTK -0.63%) finished unanimously lower. The Retail Index ($RLX -0.94%) fell, and weakness in financial shares also had a negative influence on the market averages as the Broker/Dealer Index ($XBD -1.40%) and Bank Index ($BKX -1.23%) continued to deteriorate, hurting the broader market outlook. Defensive groups offered no reward for safe haven investors for the session either, as the Gold & Silver Index ($XAU -0.73%) and Healthcare Index ($HMO -0.47%) finished with modest losses. Weakness in energy-related shares also led to a loss for the Oil Services Index ($OSX -1.27%) and a smaller loss for the Integrated Oil Index ($XOI -0.15%).
Charts courtesy www.stockcharts.com
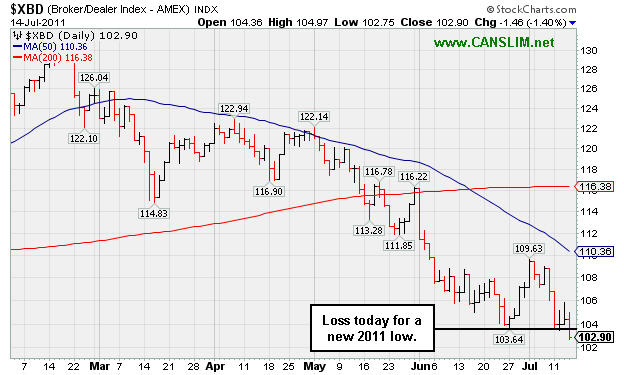
PICTURED 1: The Broker/Dealer Index ($XBD -1.40%) sank to a new 2011 low.
Charts courtesy www.stockcharts.com
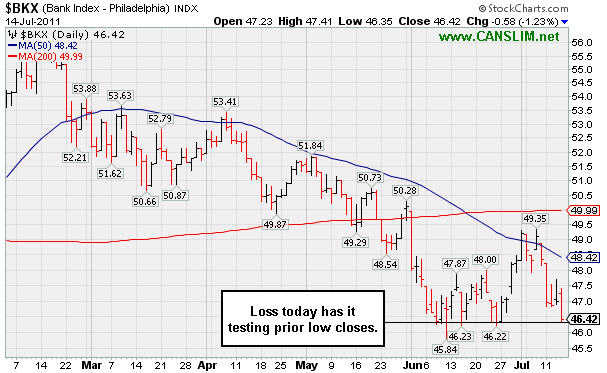
PICTURED 2: The Bank Index ($BKX -1.23%) continued to deteriorate, closing very near its prior low closes. Regular readers of this report know the financial groups' deterioration has been an ominous "leading indicator" hurting the broader market outlook in recent months. Historically, the major averages are prone to their worst downdrafts when financial groups are struggling.
| Oil Services |
$OSX |
263.49 |
-3.38 |
-1.27% |
+7.49% |
| Healthcare |
$HMO |
2,446.88 |
-11.44 |
-0.47% |
+44.62% |
| Integrated Oil |
$XOI |
1,288.98 |
-1.87 |
-0.15% |
+6.25% |
| Semiconductor |
$SOX |
387.76 |
-6.11 |
-1.55% |
-5.84% |
| Networking |
$NWX |
285.82 |
-6.01 |
-2.06% |
+1.88% |
| Internet |
$IIX |
307.48 |
-5.67 |
-1.81% |
-0.08% |
| Broker/Dealer |
$XBD |
102.90 |
-1.46 |
-1.40% |
-15.32% |
| Retail |
$RLX |
541.15 |
-5.16 |
-0.94% |
+6.45% |
| Gold & Silver |
$XAU |
214.28 |
-1.57 |
-0.73% |
-5.43% |
| Bank |
$BKX |
46.42 |
-0.58 |
-1.23% |
-11.09% |
| Biotech |
$BTK |
1,435.78 |
-9.09 |
-0.63% |
+10.65% |
|
|
|
 |
Quietly Pulling Back, But Extended From Any Sound Base
Kenneth J. Gruneisen - Passed the CAN SLIM® Master's Exam
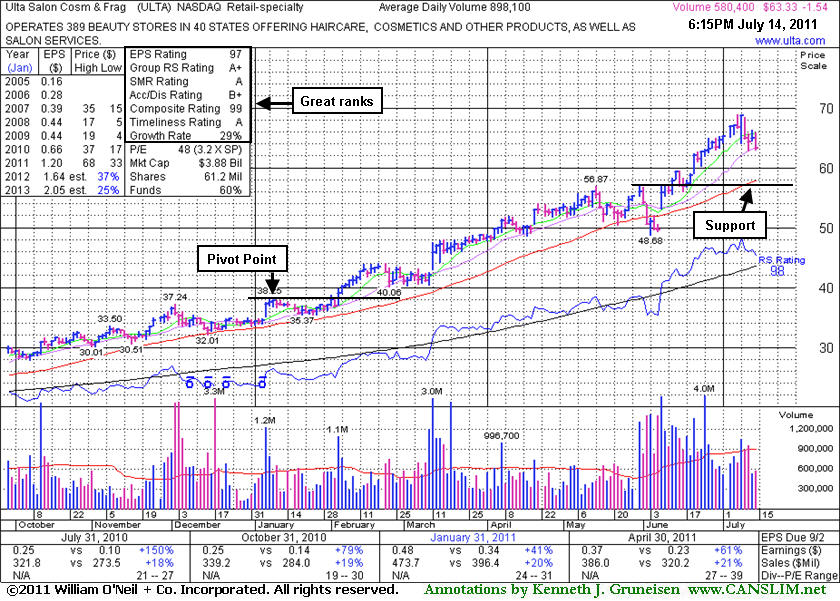
Ulta Salon Cosmetics & Fragrance, Inc. (ULTA -$1.54 or -2.37% to $63.33) is quietly pulling back from its all-time high this week. It is extended from any sound base pattern and well above its 50-day moving average (DMA) line. Any subsequent violation would raise more serious concerns and trigger more worrisome sell signals. Meanwhile, it may produce more climactic gains, but disciplined investors avoid chasing extended stocks. Since its last appearance in this FSU section on 6/20/11 with analysis and an annotated graph under the headline, "Following Choppy Consolidation New Base Not Yet Formed", it stubbornly held its ground and rallied to new all-time highs.
Prior reports noted - "Disciplined investors may watch for another sound base to possibly be formed and noted." It has been repeatedly noted as extended from any sound base, having steadily climbed, hardly pausing for any sufficient new base to form since its breakout early this year cleared the last pivot point cited. Since first featured in yellow in the 3/12/10 mid-day report at $22.81 and (read here) and in a more detailed Stock Bulletin later that afternoon under the headline "Strong Earnings Increases Help Leader Meet Key Criteria", in just over 16 months it has traded up as much as +200%. The number of top-rated funds with an ownership interest has grown from 274 funds in Mar '10 to 475 funds as of Mar '11 which is an encouraging sign of increasing institutional interest (the I criteria). Management's 25% ownership stake (after the latest offering) still keeps the company's directors very motivated to look after and build shareholder value. Its strong quarterly earnings increases above the +25% guideline in the 7 latest comparisons satisfies the C criteria, and its solid annual earnings (A criteria) history is also very reassuring.
|
|
|
Color Codes Explained :
Y - Better candidates highlighted by our
staff of experts.
G - Previously featured
in past reports as yellow but may no longer be buyable under the
guidelines.
***Last / Change / Volume data in this table is the closing quote data***
Symbol/Exchange
Company Name
Industry Group |
PRICE |
CHANGE
(%Change) |
Day High |
Volume
(% DAV)
(% 50 day avg vol) |
52 Wk Hi
% From Hi |
Featured
Date |
Price
Featured |
Pivot Featured |
|
Max Buy |
CACC
-
NASDAQ
Credit Acceptance Corp
FINANCIAL SERVICES - Credit Services
|
$82.88
|
-0.65
-0.78% |
$84.13
|
16,865
40.06% of 50 DAV
50 DAV is 42,100
|
$86.87
-4.59%
|
6/2/2011
|
$76.10
|
PP = $82.39
|
|
MB = $86.51
|
Most Recent Note - 7/13/2011 8:51:50 PM
Y - Quietly consolidating after its 6/30/11 technical breakout, holding its ground above its pivot point, and it is not extended beyond its "max buy" level. Prior highs in the $80-82 area define initial support to watch on pullbacks.
>>> The latest Featured Stock Update with an annotated graph appeared on 6/27/2011. Click here.
View all notes |
Alert me of new notes |
CANSLIM.net Company Profile |
SEC |
Zacks Reports |
StockTalk |
News |
Chart |
Request a new note
C
A N
S L
I M


|
CMG
-
NYSE
Chipotle Mexican Grill
LEISURE - Restaurants
|
$324.63
|
-0.55
-0.17% |
$329.69
|
830,349
104.68% of 50 DAV
50 DAV is 793,200
|
$329.80
-1.57%
|
4/1/2011
|
$274.00
|
PP = $275.10
|
|
MB = $288.86
|
Most Recent Note - 7/13/2011 8:52:48 PM
G - Up today with slightly above average volume. Extended from prior highs and an upward trendline that define chart support to watch.
>>> The latest Featured Stock Update with an annotated graph appeared on 7/8/2011. Click here.
View all notes |
Alert me of new notes |
CANSLIM.net Company Profile |
SEC |
Zacks Reports |
StockTalk |
News |
Chart |
Request a new note
C
A N
S L
I M
|
EW
-
NYSE
Edwards Lifesciences Cp
HEALTH SERVICES - Medical Appliances and Equipment
|
$89.95
|
-0.41
-0.45% |
$90.90
|
466,909
62.36% of 50 DAV
50 DAV is 748,700
|
$91.82
-2.04%
|
7/6/2011
|
$89.19
|
PP = $90.48
|
|
MB = $95.00
|
Most Recent Note - 7/13/2011 8:53:23 PM
Y - This high-ranked Medical - Products firm is still quietly perched within close striking distance of its 52-week and all-time highs. Disciplined investors will watch first for volume-driven gains and a strong close above its pivot point to trigger a proper technical buy signal.
>>> The latest Featured Stock Update with an annotated graph appeared on 7/7/2011. Click here.
View all notes |
Alert me of new notes |
CANSLIM.net Company Profile |
SEC |
Zacks Reports |
StockTalk |
News |
Chart |
Request a new note
C
A N
S L
I M
|
EZPW
-
NASDAQ
Ezcorp Inc Cl A
SPECIALTY RETAIL - Specialty Retail, Other
|
$36.55
|
-1.28
-3.38% |
$38.50
|
483,750
122.72% of 50 DAV
50 DAV is 394,200
|
$38.66
-5.46%
|
6/13/2011
|
$31.18
|
PP = $33.41
|
|
MB = $35.08
|
 Most Recent Note - 7/14/2011 12:52:56 PM
G - Reversed into the red after a small gap up today. It is very extended from prior highs in the $33 area that define support to watch on pullbacks.
>>> The latest Featured Stock Update with an annotated graph appeared on 7/5/2011. Click here.
View all notes |
Alert me of new notes |
CANSLIM.net Company Profile |
SEC |
Zacks Reports |
StockTalk |
News |
Chart |
Request a new note
C
A N
S L
I M
|
FCFS
-
NASDAQ
First Cash Financial Svs
SPECIALTY RETAIL - Specialty Retail, Other
|
$42.41
|
-0.21
-0.49% |
$43.36
|
148,069
79.44% of 50 DAV
50 DAV is 186,400
|
$44.84
-5.42%
|
5/31/2011
|
$42.00
|
PP = $40.23
|
|
MB = $42.24
|
Most Recent Note - 7/13/2011 8:46:31 PM
G - Consolidating -5% off its all-time high today, slightly extended from its prior base. Prior highs in the $40-42 area define initial support areas to watch.
>>> The latest Featured Stock Update with an annotated graph appeared on 6/22/2011. Click here.
View all notes |
Alert me of new notes |
CANSLIM.net Company Profile |
SEC |
Zacks Reports |
StockTalk |
News |
Chart |
Request a new note
C
A N
S L
I M
|
Symbol/Exchange
Company Name
Industry Group |
PRICE |
CHANGE
(%Change) |
Day High |
Volume
(% DAV)
(% 50 day avg vol) |
52 Wk Hi
% From Hi |
Featured
Date |
Price
Featured |
Pivot Featured |
|
Max Buy |
FOSL
-
NASDAQ
Fossil Inc
CONSUMER DURABLES - Recreational Goods, Other
|
$128.03
|
-0.55
-0.43% |
$130.46
|
1,125,500
144.68% of 50 DAV
50 DAV is 777,900
|
$129.82
-1.38%
|
2/1/2011
|
$73.30
|
PP = $74.44
|
|
MB = $78.16
|
Most Recent Note - 7/14/2011 12:54:56 PM
G - Perched at its all-time high after 4 consecutive volume-driven gains. It is extended from prior highs in the $107 area that now define initial support to watch near its 50 DMA line.
>>> The latest Featured Stock Update with an annotated graph appeared on 6/28/2011. Click here.
View all notes |
Alert me of new notes |
CANSLIM.net Company Profile |
SEC |
Zacks Reports |
StockTalk |
News |
Chart |
Request a new note
C
A N
S L
I M
|
HS
-
NYSE
Healthspring Inc
HEALTH SERVICES - Health Care Plans
|
$46.48
|
-0.49
-1.04% |
$47.83
|
749,025
87.89% of 50 DAV
50 DAV is 852,200
|
$48.95
-5.05%
|
6/16/2011
|
$42.44
|
PP = $45.21
|
|
MB = $47.47
|
Most Recent Note - 7/13/2011 8:49:04 PM
Y - Still quietly consolidating under its "max buy" level while prior resistance near $45 defines support to watch.
>>> The latest Featured Stock Update with an annotated graph appeared on 7/11/2011. Click here.
View all notes |
Alert me of new notes |
CANSLIM.net Company Profile |
SEC |
Zacks Reports |
StockTalk |
News |
Chart |
Request a new note
C
A N
S L
I M
|
INFA
-
NASDAQ
Informatica Corp
COMPUTER SOFTWARE and SERVICES - Business Software and Services
|
$56.39
|
-1.35
-2.34% |
$58.10
|
1,570,954
129.86% of 50 DAV
50 DAV is 1,209,700
|
$62.42
-9.66%
|
7/1/2011
|
$59.36
|
PP = $60.08
|
|
MB = $63.08
|
Most Recent Note - 7/14/2011 3:43:38 PM
Y - Volume is running at a slightly above average behind today's 6th consecutive loss, slumping near its 50 DMA line that defines important chart support. This high-ranked Computer Software - Database firm faces little resistance due to overhead supply, however disciplined investors would wait for a volume-driven breakout to trigger a new (or add-on) technical buy signal.
>>> The latest Featured Stock Update with an annotated graph appeared on 7/12/2011. Click here.
View all notes |
Alert me of new notes |
CANSLIM.net Company Profile |
SEC |
Zacks Reports |
StockTalk |
News |
Chart |
Request a new note
C
A N
S L
I M
|
LULU
-
NASDAQ
Lululemon Athletica
MANUFACTURING - Textile Manufacturing
|
$59.74
|
-0.90
-1.48% |
$62.19
|
3,925,977
93.93% of 50 DAV
50 DAV is 4,179,700
|
$62.86
-4.96%
|
6/21/2011
|
$102.95
|
PP = $101.14
|
|
MB = $106.20
|
Most Recent Note - 7/14/2011 4:17:14 PM
G - Do not be confused by the 2:1 split impacting its share price effective 7/12/11 while perched near its all-time high. Its rally of better than +20% in less than 3 weeks after its recent technical breakout argues for investors to follow the investment system rule of holding stocks with such powerful early gains for 8 weeks minimum.
>>> The latest Featured Stock Update with an annotated graph appeared on 6/21/2011. Click here.
View all notes |
Alert me of new notes |
CANSLIM.net Company Profile |
SEC |
Zacks Reports |
StockTalk |
News |
Chart |
Request a new note
C
A N
S L
I M
|
MWIV
-
NASDAQ
M W I Veterinary Supply
HEALTH SERVICES - Medical Instruments and; Supplies
|
$82.94
|
-1.65
-1.95% |
$85.16
|
54,359
78.67% of 50 DAV
50 DAV is 69,100
|
$86.99
-4.66%
|
7/11/2011
|
$83.39
|
PP = $84.67
|
|
MB = $88.90
|
Most Recent Note - 7/14/2011 4:09:57 PM
Y - Down today on higher but below average volume, pulling back after a new high close on the prior session. Color code was changed to yellow with new pivot point cited based on its 5/20/11 high plus 10 cents. Volume-driven gains are needed to confirm a proper technical buy signal.
>>> The latest Featured Stock Update with an annotated graph appeared on 6/30/2011. Click here.
View all notes |
Alert me of new notes |
CANSLIM.net Company Profile |
SEC |
Zacks Reports |
StockTalk |
News |
Chart |
Request a new note
C
A N
S L
I M
|
Symbol/Exchange
Company Name
Industry Group |
PRICE |
CHANGE
(%Change) |
Day High |
Volume
(% DAV)
(% 50 day avg vol) |
52 Wk Hi
% From Hi |
Featured
Date |
Price
Featured |
Pivot Featured |
|
Max Buy |
OPNT
-
NASDAQ
Opnet Technologies
INTERNET - Internet Software and Services
|
$39.36
|
-0.19
-0.48% |
$40.19
|
149,139
119.69% of 50 DAV
50 DAV is 124,600
|
$42.51
-7.41%
|
6/28/2011
|
$40.87
|
PP = $42.61
|
|
MB = $44.74
|
Most Recent Note - 7/14/2011 3:47:47 PM
G - Still sputtering today perched just above its 50 DMA line. Its color code was changed to green after mild distributional damage, and disciplined investors should note that it did not trigger a confirming technical buy signal after its new pivot point was recently cited. Recent lows near $36 define important near-term chart support.
>>> The latest Featured Stock Update with an annotated graph appeared on 7/1/2011. Click here.
View all notes |
Alert me of new notes |
CANSLIM.net Company Profile |
SEC |
Zacks Reports |
StockTalk |
News |
Chart |
Request a new note
C
A N
S L
I M
|
OTEX
-
NASDAQ
Open Text Corp
INTERNET - Internet Software and Services
|
$68.67
|
-0.55
-0.79% |
$72.32
|
802,412
287.60% of 50 DAV
50 DAV is 279,000
|
$69.67
-1.44%
|
6/1/2011
|
$65.86
|
PP = $67.18
|
|
MB = $70.54
|
Most Recent Note - 7/14/2011 1:27:09 PM
Y - It has reversed into the red today from earlier highs above its "max buy" level after a gap up. The 7/13/11 gain with volume +187% above average confirmed a technical buy signal.
>>> The latest Featured Stock Update with an annotated graph appeared on 6/24/2011. Click here.
View all notes |
Alert me of new notes |
CANSLIM.net Company Profile |
SEC |
Zacks Reports |
StockTalk |
News |
Chart |
Request a new note
C
A N
S L
I M
|
PRGO
-
NASDAQ
Perrigo Co
DRUGS - Drug Related Products
|
$92.63
|
+0.50
0.54% |
$93.50
|
572,123
112.60% of 50 DAV
50 DAV is 508,100
|
$93.70
-1.14%
|
7/13/2011
|
$92.89
|
PP = $92.40
|
|
MB = $97.02
|
Most Recent Note - 7/13/2011 9:37:59 PM
Y - Hit a new 52-week high today after a small gap up, rising from an orderly saucer shaped 11-week base with a shorter than 1-week handle. Color code was changed to yellow with new pivot point cited based on its 52-week high plus 10 cents. A strong volume-driven gain and close above its pivot may trigger a technical buy signal, however it is considered a riskier late-stage setup. See the latest FSU analysis for more details and a new annotated graph.
>>> The latest Featured Stock Update with an annotated graph appeared on 7/13/2011. Click here.
View all notes |
Alert me of new notes |
CANSLIM.net Company Profile |
SEC |
Zacks Reports |
StockTalk |
News |
Chart |
Request a new note
C
A N
S L
I M
|
QSII
-
NASDAQ
Quality Systems Inc
COMPUTER SOFTWARE and SERVICES - Healthcare Information Service
|
$87.47
|
-1.02
-1.15% |
$89.46
|
113,220
48.86% of 50 DAV
50 DAV is 231,700
|
$92.38
-5.32%
|
7/6/2011
|
$91.26
|
PP = $91.67
|
|
MB = $96.25
|
Most Recent Note - 7/13/2011 8:56:28 PM
Y - Pulled back with below average volume for a 3rd consecutive loss today. It touched a new all-time high last week and has formed cup-with-handle base. A volume-driven gain above its pivot point is still needed to trigger a new technical buy signal.
>>> The latest Featured Stock Update with an annotated graph appeared on 7/6/2011. Click here.
View all notes |
Alert me of new notes |
CANSLIM.net Company Profile |
SEC |
Zacks Reports |
StockTalk |
News |
Chart |
Request a new note
C
A N
S L
I M
|
SWI
-
NYSE
Solarwinds Inc
COMPUTER SOFTWARE and SERVICES - Application Software
|
$23.85
|
-0.68
-2.77% |
$24.56
|
1,341,476
154.16% of 50 DAV
50 DAV is 870,200
|
$26.68
-10.61%
|
6/7/2011
|
$24.22
|
PP = $25.05
|
|
MB = $26.30
|
Most Recent Note - 7/14/2011 3:40:11 PM
G - Color code is changed to green after a more damaging loss today with heavier volume, its 5th consecutive loss, leading to a violation of its 50 DMA line triggering a technical sell signal.
>>> The latest Featured Stock Update with an annotated graph appeared on 6/29/2011. Click here.
View all notes |
Alert me of new notes |
CANSLIM.net Company Profile |
SEC |
Zacks Reports |
StockTalk |
News |
Chart |
Request a new note
C
A N
S L
I M
|
Symbol/Exchange
Company Name
Industry Group |
PRICE |
CHANGE
(%Change) |
Day High |
Volume
(% DAV)
(% 50 day avg vol) |
52 Wk Hi
% From Hi |
Featured
Date |
Price
Featured |
Pivot Featured |
|
Max Buy |
ULTA
-
NASDAQ
Ulta Salon Cosm & Frag
SPECIALTY RETAIL - Specialty Retail, Other
|
$63.33
|
-1.54
-2.37% |
$65.79
|
591,595
65.87% of 50 DAV
50 DAV is 898,100
|
$68.80
-7.95%
|
1/6/2011
|
$36.12
|
PP = $37.34
|
|
MB = $39.21
|
Most Recent Note - 7/14/2011 3:41:22 PM
G - Quietly pulling back from its all-time high this week. It is extended from any sound base pattern and well above its 50 DMA line. It may produce more climactic gains, but disciplined investors avoid chasing extended stocks.
>>> The latest Featured Stock Update with an annotated graph appeared on 7/14/2011. Click here.
View all notes |
Alert me of new notes |
CANSLIM.net Company Profile |
SEC |
Zacks Reports |
StockTalk |
News |
Chart |
Request a new note
C
A N
S L
I M
|
ZAGG
-
NASDAQ
Zagg Inc
SPECIALTY RETAIL - Specialty Retail, Other
|
$14.43
|
+0.07
0.49% |
$14.87
|
2,472,606
109.50% of 50 DAV
50 DAV is 2,258,100
|
$15.85
-8.96%
|
6/1/2011
|
$10.92
|
PP = $10.59
|
|
MB = $11.12
|
Most Recent Note - 7/13/2011 11:13:25 AM
G - Gapped up today following an analyst initiating coverage. Its 50 DMA line and prior highs define support. It is now in the 7th week since its powerful breakout, and after tallying gains greater than +20% in the first 2-3 weeks it argues for investors to follow the investment system rule of holding stocks with such powerful early gains for 8 weeks minimum unless there is a bad technical breakdown.
>>> The latest Featured Stock Update with an annotated graph appeared on 6/23/2011. Click here.
View all notes |
Alert me of new notes |
CANSLIM.net Company Profile |
SEC |
Zacks Reports |
StockTalk |
News |
Chart |
Request a new note
C
A N
S L
I M
|
|
|
|
THESE ARE NOT BUY RECOMMENDATIONS!
Comments contained in the body of this report are technical
opinions only. The material herein has been obtained
from sources believed to be reliable and accurate, however,
its accuracy and completeness cannot be guaranteed.
This site is not an investment advisor, hence it does
not endorse or recommend any securities or other investments.
Any recommendation contained in this report may not
be suitable for all investors and it is not to be deemed
an offer or solicitation on our part with respect to
the purchase or sale of any securities. All trademarks,
service marks and trade names appearing in this report
are the property of their respective owners, and are
likewise used for identification purposes only.
This report is a service available
only to active Paid Premium Members.
You may opt-out of receiving report notifications
at any time. Questions or comments may be submitted
by writing to Premium Membership Services 665 S.E. 10 Street, Suite 201 Deerfield Beach, FL 33441-5634 or by calling 1-800-965-8307
or 954-785-1121.
|
|
|

