You are not logged in.
This means you
CAN ONLY VIEW reports that were published prior to Monday, April 14, 2025.
You
MUST UPGRADE YOUR MEMBERSHIP if you want to see any current reports.
AFTER MARKET UPDATE - TUESDAY, JULY 14TH, 2009
Previous After Market Report Next After Market Report >>>
|
|
|
|
DOW |
+27.81 |
8,359.49 |
+0.33% |
|
Volume |
978,833,720 |
-18% |
|
Volume |
1,916,265,670 |
-2% |
|
NASDAQ |
+6.52 |
1,799.73 |
+0.36% |
|
Advancers |
2,128 |
68% |
|
Advancers |
1,525 |
54% |
|
S&P 500 |
+4.79 |
905.84 |
+0.53% |
|
Decliners |
885 |
28% |
|
Decliners |
1,141 |
40% |
|
Russell 2000 |
+3.21 |
496.52 |
+0.65% |
|
52 Wk Highs |
31 |
|
|
52 Wk Highs |
20 |
|
|
S&P 600 |
+1.85 |
265.12 |
+0.70% |
|
52 Wk Lows |
5 |
|
|
52 Wk Lows |
10 |
|
|
 |
Indices' Latest Gains Backed By Below Average Volume
Kenneth J. Gruneisen - Passed the CAN SLIM® Master's Exam
The market averages posted small gains on Tuesday with lighter volume totals in comparison to the prior session totals on the NYSE and on the Nasdaq exchange. An expansion in volume would reveal greater conviction from the institutional crowd, however the recent volume totals have been below average and quite typical of the Summer doldrums. Advancers led decliners by more than 2-to-1 on the NYSE, while on the Nasdaq exchange advancers only led by a 5-to-4 ratio. There were 12 high-ranked companies from the CANSLIM.net Leaders List that made a new 52-week high and appeared on the CANSLIM.net BreakOuts Page, doubling the 6 issues that appeared on the prior session.
Goldman Sachs (GS +0.15%) reported earnings of $4.93 per share for the second quarter, excluding a one-time preferred dividend, beating the Street consensus. The results were based upon improvements in the firm's fixed income, currency, and commodities segments, which generated record quarterly net revenues, and the trading and principal investments segment, which saw net revenue nearly double year-over-year. Many question the sustainability of earnings from its trading and investments division.
A mixed batch of economic data gave the market little catalyst to rally. May business inventories fell a sharper-than-expected -1.0% in what was the ninth straight decline. Retail sales for June increased +0.6%, which was more than expected, helped by higher gasoline and auto purchases. Meanwhile, the June Producer Price Index increased +1.8%, which was twice the expected increase and marked the sharpest jump since late 2007. Core PPI also increased. The latest consumer price data is due Wednesday morning.
House Democrats proposed a bill to expand health benefits in a plan that includes a public health plan option to compete against private insurers. The technical outlook is far from favorable for the healthcare group despite its inherent upside due to demographics (a huge wave of aging baby boomers), as government price and wage controls could limit the earnings potential of many healthcare firms.
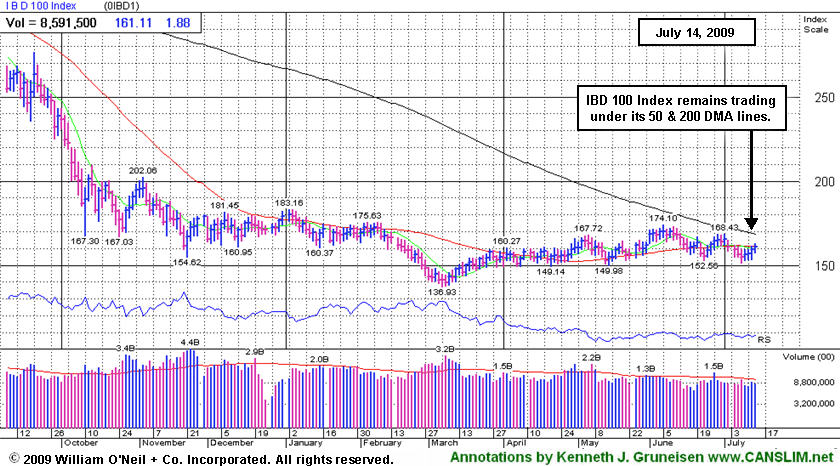
PICTURED: The IBD 100 Index's lack of progress in recent month illustrates the action in the market's highest-ranked companies. Technically, gains above its 50 & 200-day moving average (DMA) lines eventually might be a welcome sign of improvement that bodes well, and a much-needed expansion in leadership would be a critical component.
|
 Kenneth J. Gruneisen started out as a licensed stockbroker in August 1987, a couple of months prior to the historic stock market crash that took the Dow Jones Industrial Average down -22.6% in a single day. He has published daily fact-based fundamental and technical analysis on high-ranked stocks online for two decades. Through FACTBASEDINVESTING.COM, Kenneth provides educational articles, news, market commentary, and other information regarding proven investment systems that work in good times and bad.
Comments contained in the body of this report are technical opinions only and are not necessarily those of Gruneisen Growth Corp. The material herein has been obtained from sources believed to be reliable and accurate, however, its accuracy and completeness cannot be guaranteed. Our firm, employees, and customers may effect transactions, including transactions contrary to any recommendation herein, or have positions in the securities mentioned herein or options with respect thereto. Any recommendation contained in this report may not be suitable for all investors and it is not to be deemed an offer or solicitation on our part with respect to the purchase or sale of any securities. |
|
 |
Commodity-Linked Groups Among Best Gainers Today
Kenneth J. Gruneisen - Passed the CAN SLIM® Master's Exam
Commodity-linked areas were among Tuesday's best gainers as the Gold & Silver Index ($XAU +1.99%), Oil Services Index ($OSX +1.79%) and Integrated Oil Index ($XOI +0.98%) posted gains. The major averages were also given a boost by the Retail Index ($RLX +1.58%) and gains from the Semiconductor Index ($SOX +1.63%) and Internet Index ($IIX +0.99%), meanwhile the Networking Index ($NWX +0.08%) ended virtually flat. Financial shares were mixed as there was a modest gain from the Broker/Dealer Index ($XBD +0.64%) while the Bank Index ($BKX -0.30%) edged lower following the prior session's big gains. The Healthcare Index ($HMO -1.95%) and Biotechnology Index ($BTK -0.60%) were laggards.
Charts courtesy www.stockcharts.com
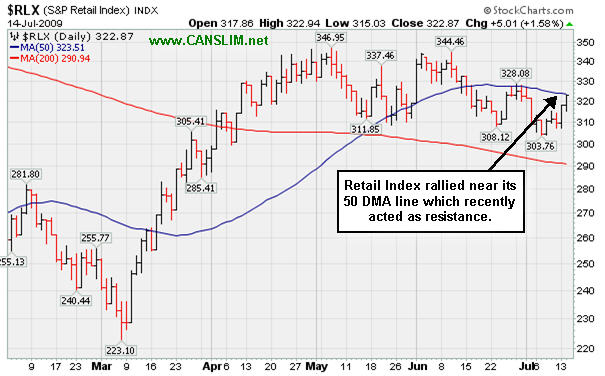
PICTURED: The Retail Index rallied near its 50-day moving average line which recently acted as resistance.
| Oil Services |
$OSX |
154.97 |
+2.72 |
+1.79% |
+27.66% |
| Healthcare |
$HMO |
1,059.11 |
-21.09 |
-1.95% |
+10.30% |
| Integrated Oil |
$XOI |
880.56 |
+8.51 |
+0.98% |
-10.12% |
| Semiconductor |
$SOX |
269.61 |
+4.32 |
+1.63% |
+27.07% |
| Networking |
$NWX |
177.28 |
+0.14 |
+0.08% |
+23.21% |
| Internet |
$IIX |
184.29 |
+1.80 |
+0.99% |
+37.77% |
| Broker/Dealer |
$XBD |
96.99 |
+0.62 |
+0.64% |
+25.20% |
| Retail |
$RLX |
322.87 |
+5.01 |
+1.58% |
+15.62% |
| Gold & Silver |
$XAU |
134.88 |
+2.63 |
+1.99% |
+8.91% |
| Bank |
$BKX |
36.41 |
-0.11 |
-0.30% |
-17.85% |
| Biotech |
$BTK |
649.95 |
-3.91 |
-0.60% |
+0.43% |
|
|
|
 |
Consolidating Above Important Support At Prior Highs and 50 DMA Line
Kenneth J. Gruneisen - Passed the CAN SLIM® Master's Exam
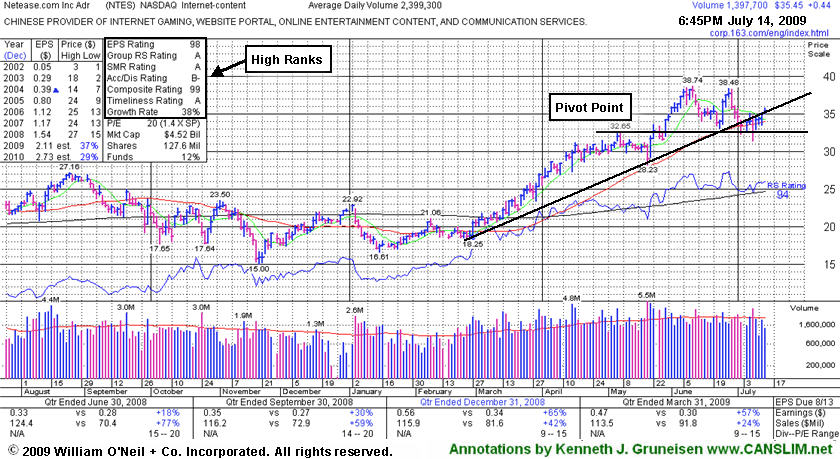
Netease.com Inc (NTES +$0.44 or +1.26% to $35.45) rose on light volume as it posted a fourth consecutive gain, closing above its 50-day moving average (DMA) line. It was recently noted after a worrisome violation of a multi-month upward trendline occurred, and noted again when its considerable loss on 7/08/09 with above average volume led to a close below its 50 DMA line and triggered a technical sell signal. It found support in the neighborhood of prior chart highs near $32 which are an important technical support level to watch along with its 50 DMA line. It negated all gains since its 5/28/09 gap up and considerable gain with +79% above average volume confirmed its last sound technical buy signal as it rose from a second-stage base. This high-ranked leader may need to spend more time consolidating before a sound new base such as a "double bottom" pattern might form and offer another ideal entry point. Meanwhile, deterioration leading it below recent lows and closing back in its previous base would raise more serious concerns and trigger additional technical sell signals.
The number of top-rated funds owning an interest in its shares increased from 18 in June '08 to 67 in March '09, which is very reassuring news in respect to the I criteria. NTES was first featured at $26.75 in the 3/31/09 CANSLIM.net Mid-Day Breakouts Report (read here). This high-ranked Chinese Internet - Content firm was also summarized in greater detail including an annotated graph in the April 2009 issue of CANSLIM.net News (read here).
|
|
|
Color Codes Explained :
Y - Better candidates highlighted by our
staff of experts.
G - Previously featured
in past reports as yellow but may no longer be buyable under the
guidelines.
***Last / Change / Volume quote data in this table corresponds with the timestamp on the note***
Symbol/Exchange
Company Name
Industry Group |
Last |
Chg. |
Vol
% DAV |
Date Featured |
Price Featured |
Latest Pivot Point
Featured |
Status |
| Latest Max Buy Price |
CPLA
- NASDAQ
Capella Education Co
DIVERSIFIED SERVICES - Education and Training Services
|
$58.58
|
N/A
|
N/A
N/A
|
7/9/2009
(Date
Featured) |
$59.69
(Price
Featured) |
PP = $62.06 |
G |
| MB = $65.16 |
Most Recent Note - 7/14/2009 2:35:07 PM
G - Small gap down and loss today on light volume. A positive reversal on 7/13/09 was a sign of impressive institutional support after initially gapping down following an analyst downgrade. It had negatively reversed for a loss on the prior 2 sessions after it was featured in yellow in the 7/09/09 Mid-Day BreakOuts Report (read here). Color code was changed to green based on weak action. The group has shown some leadership, yet currently has a D- for a Relative Strength Rating. CPLA is a high-ranked leader in the Commercial Services-Schools Group. Its small supply of only 13.9 million shares in the float could contribute to greater price volatility in the event of institutional accumulation or distribution. The number of top-rated funds owning an interest rose from 91 in Sept '08, to 129 as of March '09, which is reassuring with respect to the I criteria. It has a very good earnings history that satisfies the C & A criteria, while recent quarters showed steady sales revenues increases in the +17-18% range.
>>> The latest Featured Stock Update with an annotated graph appeared on 7/9/2009. click here.
|
|
C
A
S
I |
News |
Chart |
SEC
View all notes Alert
me of new notes
Company
Profile
|
GMCR
- NASDAQ
Green Mtn Coffee Roastrs
FOOD & BEVERAGE - Processed & Packaged Goods
|
$58.55
|
N/A
|
N/A
N/A
|
1/1/2008
(Date
Featured) |
$27.13
(Price
Featured) |
PP = $28.66 |
G |
| MB = $30.09 |
Most Recent Note - 7/14/2009 7:32:13 PM
G - Rose today with average volume lifting it from its 50 DMA line after an intra-day breach on the prior session. Its short-term average is a very important support level to watch above its recent chart low ($51.65), where violations would raise concerns and trigger technical sell signals. On 6/09/09 it reached a new all-time high with a gain on light volume as a 3:2 stock split took effect. GMCR traded up more than +144% since appearing with an annotated graph under the headline "It May Soon Be Time To Go Green" when featured in the January 2009 CANSLIM.net News (read here).
>>> The latest Featured Stock Update with an annotated graph appeared on 7/6/2009. click here.
|
|
C
A
S
I |
News |
Chart |
SEC
View all notes Alert
me of new notes
Company
Profile
|
HMSY
- NASDAQ
H M S Holdings Corp
COMPUTER SOFTWARE & SERVICES - Healthcare Information Service
|
$40.50
|
N/A
|
N/A
N/A
|
2/20/2009
(Date
Featured) |
$34.08
(Price
Featured) |
PP = $38.38 |
G |
| MB = $40.30 |
Most Recent Note - 7/14/2009 7:34:03 PM
G - Today was its 3rd consecutive small gain on light volume since it recently tested prior highs in the $38 area which are a very important initial support level above its 50 DMA line. Last week it sank under an upward trendline connecting its April-June lows. A gap up gain on 6/16/09 with heavy volume triggered a technical buy signal. No overhead supply is left to hinder the progress for this Commercial Services - Healthcare firm.
>>> The latest Featured Stock Update with an annotated graph appeared on 7/13/2009. click here.
|
|
C
A
S
I |
News |
Chart |
SEC
View all notes Alert
me of new notes
Company
Profile
|
NTES
- NASDAQ
Netease Inc Adr
INTERNET - Internet Information Providers
|
$35.45
|
N/A
|
N/A
N/A
|
5/21/2009
(Date
Featured) |
$31.19
(Price
Featured) |
PP = $32.75 |
G |
| MB = $34.39 |
Most Recent Note - 7/14/2009 7:37:39 PM
G - Today's light volume gain was its 4th consecutive gain and close above its 50 DMA line after a considerable loss on 7/08/09 with above average volume triggered a technical sell signal. Prior chart highs near $32 are an important technical support level to watch now. First featured at $26.75 in the 3/31/09 CANSLIM.net Mid-Day Breakouts Report (read here). This high-ranked Chinese Internet - Content firm was also summarized in greater detail including an annotated graph in the April 2009 issue of CANSLIM.net News (read here).
>>> The latest Featured Stock Update with an annotated graph appeared on 7/14/2009. click here.
|
|
C
A
S
I |
News |
Chart |
SEC
View all notes Alert
me of new notes
Company
Profile
|
NVEC
- NASDAQ
N V E Corp
ELECTRONICS - Semiconductor - Specialized
|
$44.53
|
N/A
|
N/A
N/A
|
3/13/2009
(Date
Featured) |
$33.85
(Price
Featured) |
PP = $45.50 |
G |
| MB = $47.78 |
Most Recent Note - 7/14/2009 7:40:06 PM
G - Recently found support near its 50 DMA line and prior highs - important support to watch, where violations would raise concerns and trigger technical sell signals. Color code was changed to green based deterioration after its 6/19/09 breakout from an "ascending base" type pattern was completely negated. Sales increases in recent comparisons have been under the +25% guideline and still rather minuscule, leaving concerns, especially in the event of any hiccups. This is a reason to be especially disciplined about proper entries and exits.
>>> The latest Featured Stock Update with an annotated graph appeared on 7/8/2009. click here.
|
|
C
A
S
I |
News |
Chart |
SEC
View all notes Alert
me of new notes
Company
Profile
|
SNDA
-
|
$52.05
|
N/A
|
N/A
N/A
|
5/31/2009
(Date
Featured) |
$57.62
(Price
Featured) |
PP = $53.95 |
G |
| MB = $56.65 |
Most Recent Note - 7/14/2009 7:41:15 PM
G - Slumped under its 50 DMA line recently, and concerns increase the longer it trades below that short-term average. Meanwhile, subsequent deterioration below its recent chart low near $50 could raise more serious concerns and trigger a worrisome technical sell signal. Detailed analysis was included when recently featured in the June 2009 issue of CANSLIM.net News. Be sure to review the "What to Look Out For" section and entire detailed summary - read here).
>>> The latest Featured Stock Update with an annotated graph appeared on 7/2/2009. click here.
|
|
C
A
S
I |
News |
Chart |
SEC
View all notes Alert
me of new notes
Company
Profile
|
SYNA
- NASDAQ
Synaptics Inc
COMPUTER SOFTWARE & SERVICES - Information Technology Service
|
$32.51
|
N/A
|
N/A
N/A
|
5/18/2009
(Date
Featured) |
$32.58
(Price
Featured) |
PP = $34.52 |
G |
| MB = $36.25 |
Most Recent Note - 7/14/2009 7:43:47 PM
G - Considerable loss today on heavy volume indicates more distributional pressure, raising more concerns. A 50 DMA line violation on 7/08/09 triggered a technical sell signal. For its outlook to improve it would need to rally back above its 50 DMA line. First featured in yellow in the May 18, 2009 mid-day report (read here). The number of top-rated funds owning its shares rose from 123 in June '08 to 201 in March '09, which is good news concerning the I criteria. Its annual earnings (the A criteria) history showed a dowturn in 2006, leaving concerns, but it followed that up with strong growth the next 2 years. Its small supply of shares (the S criteria) outstanding could contribute to especially great volatility in the event of institutional accumulation or distribution.
>>> The latest Featured Stock Update with an annotated graph appeared on 7/10/2009. click here.
|
|
C
A
S
I |
News |
Chart |
SEC
View all notes Alert
me of new notes
Company
Profile
|
TNDM
- NASDAQ
Tandem Diabetes Care Inc
TELECOMMUNICATIONS - Wireless Communications
|
$28.35
|
N/A
|
N/A
N/A
|
3/2/2009
(Date
Featured) |
$18.89
(Price
Featured) |
PP = $29.85 |
G |
| MB = $31.34 |
Most Recent Note - 7/14/2009 7:45:32 PM
G - Today it posted a 4th consecutive small gain on very light volume and closed above its 50 DMA line. Its choppy chart offers no sound base per the investment system's guidelines. It traded up as much as +72.42% since first featured at $18.89 in the 3/02/09 Mid-Day BreakOuts Report (read here).
>>> The latest Featured Stock Update with an annotated graph appeared on 7/7/2009. click here.
|
|
C
A
S
I |
News |
Chart |
SEC
View all notes Alert
me of new notes
Company
Profile
|
|
|
|
THESE ARE NOT BUY RECOMMENDATIONS!
Comments contained in the body of this report are technical
opinions only. The material herein has been obtained
from sources believed to be reliable and accurate, however,
its accuracy and completeness cannot be guaranteed.
This site is not an investment advisor, hence it does
not endorse or recommend any securities or other investments.
Any recommendation contained in this report may not
be suitable for all investors and it is not to be deemed
an offer or solicitation on our part with respect to
the purchase or sale of any securities. All trademarks,
service marks and trade names appearing in this report
are the property of their respective owners, and are
likewise used for identification purposes only.
This report is a service available
only to active Paid Premium Members.
You may opt-out of receiving report notifications
at any time. Questions or comments may be submitted
by writing to Premium Membership Services 665 S.E. 10 Street, Suite 201 Deerfield Beach, FL 33441-5634 or by calling 1-800-965-8307
or 954-785-1121.
|
|
|

