You are not logged in.
This means you
CAN ONLY VIEW reports that were published prior to Monday, February 26, 2024.
You
MUST UPGRADE YOUR MEMBERSHIP if you want to see any current reports.
AFTER MARKET UPDATE - WEDNESDAY, JULY 13TH, 2022
Previous After Market Report Next After Market Report >>>
|
|
|
|
DOW |
-208.54 |
30,772.79 |
-0.67% |
|
Volume |
859,288,716 |
-2% |
|
Volume |
4,399,842,400 |
+2% |
|
NASDAQ |
-17.15 |
11,247.58 |
-0.15% |
|
Advancers |
1,330 |
44% |
|
Advancers |
1,975 |
47% |
|
S&P 500 |
-17.02 |
3,801.78 |
-0.45% |
|
Decliners |
1,676 |
56% |
|
Decliners |
2,248 |
53% |
|
Russell 2000 |
-2.15 |
1,726.04 |
-0.12% |
|
52 Wk Highs |
3 |
|
|
52 Wk Highs |
23 |
|
|
S&P 600 |
-3.31 |
1,123.68 |
-0.29% |
|
52 Wk Lows |
211 |
|
|
52 Wk Lows |
301 |
|
|
 |
Major Averages Fell Again While Lacking Leadership
Kenneth J. Gruneisen - Passed the CAN SLIM® Master's Exam
The S&P 500 shed 0.5%, failing to close in positive territory after recouping an earlier loss of as much as 1.6%. The Dow fell 208 points, while the Nasdaq Composite dipped 0.2%. Volume totals reported were mixed, lighter than the prior session on the NYSE and slightly higher on the Nasdaq exchange. Decliners led advancers slightly, leading by an 8-7 margin on the NYSE and by an even narrower margin on the Nasdaq exchange. There were 2 high-ranked companies from the Leaders List that hit new 52-week highs and were listed on the BreakOuts Page, versus the total of 5 on the prior session. New 52-week lows totals expanded and still outnumbered new 52-week highs on the NYSE and on the Nasdaq exchange. The brief new market uptrend is already under pressure (M criteria). Any sustainable rally requires a healthy crop of leading stocks hitting new highs, but leadership has been very thin.
Chart courtesy of www.stockcharts.com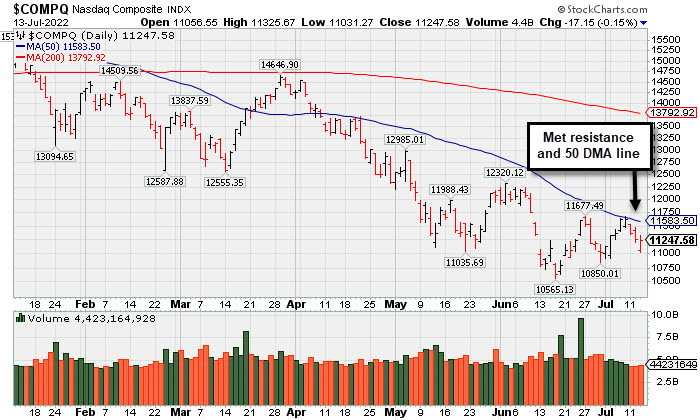 PICTURED: The Nasdaq Composite Index has been sputtering after meeting resistance at its 50-day and fell for a 3rd consecutive loss.
U.S. stocks finished lower in volatile trading Wednesday as investors weighed another hotter-than-anticipated reading on inflation. Treasuries were mixed, with the inversion in a closely watched portion of the yield curve deepening amid lingering worries over a recession. The yield on the 10-year note declined five basis points (0.05%) to 2.91%, while the two-year note yield jumped nine basis points (0.09%) to 3.13%. Notably, the gap between the two yields is the most negative since September 2000.
On the data front, the Consumer Price Index (CPI) climbed 9.1% year-over-year in June, the highest print since 1981. The reading exceeded all analyst estimates and accelerated from the prior 8.6% year-over-year clip. The headline figure jumped 1.3% on a monthly basis, topping projections and hitting a peak not seen since 2005. Core CPI (excluding food and energy) increased 0.7% month-over-month, unexpectedly accelerating. The update reinforced expectations for another 0.75% rate hike at the July 26-27 Federal Reserve policy meeting, and raised speculation of an even more aggressive 1.00% increase as officials prioritize their fight against inflation.
Nine of 11 S&P 500 sectors closed in negative territory, with Industrials leading the downturn. Delta Airlines Inc. (DAL -4.47%) fell as disappointing margins overshadowed a quarterly revenue beat. Financials also underperformed ahead of tomorrow’s earnings reports from some of Wall Street’s biggest banks. In other corporate news, Netflix Inc. (NFLX +1.21%) rose after announcing a partnership with Microsoft Corp. (MSFT -0.37%) for its advertising-supported streaming service.
|
 Kenneth J. Gruneisen started out as a licensed stockbroker in August 1987, a couple of months prior to the historic stock market crash that took the Dow Jones Industrial Average down -22.6% in a single day. He has published daily fact-based fundamental and technical analysis on high-ranked stocks online for two decades. Through FACTBASEDINVESTING.COM, Kenneth provides educational articles, news, market commentary, and other information regarding proven investment systems that work in good times and bad.
Comments contained in the body of this report are technical opinions only and are not necessarily those of Gruneisen Growth Corp. The material herein has been obtained from sources believed to be reliable and accurate, however, its accuracy and completeness cannot be guaranteed. Our firm, employees, and customers may effect transactions, including transactions contrary to any recommendation herein, or have positions in the securities mentioned herein or options with respect thereto. Any recommendation contained in this report may not be suitable for all investors and it is not to be deemed an offer or solicitation on our part with respect to the purchase or sale of any securities. |
|
 |
Tech and Gold & Silver Indexes Rose
Kenneth J. Gruneisen - Passed the CAN SLIM® Master's Exam
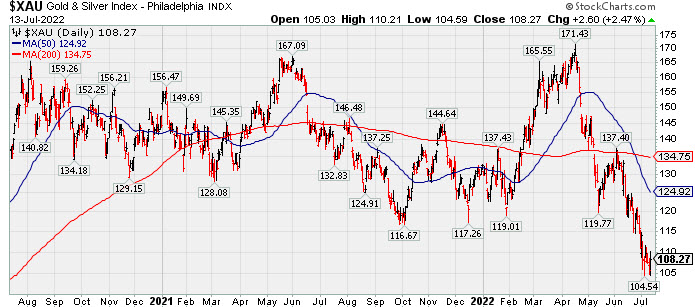
The Bank Index ($BKX -1.47%) created a drag on the major indices while the Broker/Dealer Index ($XBD -0.35%) also edged lower and the Retail Index ($RLX +0.03%) finished flat. The Semiconductor Index ($SOX +0.75%) and Networking Index ($NWX +0.49%) both posted modest gains, meanwhile the Biotech Index ($BTK -0.33%) edged lower. The Gold & Silver Index ($XAU +2.47%) posted solid gain. The Oil Services Index ($OSX -0.34%) and Integrated Oil Index ($XOI -0.08%) ended slightly lower.
PICTURED: The Gold & Silver Index ($XAU +2.47%) posted solid gain. It has been sputtering at lows after slumping as much as -39% from the April 2022 high.
| Oil Services |
$OSX |
59.76 |
-0.21 |
-0.34% |
+13.35% |
| Integrated Oil |
$XOI |
1,404.30 |
-1.10 |
-0.08% |
+19.19% |
| Semiconductor |
$SOX |
2,577.36 |
+19.19 |
+0.75% |
-34.69% |
| Networking |
$NWX |
685.22 |
+3.33 |
+0.49% |
-29.44% |
| Broker/Dealer |
$XBD |
389.77 |
-1.38 |
-0.35% |
-19.94% |
| Retail |
$RLX |
2,985.05 |
+0.83 |
+0.03% |
-29.37% |
| Gold & Silver |
$XAU |
108.27 |
+2.60 |
+2.47% |
-18.26% |
| Bank |
$BKX |
100.38 |
-1.50 |
-1.47% |
-24.08% |
| Biotech |
$BTK |
4,773.41 |
-15.69 |
-0.33% |
-13.50% |
|
|
|
 |
Featured Stocks
Kenneth J. Gruneisen - Passed the CAN SLIM® Master's Exam
|
|
|
Color Codes Explained :
Y - Better candidates highlighted by our
staff of experts.
G - Previously featured
in past reports as yellow but may no longer be buyable under the
guidelines.
***Last / Change / Volume data in this table is the closing quote data***
Symbol/Exchange
Company Name
Industry Group |
PRICE |
CHANGE
(%Change) |
Day High |
Volume
(% DAV)
(% 50 day avg vol) |
52 Wk Hi
% From Hi |
Featured
Date |
Price
Featured |
Pivot Featured |
|
Max Buy |
 LLY
-
NYSE
LLY
-
NYSE
Eli Lilly & Co
Medical-Diversified
|
$322.46
|
-1.13
-0.35% |
$324.68
|
2,543,318
83.88% of 50 DAV
50 DAV is 3,032,000
|
$334.52
-3.61%
|
5/16/2022
|
$302.46
|
PP = $314.10
|
|
MB = $329.81
|
 Most Recent Note - 7/13/2022 8:04:18 PM
Y - Quietly consolidating and holding its ground with light volume totals in recent weeks. Its 50 DMA line ($306) defines near-term support above prior lows.
>>> FEATURED STOCK ARTICLE : Lilly Quietly Wedged to a New All-Time High This Week - 7/8/2022 |
View all notes |
Set NEW NOTE alert |
Company Profile |
SEC
News |
Chart |
Request a new note
C
A
S
I |
IMXI
-
NASDAQ
International Money Exp
Financial Svcs-Specialty
|
$21.91
|
-0.10
-0.45% |
$21.96
|
843,406
209.80% of 50 DAV
50 DAV is 402,000
|
$22.94
-4.49%
|
7/1/2022
|
$21.27
|
PP = $21.38
|
|
MB = $22.45
|
Most Recent Note - 7/13/2022 8:03:14 PM
Y - Color code was changed to yellow while pulling back below its "max buy" level. Endured distributional pressure, yet it rebounded from the session's early low and ended near the high. Its 50 DMA line ($20.26) defines important near-term support to watch. Fundamentals through the Mar '22 quarter have been strong.
>>> FEATURED STOCK ARTICLE : Volume Heavy While Rallying from Double Bottom Base - 7/1/2022 |
View all notes |
Set NEW NOTE alert |
Company Profile |
SEC
News |
Chart |
Request a new note
C
A
S
I |
HRMY
-
NASDAQ
Harmony Biosciences Hldg
Medical-Biomed/Biotech
|
$53.93
|
-0.38
-0.70% |
$55.12
|
656,995
124.20% of 50 DAV
50 DAV is 529,000
|
$57.13
-5.60%
|
7/6/2022
|
$54.12
|
PP = $52.85
|
|
MB = $55.49
|
Most Recent Note - 7/13/2022 8:01:46 PM
Y - Pulled back with higher volume behind today's 4th consecutive loss as consolidates near its high after triggering a technical buy signal. Prior highs in the $52-54 area define initial support to watch on pullbacks. Reported strong sales revenues and earnings increases in quarterly comparisons through Mar '22 versus the year ago periods. Annual earnings history is limited. Completed its $24 IPO on 8/19/20.
>>> FEATURED STOCK ARTICLE : Volume-Driven Breakout For Biotech Firm - 7/6/2022 |
View all notes |
Set NEW NOTE alert |
Company Profile |
SEC
News |
Chart |
Request a new note
C
A
S
I |
CI
-
NYSE
Cigna Corp
Medical-Managed Care
|
$273.75
|
-5.60
-2.00% |
$279.52
|
1,563,355
81.68% of 50 DAV
50 DAV is 1,914,000
|
$281.91
-2.89%
|
7/7/2022
|
$276.55
|
PP = $273.68
|
|
MB = $287.36
|
Most Recent Note - 7/13/2022 8:00:05 PM
Y - Pulled back from its its all-time high with lighter volume behind today's 2nd consecutive loss. Prior highs in the $273 area define initial support to watch on pullbacks. Volume-driven gains recently triggered a technical buy signal after a rebound above its 50 DMA line ($261) helped its outlook to improve.
>>> FEATURED STOCK ARTICLE : Volume-Driven Breakout for Cigna Corp - 7/7/2022 |
View all notes |
Set NEW NOTE alert |
Company Profile |
SEC
News |
Chart |
Request a new note
C
A
S
I |
|
|
|
THESE ARE NOT BUY RECOMMENDATIONS!
Comments contained in the body of this report are technical
opinions only. The material herein has been obtained
from sources believed to be reliable and accurate, however,
its accuracy and completeness cannot be guaranteed.
This site is not an investment advisor, hence it does
not endorse or recommend any securities or other investments.
Any recommendation contained in this report may not
be suitable for all investors and it is not to be deemed
an offer or solicitation on our part with respect to
the purchase or sale of any securities. All trademarks,
service marks and trade names appearing in this report
are the property of their respective owners, and are
likewise used for identification purposes only.
This report is a service available
only to active Paid Premium Members.
You may opt-out of receiving report notifications
at any time. Questions or comments may be submitted
by writing to Premium Membership Services 665 S.E. 10 Street, Suite 201 Deerfield Beach, FL 33441-5634 or by calling 1-800-965-8307
or 954-785-1121.
|
|
|