You are not logged in.
This means you
CAN ONLY VIEW reports that were published prior to Monday, April 14, 2025.
You
MUST UPGRADE YOUR MEMBERSHIP if you want to see any current reports.
AFTER MARKET UPDATE - WEDNESDAY, JULY 13TH, 2011
Previous After Market Report Next After Market Report >>>
|
|
|
|
DOW |
+44.73 |
12,491.61 |
+0.36% |
|
Volume |
883,563,120 |
-4% |
|
Volume |
1,835,439,610 |
-6% |
|
NASDAQ |
+15.01 |
2,796.92 |
+0.54% |
|
Advancers |
1,847 |
59% |
|
Advancers |
1,812 |
68% |
|
S&P 500 |
+4.08 |
1,317.72 |
+0.31% |
|
Decliners |
1,136 |
37% |
|
Decliners |
768 |
29% |
|
Russell 2000 |
+7.21 |
836.98 |
+0.87% |
|
52 Wk Highs |
61 |
|
|
52 Wk Highs |
87 |
|
|
S&P 600 |
+3.54 |
450.73 |
+0.79% |
|
52 Wk Lows |
24 |
|
|
52 Wk Lows |
26 |
|
|
 |
Indices Rose With Lighter Volume While Early Gains Faded
Kenneth J. Gruneisen - Passed the CAN SLIM® Master's Exam
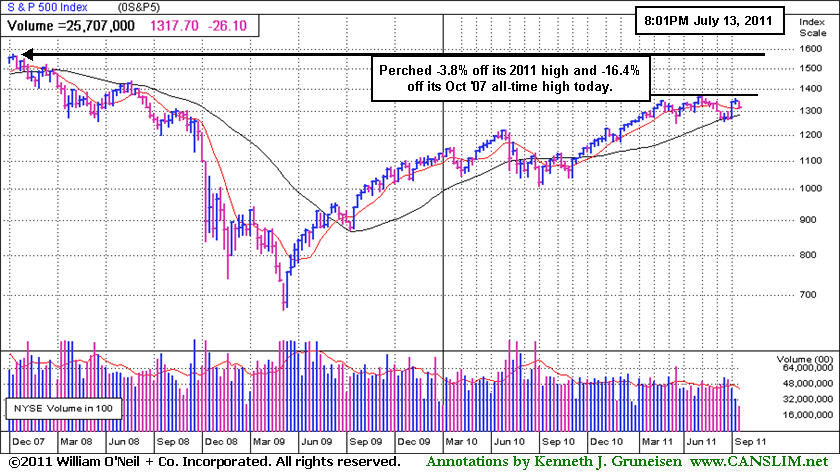
The Dow Jones Industrial Average, S&P 500 Index, and Nasdaq Composite Index broke a 3-session losing streaks after finishing with small gains on Wednesday. However, the session's early rally lost momentum and gains faded in the afternoon. The small gains were also backed by lighter volume totals on the NYSE and on the Nasdaq exchange, which indicated no pick-up in institutional buying demand. Advancing issues beat decliners by about a 3-2 ratio on the NYSE and by more than 2-1 on the Nasdaq exchange. New 52-week highs still outnumbered new 52-week lows on both the Nasdaq exchange and the NYSE. There were 42 high-ranked companies from the CANSLIM.net Leaders List that made new 52-week highs and appeared on the CANSLIM.net BreakOuts Page, up from the total of 17 on the prior session. There were 14 gainers out of the 17 high-ranked leaders currently included on the Featured Stocks Page.
After strong early gains faded, some blamed it on a continuing failure in Washington to reach an agreement on the debt ceiling. Other pundits pointed to a Fitch downgrade of Greece's credit rating. Federal Reserve Board Chairman Ben Bernanke told a House committee that the Fed is prepared to respond and open to a third round of quantitative easing if more economic stimulus is needed. Import prices declined in June for the first month this year, and Bernanke repeated his belief that inflation will not be a problem because gasoline and food prices are moderating. Meanwhile, news out of China sent a positive signal on global growth. The Chinese economy and industrial production both increased more than expected.
News Corp (NWS +1.7%) rose after the company withdrew its bid for BSkyB. Medical technology firm Kinetic Concepts (KCI +5.8%) said it will be acquired by a consortium of funds in a deal valued at $6.3 billion. Newmont Mining Corp (NEM +2.6%) rose as the price of gold hit a record settlement for the second day in a row.
Distributional pressure has put the current rally under pressure again. Earnings news and guidance from companies may be a catalyst for additional volatility in the coming weeks as earnings announcements roll in. Our July 2011 issue of CANSLIM.net News is due to be released soon with a comprehensive summary of current market conditions that further clarifies matters concerning the M criteria! The Q2 2011 CANSLIM.net Webcast is available "ON DEMAND" now to UPGRADED MEMBERS ONLY - (CLICK HERE).
PICTURED: The S&P 500 Index is now perched -3.8% off its 2011 high and -16.4% off its October 2007 all-time high.
|
 Kenneth J. Gruneisen started out as a licensed stockbroker in August 1987, a couple of months prior to the historic stock market crash that took the Dow Jones Industrial Average down -22.6% in a single day. He has published daily fact-based fundamental and technical analysis on high-ranked stocks online for two decades. Through FACTBASEDINVESTING.COM, Kenneth provides educational articles, news, market commentary, and other information regarding proven investment systems that work in good times and bad.
Comments contained in the body of this report are technical opinions only and are not necessarily those of Gruneisen Growth Corp. The material herein has been obtained from sources believed to be reliable and accurate, however, its accuracy and completeness cannot be guaranteed. Our firm, employees, and customers may effect transactions, including transactions contrary to any recommendation herein, or have positions in the securities mentioned herein or options with respect thereto. Any recommendation contained in this report may not be suitable for all investors and it is not to be deemed an offer or solicitation on our part with respect to the purchase or sale of any securities. |
|
 |
Defensive Groups Outpaced Other Gainers and a Mixed Tech Sector
Kenneth J. Gruneisen - Passed the CAN SLIM® Master's Exam
The Gold & Silver Index ($XAU +2.69%) was a standout gainer, helped by defensive posturing. The Healthcare Index ($HMO +1.08%) also rose, and strength in energy-related shares also gave the Oil Services Index ($OSX +1.30%) and Integrated Oil Index ($XOI +0.47%) a boost. Financial shares had a slightly positive bias as the Bank Index ($BKX +0.30%) and Broker/Dealer Index ($XBD +0.34%) tallied small gains, and the Retail Index ($RLX +0.44%) also helped with a moderately positive influence. The Networking Index ($NWX -0.85%) and Semiconductor Index ($SOX -0.28%) dragged on the tech sector while the Internet Index ($IIX +0.31%) and Biotechnology Index ($BTK +0.43%) posted small gains.
Charts courtesy www.stockcharts.com
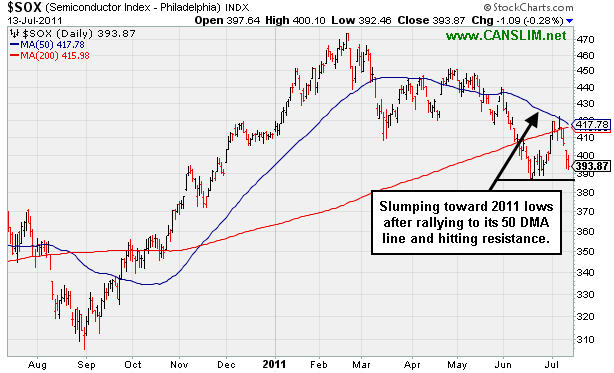
PICTURED: The Semiconductor Index ($SOX -0.28%) is slumping toward 2011 lows after rallying to its 50-day moving average (DMA) line and hitting resistance. The tech sector has usually been a key contributor in most market rallies, so further deterioration would be a worrisome sign while gains above the recent highs and 50 DMA line would be reassuring improvements.
| Oil Services |
$OSX |
266.87 |
+3.43 |
+1.30% |
+8.87% |
| Healthcare |
$HMO |
2,458.32 |
+26.26 |
+1.08% |
+45.29% |
| Integrated Oil |
$XOI |
1,290.86 |
+6.08 |
+0.47% |
+6.40% |
| Semiconductor |
$SOX |
393.87 |
-1.09 |
-0.28% |
-4.36% |
| Networking |
$NWX |
291.83 |
-2.50 |
-0.85% |
+4.02% |
| Internet |
$IIX |
313.15 |
+0.97 |
+0.31% |
+1.76% |
| Broker/Dealer |
$XBD |
104.36 |
+0.36 |
+0.34% |
-14.12% |
| Retail |
$RLX |
546.31 |
+2.38 |
+0.44% |
+7.46% |
| Gold & Silver |
$XAU |
215.85 |
+5.66 |
+2.69% |
-4.74% |
| Bank |
$BKX |
47.00 |
+0.14 |
+0.30% |
-9.98% |
| Biotech |
$BTK |
1,444.87 |
+6.24 |
+0.43% |
+11.35% |
|
|
|
 |
New Orderly Base And Better Earnings Increases
Kenneth J. Gruneisen - Passed the CAN SLIM® Master's Exam
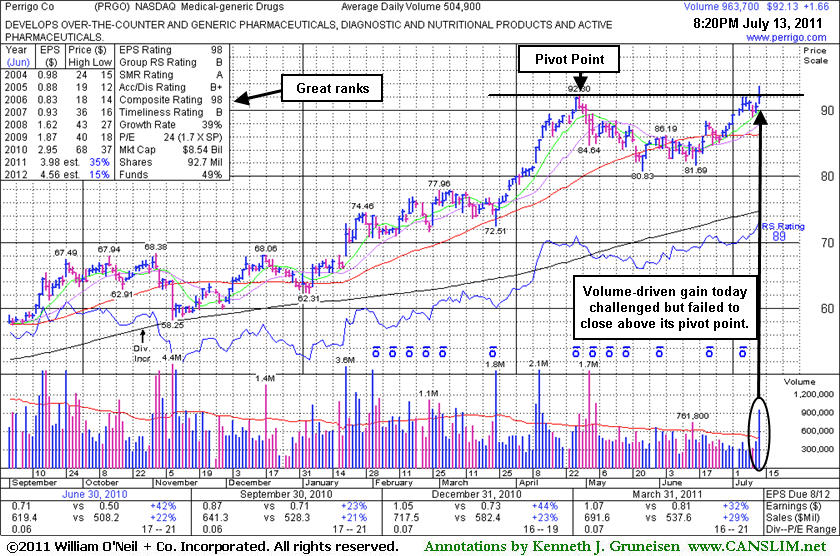
Perrigo Co (PRGO +$1.66 or +1.83% to $92.13) hit a new 52-week high today after a small gap up. While rising from an orderly saucer shaped 11-week base with a shorter than 1-week handle its color code was changed to yellow when featured in the mid-day report (read here) with new pivot point cited based on its 52-week high plus 10 cents. A strong volume-driven gain and close above its pivot may trigger a technical buy signal, however it is considered a riskier late-stage setup. It faces no resistance due to overhead supply but it did not quite finish the session high enough to clinch a convincing buy signal today, so disciplined investors may watch for additional confirming gains with heavy volume.
Following its last appearance in this FSU section with an annotated graph on 11/09/10 under the headline, "Weakening Technical And Fundamental Characteristics Raised Concerns", it was noted and dropped from the Featured Stocks list. Technically, it broke out in January and found support at its 50 DMA line during its ascent, however its Relative Strength line did not lead the way or provide confirmation and it was not highlighted following its 1/20/11 "breakaway gap" into new high territory. Following its sub par earnings increase in September there had been fundamental concerns as well. However, it improved earnings +44% on +23% sales for the quarter ended Dec 31, 2010. The March 2011 quarter also showed increases above the +25% guideline. It was noted in the 5/03/11 mid-day report - "Disciplined investors may watch for secondary buy points to possibly develop and be noted. Found support at its 50 DMA line, and made steady progress following its 1/20/11 breakaway gap'. Found support near its 200 DMA line since noted on 11/09/10 when it was dropped from the Featured Stocks list - 'Reported its smallest percentage earnings increase in 5 quarters, after +73%, +56%, +52%, +42%, in the Sept '09, Dec '09, Mar '10, and Jun '10 quarters respectively versus the year ago periods, its earnings were up just +23% for the latest quarter ended September 30, 2010.'"
 |
|
|
Color Codes Explained :
Y - Better candidates highlighted by our
staff of experts.
G - Previously featured
in past reports as yellow but may no longer be buyable under the
guidelines.
***Last / Change / Volume data in this table is the closing quote data***
Symbol/Exchange
Company Name
Industry Group |
PRICE |
CHANGE
(%Change) |
Day High |
Volume
(% DAV)
(% 50 day avg vol) |
52 Wk Hi
% From Hi |
Featured
Date |
Price
Featured |
Pivot Featured |
|
Max Buy |
CACC
-
NASDAQ
Credit Acceptance Corp
FINANCIAL SERVICES - Credit Services
|
$83.53
|
+0.90
1.09% |
$83.99
|
15,427
36.04% of 50 DAV
50 DAV is 42,800
|
$86.87
-3.84%
|
6/2/2011
|
$76.10
|
PP = $82.39
|
|
MB = $86.51
|
 Most Recent Note - 7/13/2011 8:51:50 PM
Y - Quietly consolidating after its 6/30/11 technical breakout, holding its ground above its pivot point, and it is not extended beyond its "max buy" level. Prior highs in the $80-82 area define initial support to watch on pullbacks.
>>> The latest Featured Stock Update with an annotated graph appeared on 6/27/2011. Click here.
View all notes |
Alert me of new notes |
CANSLIM.net Company Profile |
SEC |
Zacks Reports |
StockTalk |
News |
Chart |
Request a new note
C
A N
S L
I M


|
CMG
-
NYSE
Chipotle Mexican Grill
LEISURE - Restaurants
|
$325.18
|
+5.47
1.71% |
$328.28
|
931,803
117.92% of 50 DAV
50 DAV is 790,200
|
$329.80
-1.40%
|
4/1/2011
|
$274.00
|
PP = $275.10
|
|
MB = $288.86
|
Most Recent Note - 7/13/2011 8:52:48 PM
G - Up today with slightly above average volume. Extended from prior highs and an upward trendline that define chart support to watch.
>>> The latest Featured Stock Update with an annotated graph appeared on 7/8/2011. Click here.
View all notes |
Alert me of new notes |
CANSLIM.net Company Profile |
SEC |
Zacks Reports |
StockTalk |
News |
Chart |
Request a new note
C
A N
S L
I M
|
EW
-
NYSE
Edwards Lifesciences Cp
HEALTH SERVICES - Medical Appliances and Equipment
|
$90.36
|
+0.46
0.51% |
$91.27
|
552,398
72.05% of 50 DAV
50 DAV is 766,700
|
$91.82
-1.59%
|
7/6/2011
|
$89.19
|
PP = $90.48
|
|
MB = $95.00
|
Most Recent Note - 7/13/2011 8:53:23 PM
Y - This high-ranked Medical - Products firm is still quietly perched within close striking distance of its 52-week and all-time highs. Disciplined investors will watch first for volume-driven gains and a strong close above its pivot point to trigger a proper technical buy signal.
>>> The latest Featured Stock Update with an annotated graph appeared on 7/7/2011. Click here.
View all notes |
Alert me of new notes |
CANSLIM.net Company Profile |
SEC |
Zacks Reports |
StockTalk |
News |
Chart |
Request a new note
C
A N
S L
I M
|
EZPW
-
NASDAQ
Ezcorp Inc Cl A
SPECIALTY RETAIL - Specialty Retail, Other
|
$37.83
|
+1.19
3.25% |
$38.01
|
416,880
106.73% of 50 DAV
50 DAV is 390,600
|
$38.66
-2.15%
|
6/13/2011
|
$31.18
|
PP = $33.41
|
|
MB = $35.08
|
Most Recent Note - 7/13/2011 8:44:23 PM
G - Solid gain on average volume today for its second-best close ever. It is very extended from prior highs in the $33 area that define support to watch on pullbacks.
>>> The latest Featured Stock Update with an annotated graph appeared on 7/5/2011. Click here.
View all notes |
Alert me of new notes |
CANSLIM.net Company Profile |
SEC |
Zacks Reports |
StockTalk |
News |
Chart |
Request a new note
C
A N
S L
I M
|
FCFS
-
NASDAQ
First Cash Financial Svs
SPECIALTY RETAIL - Specialty Retail, Other
|
$42.62
|
+0.02
0.05% |
$42.99
|
194,476
105.29% of 50 DAV
50 DAV is 184,700
|
$44.84
-4.95%
|
5/31/2011
|
$42.00
|
PP = $40.23
|
|
MB = $42.24
|
Most Recent Note - 7/13/2011 8:46:31 PM
G - Consolidating -5% off its all-time high today, slightly extended from its prior base. Prior highs in the $40-42 area define initial support areas to watch.
>>> The latest Featured Stock Update with an annotated graph appeared on 6/22/2011. Click here.
View all notes |
Alert me of new notes |
CANSLIM.net Company Profile |
SEC |
Zacks Reports |
StockTalk |
News |
Chart |
Request a new note
C
A N
S L
I M
|
Symbol/Exchange
Company Name
Industry Group |
PRICE |
CHANGE
(%Change) |
Day High |
Volume
(% DAV)
(% 50 day avg vol) |
52 Wk Hi
% From Hi |
Featured
Date |
Price
Featured |
Pivot Featured |
|
Max Buy |
FOSL
-
NASDAQ
Fossil Inc
CONSUMER DURABLES - Recreational Goods, Other
|
$128.58
|
+3.01
2.40% |
$129.82
|
1,123,964
146.10% of 50 DAV
50 DAV is 769,300
|
$128.42
0.12%
|
2/1/2011
|
$73.30
|
PP = $74.44
|
|
MB = $78.16
|
Most Recent Note - 7/13/2011 8:47:31 PM
G - Gapped up today for another new all-time high and its 4th consecutive volume-driven gain. It is extended from prior highs in the $107 area that now define initial support to watch near its 50 DMA line.
>>> The latest Featured Stock Update with an annotated graph appeared on 6/28/2011. Click here.
View all notes |
Alert me of new notes |
CANSLIM.net Company Profile |
SEC |
Zacks Reports |
StockTalk |
News |
Chart |
Request a new note
C
A N
S L
I M
|
HS
-
NYSE
Healthspring Inc
HEALTH SERVICES - Health Care Plans
|
$46.97
|
+0.71
1.53% |
$47.67
|
759,587
84.70% of 50 DAV
50 DAV is 896,800
|
$48.95
-4.04%
|
6/16/2011
|
$42.44
|
PP = $45.21
|
|
MB = $47.47
|
Most Recent Note - 7/13/2011 8:49:04 PM
Y - Still quietly consolidating under its "max buy" level while prior resistance near $45 defines support to watch.
>>> The latest Featured Stock Update with an annotated graph appeared on 7/11/2011. Click here.
View all notes |
Alert me of new notes |
CANSLIM.net Company Profile |
SEC |
Zacks Reports |
StockTalk |
News |
Chart |
Request a new note
C
A N
S L
I M
|
INFA
-
NASDAQ
Informatica Corp
COMPUTER SOFTWARE and SERVICES - Business Software and Services
|
$57.74
|
-0.24
-0.41% |
$59.41
|
1,522,093
127.17% of 50 DAV
50 DAV is 1,196,900
|
$62.42
-7.50%
|
7/1/2011
|
$59.36
|
PP = $60.08
|
|
MB = $63.08
|
Most Recent Note - 7/13/2011 8:50:56 PM
Y - Volume was slightly above average behind today's 5th consecutive loss and it finished near the session low. This high-ranked Computer Software - Database firm faces no resistance due to overhead supply, but disciplined investors would wait for a volume-driven breakout to trigger a new (or add-on) technical buy signal.
>>> The latest Featured Stock Update with an annotated graph appeared on 7/12/2011. Click here.
View all notes |
Alert me of new notes |
CANSLIM.net Company Profile |
SEC |
Zacks Reports |
StockTalk |
News |
Chart |
Request a new note
C
A N
S L
I M
|
LULU
-
NASDAQ
Lululemon Athletica
MANUFACTURING - Textile Manufacturing
|
$60.64
|
+0.72
1.20% |
$62.86
|
4,339,577
104.80% of 50 DAV
50 DAV is 4,140,800
|
$61.92
-2.07%
|
6/21/2011
|
$102.95
|
PP = $101.14
|
|
MB = $106.20
|
Most Recent Note - 7/12/2011 10:23:24 AM
G - Do not be confused by the 2:1 split impacting its share price effective today while perched near its all-time high. Its rally of better than +20% in less than 2-3 weeks after its recent technical breakout argues for investors to follow the investment system rule of holding stocks with such powerful early gains for 8 weeks minimum.
>>> The latest Featured Stock Update with an annotated graph appeared on 6/21/2011. Click here.
View all notes |
Alert me of new notes |
CANSLIM.net Company Profile |
SEC |
Zacks Reports |
StockTalk |
News |
Chart |
Request a new note
C
A N
S L
I M
|
MWIV
-
NASDAQ
M W I Veterinary Supply
HEALTH SERVICES - Medical Instruments and; Supplies
|
$84.59
|
+0.44
0.52% |
$85.50
|
26,614
37.59% of 50 DAV
50 DAV is 70,800
|
$86.99
-2.76%
|
7/11/2011
|
$83.39
|
PP = $84.67
|
|
MB = $88.90
|
Most Recent Note - 7/11/2011 4:39:31 PM
Y - Down today on quiet volume. Perched within close striking distance of a new high close. Color code is changed to yellow with new pivot point cited based on its 5/20/11 high plus 10 cents. Volume-driven gains are needed to confirm a proper technical buy signal.
>>> The latest Featured Stock Update with an annotated graph appeared on 6/30/2011. Click here.
View all notes |
Alert me of new notes |
CANSLIM.net Company Profile |
SEC |
Zacks Reports |
StockTalk |
News |
Chart |
Request a new note
C
A N
S L
I M
|
Symbol/Exchange
Company Name
Industry Group |
PRICE |
CHANGE
(%Change) |
Day High |
Volume
(% DAV)
(% 50 day avg vol) |
52 Wk Hi
% From Hi |
Featured
Date |
Price
Featured |
Pivot Featured |
|
Max Buy |
OPNT
-
NASDAQ
Opnet Technologies
INTERNET - Internet Software and Services
|
$39.55
|
+0.73
1.88% |
$40.25
|
150,592
121.94% of 50 DAV
50 DAV is 123,500
|
$42.51
-6.96%
|
6/28/2011
|
$40.87
|
PP = $42.61
|
|
MB = $44.74
|
Most Recent Note - 7/12/2011 5:19:58 PM
G - Today's 3rd consecutive loss on below average volume led to a close near its 50 DMA line and -8.7% off its 52-week high. Color code is changed to green after mild distributional damage. Disciplined investors would note that it did not trigger a confirming technical buy signal after its new pivot point was cited. Recent lows near $36 define important near-term chart support.
>>> The latest Featured Stock Update with an annotated graph appeared on 7/1/2011. Click here.
View all notes |
Alert me of new notes |
CANSLIM.net Company Profile |
SEC |
Zacks Reports |
StockTalk |
News |
Chart |
Request a new note
C
A N
S L
I M
|
OTEX
-
NASDAQ
Open Text Corp
INTERNET - Internet Software and Services
|
$69.22
|
+3.92
6.00% |
$69.67
|
800,704
287.40% of 50 DAV
50 DAV is 278,600
|
$68.67
0.80%
|
6/1/2011
|
$65.86
|
PP = $67.18
|
|
MB = $70.54
|
Most Recent Note - 7/13/2011 10:56:41 AM
Y - Rising near its 52-week high today after announcing it has acquired Global 360 Holding Corporation, a leading provider of process and case management solutions. Volume-driven gains above the previously cited pivot point may trigger a technical buy signal.
>>> The latest Featured Stock Update with an annotated graph appeared on 6/24/2011. Click here.
View all notes |
Alert me of new notes |
CANSLIM.net Company Profile |
SEC |
Zacks Reports |
StockTalk |
News |
Chart |
Request a new note
C
A N
S L
I M
|
PRGO
-
NASDAQ
Perrigo Co
DRUGS - Drug Related Products
|
$92.13
|
+1.66
1.83% |
$93.70
|
973,114
191.52% of 50 DAV
50 DAV is 508,100
|
$92.30
-0.18%
|
7/13/2011
|
$92.89
|
PP = $92.40
|
|
MB = $97.02
|
Most Recent Note - 7/13/2011 1:08:54 PM
Y - Hit a new 52-week high today after a small gap up, rising from an orderly saucer shaped 11-week base with a shorter than 1-week handle. Color code is changed to yellow with new pivot point cited based on its 52-week high plus 10 cents. A strong volume-driven gain and close above its pivot may trigger a technical buy signal, however it is considered a riskier late-stage setup. Last noted in the 5/03/11 mid-day report - "Disciplined investors may watch for secondary buy points to possibly develop and be noted. Found support at its 50 DMA line, and made steady progress following its 1/20/11 breakaway gap'. Found support near its 200 DMA line since noted on 11/09/10 when it was dropped from the Featured Stocks list - 'Reported its smallest percentage earnings increase in 5 quarters, after +73%, +56%, +52%, +42%, in the Sept '09, Dec '09, Mar '10, and Jun '10 quarters respectively versus the year ago periods, its earnings were up just +23% for the latest quarter ended September 30, 2010.'"
>>> The latest Featured Stock Update with an annotated graph appeared on 7/13/2011. Click here.
View all notes |
Alert me of new notes |
CANSLIM.net Company Profile |
SEC |
Zacks Reports |
StockTalk |
News |
Chart |
Request a new note
C
A N
S L
I M
|
QSII
-
NASDAQ
Quality Systems Inc
COMPUTER SOFTWARE and SERVICES - Healthcare Information Service
|
$88.49
|
-0.61
-0.68% |
$90.22
|
184,825
77.01% of 50 DAV
50 DAV is 240,000
|
$92.38
-4.21%
|
7/6/2011
|
$91.26
|
PP = $91.67
|
|
MB = $96.25
|
Most Recent Note - 7/13/2011 8:56:28 PM
Y - Pulled back with below average volume for a 3rd consecutive loss today. It touched a new all-time high last week and has formed cup-with-handle base. A volume-driven gain above its pivot point is still needed to trigger a new technical buy signal.
>>> The latest Featured Stock Update with an annotated graph appeared on 7/6/2011. Click here.
View all notes |
Alert me of new notes |
CANSLIM.net Company Profile |
SEC |
Zacks Reports |
StockTalk |
News |
Chart |
Request a new note
C
A N
S L
I M
|
SWI
-
NYSE
Solarwinds Inc
COMPUTER SOFTWARE and SERVICES - Application Software
|
$24.53
|
-0.41
-1.64% |
$25.38
|
862,526
97.24% of 50 DAV
50 DAV is 887,000
|
$26.68
-8.06%
|
6/7/2011
|
$24.22
|
PP = $25.05
|
|
MB = $26.30
|
Most Recent Note - 7/13/2011 8:59:28 PM
Y - Finished near the session low today with a 4th consecutive loss on near average volume. It closed below its old high closes prior to its latest breakout, raising concerns while testing support at its 50 DMA line. More damaging losses would raise concerns and trigger technical sell signals.
>>> The latest Featured Stock Update with an annotated graph appeared on 6/29/2011. Click here.
View all notes |
Alert me of new notes |
CANSLIM.net Company Profile |
SEC |
Zacks Reports |
StockTalk |
News |
Chart |
Request a new note
C
A N
S L
I M
|
Symbol/Exchange
Company Name
Industry Group |
PRICE |
CHANGE
(%Change) |
Day High |
Volume
(% DAV)
(% 50 day avg vol) |
52 Wk Hi
% From Hi |
Featured
Date |
Price
Featured |
Pivot Featured |
|
Max Buy |
ULTA
-
NASDAQ
Ulta Salon Cosm & Frag
SPECIALTY RETAIL - Specialty Retail, Other
|
$64.87
|
+0.58
0.90% |
$66.33
|
531,891
60.28% of 50 DAV
50 DAV is 882,300
|
$68.80
-5.71%
|
1/6/2011
|
$36.12
|
PP = $37.34
|
|
MB = $39.21
|
Most Recent Note - 7/12/2011 1:24:13 PM
G - Perched near its all-time high today, extended from any sound base pattern and well above its 50 DMA line. It may produce more climactic gains, but disciplined investors avoid chasing extended stocks.
>>> The latest Featured Stock Update with an annotated graph appeared on 6/20/2011. Click here.
View all notes |
Alert me of new notes |
CANSLIM.net Company Profile |
SEC |
Zacks Reports |
StockTalk |
News |
Chart |
Request a new note
C
A N
S L
I M
|
ZAGG
-
NASDAQ
Zagg Inc
SPECIALTY RETAIL - Specialty Retail, Other
|
$14.36
|
+1.20
9.12% |
$14.50
|
4,779,480
223.54% of 50 DAV
50 DAV is 2,138,100
|
$15.85
-9.40%
|
6/1/2011
|
$10.92
|
PP = $10.59
|
|
MB = $11.12
|
Most Recent Note - 7/13/2011 11:13:25 AM
G - Gapped up today following an analyst initiating coverage. Its 50 DMA line and prior highs define support. It is now in the 7th week since its powerful breakout, and after tallying gains greater than +20% in the first 2-3 weeks it argues for investors to follow the investment system rule of holding stocks with such powerful early gains for 8 weeks minimum unless there is a bad technical breakdown.
>>> The latest Featured Stock Update with an annotated graph appeared on 6/23/2011. Click here.
View all notes |
Alert me of new notes |
CANSLIM.net Company Profile |
SEC |
Zacks Reports |
StockTalk |
News |
Chart |
Request a new note
C
A N
S L
I M
|
|
|
|
THESE ARE NOT BUY RECOMMENDATIONS!
Comments contained in the body of this report are technical
opinions only. The material herein has been obtained
from sources believed to be reliable and accurate, however,
its accuracy and completeness cannot be guaranteed.
This site is not an investment advisor, hence it does
not endorse or recommend any securities or other investments.
Any recommendation contained in this report may not
be suitable for all investors and it is not to be deemed
an offer or solicitation on our part with respect to
the purchase or sale of any securities. All trademarks,
service marks and trade names appearing in this report
are the property of their respective owners, and are
likewise used for identification purposes only.
This report is a service available
only to active Paid Premium Members.
You may opt-out of receiving report notifications
at any time. Questions or comments may be submitted
by writing to Premium Membership Services 665 S.E. 10 Street, Suite 201 Deerfield Beach, FL 33441-5634 or by calling 1-800-965-8307
or 954-785-1121.
|
|
|

