You are not logged in.
This means you
CAN ONLY VIEW reports that were published prior to Monday, April 14, 2025.
You
MUST UPGRADE YOUR MEMBERSHIP if you want to see any current reports.
AFTER MARKET UPDATE - TUESDAY, JULY 13TH, 2010
Previous After Market Report Next After Market Report >>>
|
|
|
|
DOW |
+146.75 |
10,363.02 |
+1.44% |
|
Volume |
1,130,656,520 |
+32% |
|
Volume |
2,258,945,870 |
+27% |
|
NASDAQ |
+43.67 |
2,242.03 |
+1.99% |
|
Advancers |
2,543 |
81% |
|
Advancers |
2,246 |
80% |
|
S&P 500 |
+16.59 |
1,095.34 |
+1.54% |
|
Decliners |
521 |
17% |
|
Decliners |
458 |
16% |
|
Russell 2000 |
+21.21 |
642.82 |
+3.41% |
|
52 Wk Highs |
91 |
|
|
52 Wk Highs |
34 |
|
|
S&P 600 |
+10.88 |
345.79 |
+3.25% |
|
52 Wk Lows |
6 |
|
|
52 Wk Lows |
21 |
|
|
 |
Positive Volume And Breadth Figures As Indices Make Progress
Adam Sarhan, Contributing Writer,
The major averages posted big gains on Tuesday as they rallied for a sixth consecutive session as Alcoa (AA +1.20%) and CSX (CSX -1.41%) officially kicked off earnings season and the government said the trade deficit topped $1 trillion. Volume, a critical component of institutional sponsorship, was higher on the Nasdaq and the NYSE. There were 23 high-ranked companies from the CANSLIM.net Leaders List that made a new 52-week high and appeared on the CANSLIM.net BreakOuts Page, higher than the 21 issues that appeared on the prior session. Advancers trumped decliners by over a 5-to-1 ratio on the NYSE and nearly a 5-to-1 ratio on the Nasdaq exchange. Finally, new 52-week highs outnumbered new 52-week lows on the NYSE and the Nasdaq exchange.
It was healthy to see the major averages rally after second quarter earnings season officially began. Only time will tell whether or not this rally will continue as a slew of companies report their results over the next few weeks. Both Alcoa and CSX reported solid results and raised their 2010 forecasts which helped allay concern that the economic recovery was in jeopardy, or that a double-dip recession may occur. Elsewhere, the Treasury Department said the federal deficit topped $1 trillion during the first nine months of this budget year. This was -7.6% lower than last year's total of $1.09 trillion.
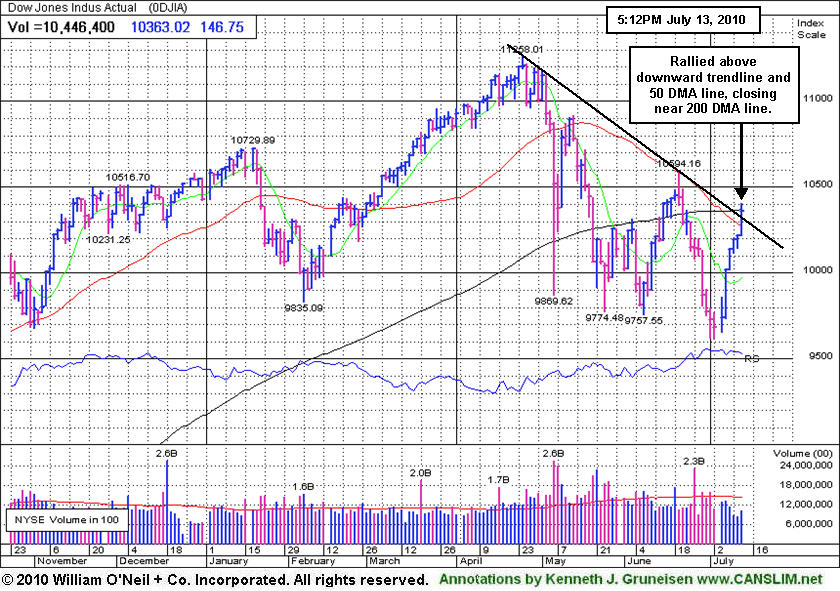
Technically, it was encouraging to see the Dow Jones Industrial Average rally above its 50-day moving average (DMA) line and rise above a downward trendline. Tuesday's gain also helped the S&P 600 Small Cap Index rally above the April - June downward trendline which was shown on the graph included in Friday evening's commentary (read here). The benchmark S&P 500 Index is now challenging its 50 DMA line, yet it faces resistance at its short-term average and it also remains trading under its 200 DMA line. The Nasdaq Composite Index has rallied very near its 50 and 200 DMA lines which have now converged. The NYSE Composite Index, which was noted in this commentary recently as the first major index to violate its 50 DMA line and the see its 50 and 200 DMA lines form a "death cross", rallied for its first close above its 50 DMA since May 3rd.
Looking forward, the window remains open for disciplined investors to carefully buy high-ranked stocks. Since the current rally began on July 1, the major averages have rallied on suspiciously light volume for the most part. It is ideal to see volume expand as the major averages break above resistance and see a new batch of high ranked leaders trigger fresh technical buy signals. These latest improvements are helping to confirm this nascent rally and provide a reassurance that odds are more favorable for successful investing using the fact-based system.
PICTURED: The Dow Jones Industrial Average rallied above its 50-day moving average (DMA) line and above a downward trendline, closing near its 200 DMA. Technically, it was encouraging to see the blue chip index making some meaningful progress.
|
|
|
 |
Financial, Tech, And Retail Indices Led Broad Group Gains
Kenneth J. Gruneisen - Passed the CAN SLIM® Master's Exam
Financial shares helped underpin Tuesday's big gains as the Bank Index ($BKX +3.03%) and Broker/Dealer Index ($XBD +2.57%) made encouraging upward progress. The Retail Index ($RLX +2.47%) and tech sector also posted solid gains as the Semiconductor Index ($SOX +2.11%), Biotechnology Index ($BTK +2.79%), and Internet Index ($IIX +2.80%) ended unanimously higher. Energy shares traded with a positive bias too as the Oil Services Index ($OSX +0.44%) and Integrated Oil Index ($XOI +1.68%) rose, and the Healthcare Index ($HMO +1.84%) also posted a solid gain. Meanwhile, the classic "safe haven" group lagged as the Gold & Silver Index ($XAU +0.17%) ended with a small gain.
Charts courtesy www.stockcharts.com
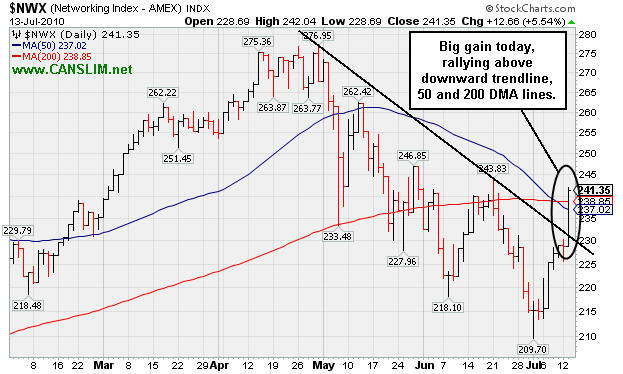
PICTURED 1: The Networking Index ($NWX +5.54%) was a standout gainer today leading the tech sector indices, rallying above a downward trendline, and above its 50-day and 200-day moving average (DMA) lines.
Charts courtesy www.stockcharts.com
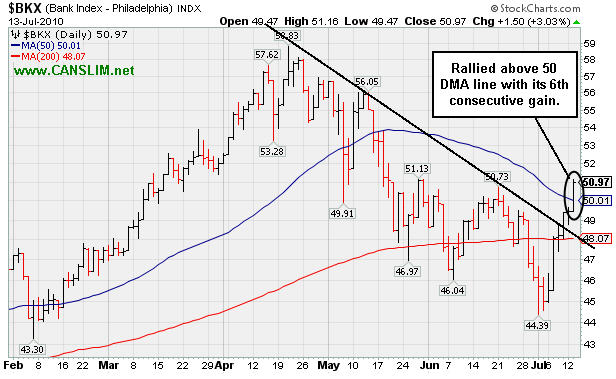
PICTURED 2: The Bank Index ($BKX +3.03%) posted a 6th consecutive gain and rallied above its 50 DMA line.
| Oil Services |
$OSX |
177.75 |
+0.78 |
+0.44% |
-8.81% |
| Healthcare |
$HMO |
1,434.43 |
+25.90 |
+1.84% |
-2.61% |
| Integrated Oil |
$XOI |
967.67 |
+16.02 |
+1.68% |
-9.41% |
| Semiconductor |
$SOX |
362.83 |
+7.50 |
+2.11% |
+0.81% |
| Networking |
$NWX |
241.37 |
+12.68 |
+5.54% |
+4.46% |
| Internet |
$IIX |
241.03 |
+6.57 |
+2.80% |
+3.06% |
| Broker/Dealer |
$XBD |
103.55 |
+2.59 |
+2.57% |
-10.00% |
| Retail |
$RLX |
404.17 |
+9.76 |
+2.47% |
-1.69% |
| Gold & Silver |
$XAU |
174.03 |
+0.30 |
+0.17% |
+3.44% |
| Bank |
$BKX |
50.97 |
+1.50 |
+3.03% |
+19.34% |
| Biotech |
$BTK |
1,048.54 |
+28.46 |
+2.79% |
+11.29% |
|
|
|
 |
China-Based Insurance Broker Completed Stock Offering After Prior Resistance Proved Stubborn
Kenneth J. Gruneisen - Passed the CAN SLIM® Master's Exam
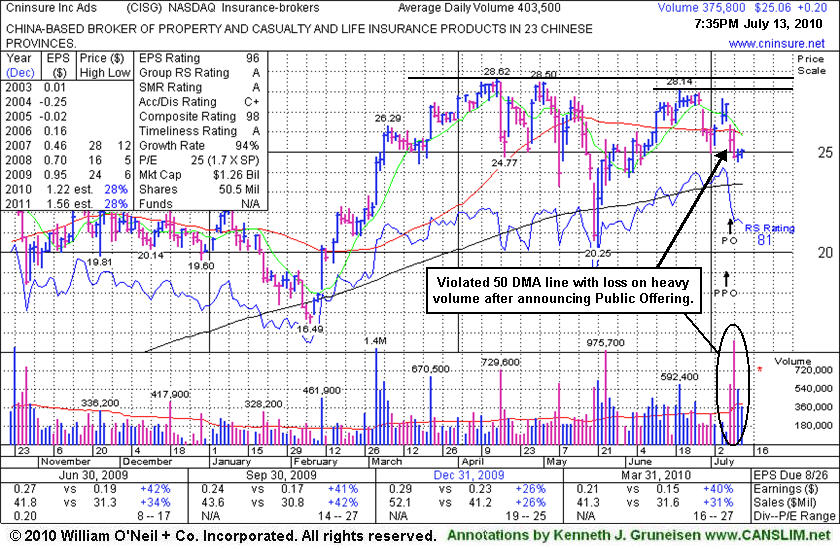
Cninsure Inc (CISG +$0.20 or +0.80% to $25.06) posted a gain with below average volume today. It is now consolidating -12.4% off its 52-week high and below its 50-day moving average (DMA) line after damaging distributional action including a gap down on 7/08/10 after announcing a Public Offering. Offerings commonly hinder the progress in issues for the short-term.
After it was featured again in yellow in the 6/16/10 mid-day report (read here) it was shown in this FSU section with an annotated graph on 6/18/10 under the headline "Strength Helps Insurance Firm Return To Featured Stocks List", however, it soon stalled after challenging prior resistance in the $28 area. It is no longer among the high-ranked stocks listed on the Featured Stocks page after being dropped from the list last evening. Gains above its 50 DMA line are needed for its outlook to improve, and technically, it would need to break out above stubborn resistance near $28 for its outlook to turn very bullish.
This China-based insurance broker has shown strong earnings and sales growth above the +25% guideline. It traded up as much as +17.4% higher after it rose from a 20-week double bottom base with 8 times average volume and was in the 3/03/10 mid-day report (read here).
|
|
|
Color Codes Explained :
Y - Better candidates highlighted by our
staff of experts.
G - Previously featured
in past reports as yellow but may no longer be buyable under the
guidelines.
***Last / Change / Volume data in this table is the closing quote data***
Symbol/Exchange
Company Name
Industry Group |
PRICE |
CHANGE
(%Change) |
Day High |
Volume
(% DAV)
(% 50 day avg vol) |
52 Wk Hi
% From Hi |
Featured
Date |
Price
Featured |
Pivot Featured |
|
Max Buy |
AAPL
-
NASDAQ
Apple Inc
COMPUTER HARDWARE - Personal Computers
|
$251.80
|
-5.49
-2.13% |
$256.40
|
42,421,147
148.48% of 50 DAV
50 DAV is 28,569,900
|
$279.01
-9.75%
|
6/17/2010
|
$270.95
|
PP = $272.56
|
|
MB = $286.19
|
 Most Recent Note - 7/13/2010 4:42:05 PM
G - Down today on heavier than average volume, slumping back below its 50 DMA line. Recent gains lacked volume after it failed to trigger a proper technical buy signal and then encountered heavy distributional pressure. Recent lows in the $242-243 area define important chart support to watch.
>>> The latest Featured Stock Update with an annotated graph appeared on 7/12/2010. Click here.
View all notes |
Alert me of new notes |
CANSLIM.net Company Profile |
SEC |
Zacks Reports |
StockTalk |
News |
Chart |
Request a new note
C
A N
S L
I M


|
ABV
-
NYSE
Comp De Bebidas Adr
FOOD and BEVERAGE - Beverages - Brewers
|
$105.57
|
+0.69
0.66% |
$106.38
|
628,523
83.93% of 50 DAV
50 DAV is 748,900
|
$109.33
-3.44%
|
6/29/2010
|
$104.74
|
PP = $109.33
|
|
MB = $114.80
|
Most Recent Note - 7/12/2010 4:35:14 PM
Y - Today's loss on light volume ended a streak of 6 consecutive gains for this Brazil-based beverage firm. It found support near its 50 DMA line recently and has not yet traded above its pivot point since featured in the 6/29/10 mid-day report (read here).
>>> The latest Featured Stock Update with an annotated graph appeared on 6/29/2010. Click here.
View all notes |
Alert me of new notes |
CANSLIM.net Company Profile |
SEC |
Zacks Reports |
StockTalk |
News |
Chart |
Request a new note
C
A N
S L
I M
|
BIDU
-
NASDAQ
Baidu Inc Ads
INTERNET - Internet Information Providers
|
$74.38
|
+3.65
5.16% |
$74.80
|
13,422,453
88.97% of 50 DAV
50 DAV is 15,085,800
|
$82.29
-9.61%
|
1/13/2010
|
$43.13
|
PP = $42.68
|
|
MB = $44.81
|
Most Recent Note - 7/13/2010 7:37:36 PM
G - Considerable gain today with near average volume helped it rise above its 50 DMA line again. Prior lows in the $66 area define important chart support.
>>> The latest Featured Stock Update with an annotated graph appeared on 6/21/2010. Click here.
View all notes |
Alert me of new notes |
CANSLIM.net Company Profile |
SEC |
Zacks Reports |
StockTalk |
News |
Chart |
Request a new note
C
A N
S L
I M
|
CRM
-
NYSE
Salesforce.Com Inc
INTERNET - Internet Software and Services
|
$93.65
|
+1.80
1.96% |
$94.28
|
1,542,408
52.42% of 50 DAV
50 DAV is 2,942,600
|
$97.94
-4.38%
|
6/2/2010
|
$88.44
|
PP = $89.60
|
|
MB = $94.08
|
Most Recent Note - 7/12/2010 5:01:57 PM
Y - Rising further above its 50 DMA line today while posting a 8th consecutive gain on ever-decreasing volume. Recent low ($83.61 on 7/01/10) defines an important chart support level to watch now.
>>> The latest Featured Stock Update with an annotated graph appeared on 6/22/2010. Click here.
View all notes |
Alert me of new notes |
CANSLIM.net Company Profile |
SEC |
Zacks Reports |
StockTalk |
News |
Chart |
Request a new note
C
A N
S L
I M
|
CVLT
-
NASDAQ
Commvault Systems Inc
COMPUTER SOFTWARE and SERVICES - Business Software and Services
|
$18.35
|
-5.12
-21.82% |
$19.00
|
7,551,588
1,271.10% of 50 DAV
50 DAV is 594,100
|
$24.51
-25.13%
|
7/6/2010
|
$23.16
|
PP = $24.45
|
|
MB = $25.67
|
Most Recent Note - 7/13/2010 10:28:22 AM
G - Gapped down today for a considerable loss after reporting weak preliminary results and analyst downgrade, violating its 50 and 200 DMA lines and 2010 lows. Based on poor technical action it will be dropped from the Featured Stocks list tonight. Disciplined investors avoid the temptation to get in "early" and can see that CVLT did not trigger a technical buy signal after it was featured in the 7/06/10 mid-day report (read here).
>>> The latest Featured Stock Update with an annotated graph appeared on 7/6/2010. Click here.
View all notes |
Alert me of new notes |
CANSLIM.net Company Profile |
SEC |
Zacks Reports |
StockTalk |
News |
Chart |
Request a new note
C
A N
S L
I M
|
Symbol/Exchange
Company Name
Industry Group |
PRICE |
CHANGE
(%Change) |
Day High |
Volume
(% DAV)
(% 50 day avg vol) |
52 Wk Hi
% From Hi |
Featured
Date |
Price
Featured |
Pivot Featured |
|
Max Buy |
DECK
-
NASDAQ
Deckers Outdoor Corp
CONSUMER NON-DURABLES - Textile - Apparel Footwear
|
$47.57
|
+1.46
3.17% |
$47.87
|
1,242,821
80.90% of 50 DAV
50 DAV is 1,536,300
|
$56.12
-15.23%
|
6/11/2010
|
$157.34
|
PP = $158.57
|
|
MB = $166.50
|
Most Recent Note - 7/13/2010 6:43:02 PM
G - Small gain today with light volume, still struggling below its 50 DMA line which may now act as resistance. A rally above that short-term average would help its outlook, technically. Do not be confused, as the most recent Featured Price, Pivot Point and Max Buy levels have been adjusted to account for a stock split 3:1 effective as of 7/06/10.
>>> The latest Featured Stock Update with an annotated graph appeared on 7/1/2010. Click here.
View all notes |
Alert me of new notes |
CANSLIM.net Company Profile |
SEC |
Zacks Reports |
StockTalk |
News |
Chart |
Request a new note
C
A N
S L
I M
|
FFIV
-
NASDAQ
F 5 Networks Inc
INTERNET - Internet Software and Services
|
$76.86
|
+0.19
0.25% |
$77.70
|
1,738,142
102.29% of 50 DAV
50 DAV is 1,699,200
|
$77.96
-1.41%
|
6/16/2010
|
$74.50
|
PP = $74.10
|
|
MB = $77.81
|
Most Recent Note - 7/12/2010 5:11:45 PM
Y - Gain today on light volume for a new 52-week high. Found support at its 50 DMA line last week. Recent low ($66.79 on 7/01/10) now defines a near-term chart support level to watch.
>>> The latest Featured Stock Update with an annotated graph appeared on 7/7/2010. Click here.
View all notes |
Alert me of new notes |
CANSLIM.net Company Profile |
SEC |
Zacks Reports |
StockTalk |
News |
Chart |
Request a new note
C
A N
S L
I M
|
MELI
-
NASDAQ
Mercadolibre Inc
INTERNET - Internet Software and; Services
|
$60.56
|
+1.71
2.91% |
$61.00
|
792,071
84.33% of 50 DAV
50 DAV is 939,300
|
$62.14
-2.54%
|
5/13/2010
|
$54.21
|
PP = $55.85
|
|
MB = $58.64
|
Most Recent Note - 7/13/2010 6:55:13 PM
G - Small gap up gain today with lighter volume led to a close just 19 cents below its best ever close. Color code is changed to green after rising back above its "max buy" level.
>>> The latest Featured Stock Update with an annotated graph appeared on 6/30/2010. Click here.
View all notes |
Alert me of new notes |
CANSLIM.net Company Profile |
SEC |
Zacks Reports |
StockTalk |
News |
Chart |
Request a new note
C
A N
S L
I M
|
NEM
-
NYSE
Newmont Mining Corp
METALS and MINING - Gold
|
$61.68
|
+0.10
0.16% |
$62.99
|
6,789,127
66.88% of 50 DAV
50 DAV is 10,150,900
|
$63.38
-2.68%
|
6/22/2010
|
$59.60
|
PP = $59.67
|
|
MB = $62.65
|
Most Recent Note - 7/12/2010 5:16:45 PM
Y - Holding its ground today quietly perched near all-time highs.
>>> The latest Featured Stock Update with an annotated graph appeared on 7/9/2010. Click here.
View all notes |
Alert me of new notes |
CANSLIM.net Company Profile |
SEC |
Zacks Reports |
StockTalk |
News |
Chart |
Request a new note
C
A N
S L
I M
|
ROVI
-
NASDAQ
Rovi Corp
COMPUTER SOFTWARE andamp; SERVICES - Security Software andamp; Services
|
$42.83
|
+0.85
2.02% |
$43.00
|
1,345,683
91.50% of 50 DAV
50 DAV is 1,470,700
|
$42.87
-0.09%
|
6/3/2010
|
$38.70
|
PP = $40.16
|
|
MB = $42.17
|
Most Recent Note - 7/12/2010 5:17:59 PM
G - Pulled back on lighter volume today after 4 consecutive gains. Color code was changed to green after it closed above its "max buy" level.
>>> The latest Featured Stock Update with an annotated graph appeared on 6/28/2010. Click here.
View all notes |
Alert me of new notes |
CANSLIM.net Company Profile |
SEC |
Zacks Reports |
StockTalk |
News |
Chart |
Request a new note
C
A N
S L
I M
|
Symbol/Exchange
Company Name
Industry Group |
PRICE |
CHANGE
(%Change) |
Day High |
Volume
(% DAV)
(% 50 day avg vol) |
52 Wk Hi
% From Hi |
Featured
Date |
Price
Featured |
Pivot Featured |
|
Max Buy |
THOR
-
NASDAQ
Thoratec Corp
HEALTH SERVICES - Medical Instruments and Supplies
|
$44.82
|
+0.02
0.04% |
$45.70
|
1,187,392
103.18% of 50 DAV
50 DAV is 1,150,800
|
$47.93
-6.49%
|
6/3/2010
|
$44.38
|
PP = $45.35
|
|
MB = $47.62
|
Most Recent Note - 7/12/2010 5:19:18 PM
Y - Quietly consolidating above support at its a 50 DMA line, an important support level.
>>> The latest Featured Stock Update with an annotated graph appeared on 6/23/2010. Click here.
View all notes |
Alert me of new notes |
CANSLIM.net Company Profile |
SEC |
Zacks Reports |
StockTalk |
News |
Chart |
Request a new note
C
A N
S L
I M
|
ULTA
-
NASDAQ
Ulta Salon Cosm & Frag
SPECIALTY RETAIL - Specialty Retail, Other
|
$23.89
|
+0.80
3.46% |
$23.93
|
437,234
63.64% of 50 DAV
50 DAV is 687,000
|
$26.75
-10.69%
|
5/28/2010
|
$25.58
|
PP = $25.86
|
|
MB = $27.15
|
Most Recent Note - 7/13/2010 7:34:07 PM
G - Gain today with light volume for a close above its 50 DMA line. Its May - June chart lows in the $21 area define the next support level just above its 200 DMA line.
>>> The latest Featured Stock Update with an annotated graph appeared on 6/25/2010. Click here.
View all notes |
Alert me of new notes |
CANSLIM.net Company Profile |
SEC |
Zacks Reports |
StockTalk |
News |
Chart |
Request a new note
C
A N
S L
I M
|
VIT
-
NYSE
Vanceinfo Tech Inc Ads
COMPUTER SOFTWARE and SERVICES - Business Software and Services
|
$25.35
|
-0.28
-1.09% |
$26.44
|
668,098
100.07% of 50 DAV
50 DAV is 667,600
|
$26.90
-5.76%
|
7/8/2010
|
$25.20
|
PP = $26.58
|
|
MB = $27.91
|
Most Recent Note - 7/12/2010 5:22:27 PM
Y - Its negative reversal today on higher volume and close near the session low, technically, appears to be a sign of distributional pressure near its prior high. It did not trigger a buy signal with respect to the pivot point cited after gapping up on 7/08/10, when it briefly matched its all-time high and appeared in the mid-day report (read here).
>>> The latest Featured Stock Update with an annotated graph appeared on 7/8/2010. Click here.
View all notes |
Alert me of new notes |
CANSLIM.net Company Profile |
SEC |
Zacks Reports |
StockTalk |
News |
Chart |
Request a new note
C
A N
S L
I M
|
|
|
|
THESE ARE NOT BUY RECOMMENDATIONS!
Comments contained in the body of this report are technical
opinions only. The material herein has been obtained
from sources believed to be reliable and accurate, however,
its accuracy and completeness cannot be guaranteed.
This site is not an investment advisor, hence it does
not endorse or recommend any securities or other investments.
Any recommendation contained in this report may not
be suitable for all investors and it is not to be deemed
an offer or solicitation on our part with respect to
the purchase or sale of any securities. All trademarks,
service marks and trade names appearing in this report
are the property of their respective owners, and are
likewise used for identification purposes only.
This report is a service available
only to active Paid Premium Members.
You may opt-out of receiving report notifications
at any time. Questions or comments may be submitted
by writing to Premium Membership Services 665 S.E. 10 Street, Suite 201 Deerfield Beach, FL 33441-5634 or by calling 1-800-965-8307
or 954-785-1121.
|
|
|


