You are not logged in.
This means you
CAN ONLY VIEW reports that were published prior to Monday, April 14, 2025.
You
MUST UPGRADE YOUR MEMBERSHIP if you want to see any current reports.
AFTER MARKET UPDATE - MONDAY, JULY 13TH, 2009
Previous After Market Report Next After Market Report >>>
|
|
|
|
DOW |
+185.16 |
8,331.68 |
+2.27% |
|
Volume |
1,189,433,860 |
+29% |
|
Volume |
1,959,997,350 |
+16% |
|
NASDAQ |
+37.18 |
1,793.21 |
+2.12% |
|
Advancers |
2,526 |
81% |
|
Advancers |
1,961 |
70% |
|
S&P 500 |
+21.92 |
901.05 |
+2.49% |
|
Decliners |
488 |
16% |
|
Decliners |
722 |
26% |
|
Russell 2000 |
+12.33 |
493.31 |
+2.56% |
|
52 Wk Highs |
20 |
|
|
52 Wk Highs |
11 |
|
|
S&P 600 |
+6.91 |
263.27 |
+2.70% |
|
52 Wk Lows |
7 |
|
|
52 Wk Lows |
19 |
|
|
 |
Financial Group Spearheads Major Averages' Rise on Higher Volume
Kenneth J. Gruneisen - Passed the CAN SLIM® Master's Exam
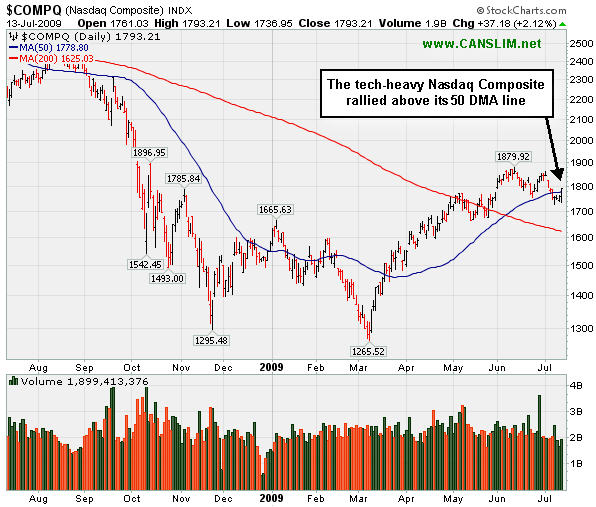
The market averages posted solid gains on Monday with much higher volume totals in comparison to the prior session totals on the NYSE and on the Nasdaq exchange, revealing better buying conviction from the institutional crowd. Advancers led decliners by about 5-to-1 on the NYSE and nearly 3-to-1 on the Nasdaq exchange. There were 6 high-ranked companies from the CANSLIM.net Leaders List that made a new 52-week high and appeared on the CANSLIM.net BreakOuts Page, up from the 3 issues that appeared on the prior session.
The financial sector has helped to lead as the major averages have risen from their March lows. The Industry Group Watch section shows the important resistance that the bank index is facing in the near term. Financial shares, as long-time readers of this commentary know, are an important leading indicator to watch. After leading a substantial rebound from the major averages, the financial group has been consolidating along with the broader market in recent weeks. Further upward progress in the financial group could bode well for the overall market outlook, however, the near-term resistance is substantial. Of course, leadership in a fair number of industry groups is necessary for any sustained rally, but the financial group played a critical role in the market's downswing, and it will play a very important role as the major averages rebuild.
Attention: Institutional Investors
To inquire about money management services specifically designed for your needs, please email ASarhan@sourcegrp.com.
PICTURED: The tech-heavy Nasdaq Composite Index rallied above its 50-day moving average line.
|
 Kenneth J. Gruneisen started out as a licensed stockbroker in August 1987, a couple of months prior to the historic stock market crash that took the Dow Jones Industrial Average down -22.6% in a single day. He has published daily fact-based fundamental and technical analysis on high-ranked stocks online for two decades. Through FACTBASEDINVESTING.COM, Kenneth provides educational articles, news, market commentary, and other information regarding proven investment systems that work in good times and bad.
Comments contained in the body of this report are technical opinions only and are not necessarily those of Gruneisen Growth Corp. The material herein has been obtained from sources believed to be reliable and accurate, however, its accuracy and completeness cannot be guaranteed. Our firm, employees, and customers may effect transactions, including transactions contrary to any recommendation herein, or have positions in the securities mentioned herein or options with respect thereto. Any recommendation contained in this report may not be suitable for all investors and it is not to be deemed an offer or solicitation on our part with respect to the purchase or sale of any securities. |
|
 |
Bank Index Leads Groups With Big Gains, Yet Faces Resistance
Kenneth J. Gruneisen - Passed the CAN SLIM® Master's Exam
The Broker/Dealer Index ($XBD +3.53%) and Bank Index ($BKX +6.53%) posted solid gains as the financial group was a major contributor behind the major averages' unanimous gains on Monday. A rising tide lifted all ships as the Retail Index ($RLX +2.66%), commodity-linked groups, and the majority of tech shares posted widespread gains. The Semiconductor ($SOX +2.41%), Internet ($IIX +1.80%), and Networking ($NWX +2.06%) indexes outpaced the Biotechnology ($BTK +1.11%) and Healthcare ($HMO +1.29%) groups. The Integrated Oil ($XOI +2.10%), Oil Services ($OSX +1.65%), and Gold & Silver ($XAU +1.74%) indexes also tallied solid gains.
Charts courtesy www.stockcharts.com
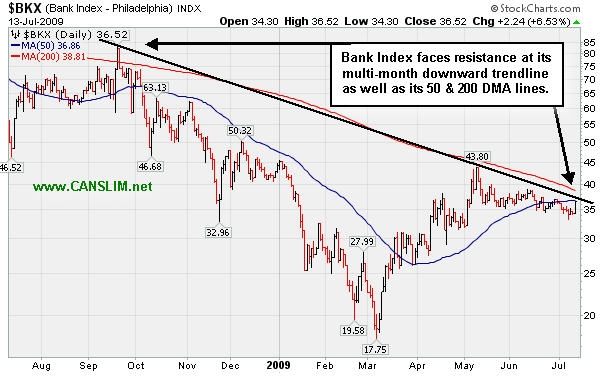
PICTURED: The Bank Index ($BKX +6.53%) was a standout gainer on Monday, underpinning the major averages' solid advance. In the near term it faces several important technical hurdles including its 50-day moving average (DMA) line first, then a multi-month downward trendline,and then its 200 DMA line. Among the catalysts for the big gain was a prominent analyst's upgrade of Goldman Sachs (GS +5.34%) ahead of its latest quarterly earnings announcement.
| Oil Services |
$OSX |
152.25 |
+2.47 |
+1.65% |
+25.42% |
| Healthcare |
$HMO |
1,080.20 |
+13.77 |
+1.29% |
+12.50% |
| Integrated Oil |
$XOI |
872.05 |
+17.90 |
+2.10% |
-10.99% |
| Semiconductor |
$SOX |
265.29 |
+6.25 |
+2.41% |
+25.04% |
| Networking |
$NWX |
177.14 |
+3.58 |
+2.06% |
+23.11% |
| Internet |
$IIX |
182.49 |
+3.22 |
+1.80% |
+36.42% |
| Broker/Dealer |
$XBD |
96.37 |
+3.29 |
+3.53% |
+24.40% |
| Retail |
$RLX |
317.86 |
+8.24 |
+2.66% |
+13.82% |
| Gold & Silver |
$XAU |
132.25 |
+2.26 |
+1.74% |
+6.78% |
| Bank |
$BKX |
36.52 |
+2.24 |
+6.53% |
-17.60% |
| Biotech |
$BTK |
653.86 |
+7.18 |
+1.11% |
+1.03% |
|
|
|
 |
Healthy Consolidation For High-Ranked Healthcare Firm
Kenneth J. Gruneisen - Passed the CAN SLIM® Master's Exam
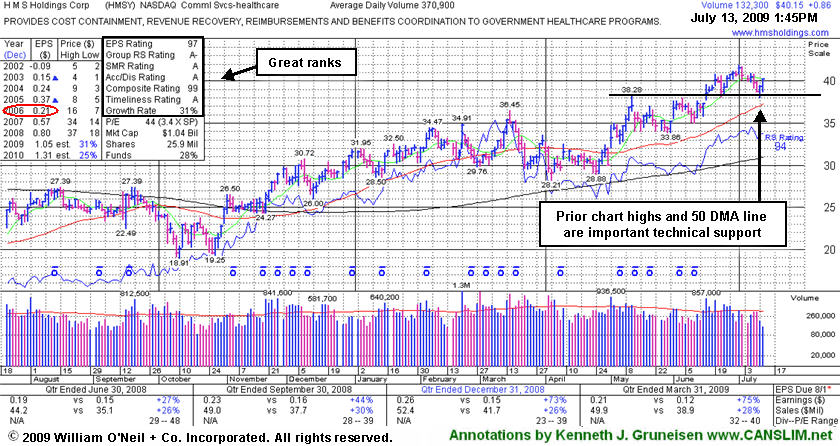
HMS Holdings Corp (HMSY +$0.99 or +2.52% to $40.28) posted another gain on below average volume. It positively reversed on Friday after a pullback near prior highs in the $38 area which are a very important initial support level above its 50-day moving average (DMA) line. Last week it was noted as it briefly violated an upward trendline connecting its April-June lows (not shown), raising some concerns. Deterioration into its prior base, or a violation of its 50 DMA line, would raise more serious concerns and trigger technical sell signals. A gap up gain on 6/16/09 with heavy volume triggered a technical buy signal. No overhead supply is left to hinder the progress for this Commercial Services - Healthcare firm. During its latest base its daily volume totals dried up, yet the volume behind its breakout to new highs (the N criteria) day was nearly two and a half times its average volume total. The heavy volume and gap up also provided a nice reassurance of institutional (the I criteria) buying demand.
A downturn in 2006 earnings (see red circle) is a fundamental flaw in HMS Holdings Corp's annual earnings history that raises some concerns with respect to the A criteria of the investment system. Investors' odds are usually better with a company that has a steady 3-5 year earnings growth history. That shortcoming could give investors one extra reason to be very careful about limiting losses. The stock was first featured on Friday, February 20, 2009 in the CANSLIM.net Mid Day Breakouts Report (read here), then dropped from the Featured Stocks list on 4/02/09 due to weak action, returning yet again in yellow in the mid-day report on 5/01/09.
|
|
|
Color Codes Explained :
Y - Better candidates highlighted by our
staff of experts.
G - Previously featured
in past reports as yellow but may no longer be buyable under the
guidelines.
***Last / Change / Volume quote data in this table corresponds with the timestamp on the note***
Symbol/Exchange
Company Name
Industry Group |
Last |
Chg. |
Vol
% DAV |
Date Featured |
Price Featured |
Latest Pivot Point
Featured |
Status |
| Latest Max Buy Price |
CPLA
- NASDAQ
Capella Education Co
DIVERSIFIED SERVICES - Education and Training Services
|
$59.23
|
N/A
|
N/A
N/A
|
7/9/2009
(Date
Featured) |
$59.69
(Price
Featured) |
PP = $62.06 |
G |
| MB = $65.16 |
Most Recent Note - 7/13/2009 8:40:38 PM
G - It positively reversed, which was a sign of impressive institutional support after initially gapping down today following an analyst downgrade. It had negatively reversed for a loss on the prior 2 sessions after it was featured in yellow in the 7/09/09 Mid-Day BreakOuts Report (read here). Color code is changed to green based on weak action. The group has shown some leadership, yet currently has a D for a Relative Strength Rating. CPLA is a high-ranked leader in the Commercial Services-Schools Group. Its small supply of only 13.9 million shares in the float could contribute to greater price volatility in the event of institutional accumulation or distribution. The number of top-rated funds owning an interest rose from 91 in Sept '08, to 129 as of March '09, which is reassuring with respect to the I criteria. It has a very good earnings history that satisfies the C & A criteria, while recent quarters showed steady sales revenues increases in the +17-18% range.
>>> The latest Featured Stock Update with an annotated graph appeared on 7/9/2009. click here.
|
|
C
A
S
I |
News |
Chart |
SEC
View all notes Alert
me of new notes
Company
Profile
|
GMCR
- NASDAQ
Green Mtn Coffee Roastrs
FOOD & BEVERAGE - Processed & Packaged Goods
|
$56.10
|
N/A
|
N/A
N/A
|
1/1/2008
(Date
Featured) |
$27.13
(Price
Featured) |
PP = $28.66 |
G |
| MB = $30.09 |
Most Recent Note - 7/13/2009 8:43:04 PM
G - Closed above its 50 DMA line today after breaching it at intra-day lows. Its short-term average is a very important support level to watch above its recent chart low ($51.65), where violations would raise concerns and trigger technical sell signals. On 6/09/09 it reached a new all-time high with a gain on light volume as a 3:2 stock split took effect. GMCR traded up more than +144% since appearing with an annotated graph under the headline "It May Soon Be Time To Go Green" when featured in the January 2009 CANSLIM.net News (read here).
>>> The latest Featured Stock Update with an annotated graph appeared on 7/6/2009. click here.
|
|
C
A
S
I |
News |
Chart |
SEC
View all notes Alert
me of new notes
Company
Profile
|
HMSY
- NASDAQ
H M S Holdings Corp
COMPUTER SOFTWARE & SERVICES - Healthcare Information Service
|
$40.28
|
N/A
|
N/A
N/A
|
2/20/2009
(Date
Featured) |
$34.08
(Price
Featured) |
PP = $38.38 |
G |
| MB = $40.30 |
Most Recent Note - 7/13/2009 8:44:54 PM
G - Small gain on light volume today after Friday's positive reversal when testing prior highs in the $38 area which are a very important initial support level above its 50 DMA line. Last week it sank under an upward trendline connecting its April-June lows. A gap up gain on 6/16/09 with heavy volume triggered a technical buy signal. No overhead supply is left to hinder the progress for this Commercial Services - Healthcare firm.
>>> The latest Featured Stock Update with an annotated graph appeared on 7/13/2009. click here.
|
|
C
A
S
I |
News |
Chart |
SEC
View all notes Alert
me of new notes
Company
Profile
|
NTES
- NASDAQ
Netease Inc Adr
INTERNET - Internet Information Providers
|
$35.01
|
N/A
|
N/A
N/A
|
5/21/2009
(Date
Featured) |
$31.19
(Price
Featured) |
PP = $32.75 |
G |
| MB = $34.39 |
Most Recent Note - 7/13/2009 8:46:59 PM
G - Posted a second consecutive gain with light volume, fighting to stay above its 50 DMA line after a considerable loss on 7/08/09 with above average volume triggered a technical sell signal. Recent losses were noted as a worrisome violation of a multi-month upward trendline occurred. Prior chart highs near $32 are an important technical support level to watch now. It has negated all gains since its 5/28/09 gap up and considerable gain with +79% above average volume confirmed its last sound technical buy signal. Indications of institutional (the I criteria) buying demand have been noted after earnings news on 5/20/09 a shakeout tested support near its 50 DMA line. First featured at $26.75 in the 3/31/09 CANSLIM.net Mid-Day Breakouts Report (read here). This high-ranked Chinese Internet - Content firm was also summarized in greater detail including an annotated graph in the April 2009 issue of CANSLIM.net News (read here).
>>> The latest Featured Stock Update with an annotated graph appeared on 6/30/2009. click here.
|
|
C
A
S
I |
News |
Chart |
SEC
View all notes Alert
me of new notes
Company
Profile
|
NVEC
- NASDAQ
N V E Corp
ELECTRONICS - Semiconductor - Specialized
|
$45.29
|
N/A
|
N/A
N/A
|
3/13/2009
(Date
Featured) |
$33.85
(Price
Featured) |
PP = $45.50 |
G |
| MB = $47.78 |
Most Recent Note - 7/13/2009 7:39:24 PM
G - Made a stand and rallied today with light volume at its 50 DMA line and prior highs - important support to watch. Color code was changed to green based deterioration after its 6/19/09 breakout from an "ascending base" typem pattern was completely negated. Sales increases in recent comparisons have been under the +25% guideline and still rather minuscule, leaving concerns, especially in the event of any hiccups. This is a reason to be especially disciplined about proper entries and exits.
>>> The latest Featured Stock Update with an annotated graph appeared on 7/8/2009. click here.
|
|
C
A
S
I |
News |
Chart |
SEC
View all notes Alert
me of new notes
Company
Profile
|
SNDA
-
|
$51.81
|
N/A
|
N/A
N/A
|
5/31/2009
(Date
Featured) |
$57.62
(Price
Featured) |
PP = $53.95 |
G |
| MB = $56.65 |
Most Recent Note - 7/13/2009 8:28:03 PM
G - Slumped under its 50 DMA line recently. Concerns increase the longer it trades below that short-term average, while subsequent deterioration below its recent chart low near $50 would raise more serious concerns and trigger a worrisome technical sell signal. Detailed analysis was included when recently featured in the June 2009 issue of CANSLIM.net News. Be sure to review the "What to Look Out For" section and entire detailed summary - read here).
>>> The latest Featured Stock Update with an annotated graph appeared on 7/2/2009. click here.
|
|
C
A
S
I |
News |
Chart |
SEC
View all notes Alert
me of new notes
Company
Profile
|
SYNA
- NASDAQ
Synaptics Inc
COMPUTER SOFTWARE & SERVICES - Information Technology Service
|
$34.81
|
N/A
|
N/A
N/A
|
5/18/2009
(Date
Featured) |
$32.58
(Price
Featured) |
PP = $34.52 |
G |
| MB = $36.25 |
Most Recent Note - 7/13/2009 8:31:20 PM
G - Today's small gain on light volume ended a streak of 7 consecutive losses. A 50 DMA line violation on 7/08/09 triggered a technical sell signal. First featured in yellow in the May 18, 2009 mid-day report (read here). The number of top-rated funds owning its shares rose from 123 in June '08 to 199 in March '09, which is good news concerning the I criteria. Its annual earnings (the A criteria) history showed a dowturn in 2006, leaving concerns, but it followed that up with strong growth the next 2 years. Its small supply of shares (the S criteria) outstanding could contribute to especially great volatility in the event of institutional accumulation or distribution.
>>> The latest Featured Stock Update with an annotated graph appeared on 7/10/2009. click here.
|
|
C
A
S
I |
News |
Chart |
SEC
View all notes Alert
me of new notes
Company
Profile
|
TNDM
- NASDAQ
Tandem Diabetes Care Inc
TELECOMMUNICATIONS - Wireless Communications
|
$28.27
|
N/A
|
N/A
N/A
|
3/2/2009
(Date
Featured) |
$18.89
(Price
Featured) |
PP = $29.85 |
G |
| MB = $31.34 |
Most Recent Note - 7/13/2009 8:39:20 PM
G - A small gain on light volume today helped it rally above its 50 DMA line. Its choppy chart offers no sound base per the investment system's guidelines. It traded up as much as +72.42% since first featured at $18.89 in the 3/02/09 Mid-Day BreakOuts Report (read here).
>>> The latest Featured Stock Update with an annotated graph appeared on 7/7/2009. click here.
|
|
C
A
S
I |
News |
Chart |
SEC
View all notes Alert
me of new notes
Company
Profile
|
|
|
|
THESE ARE NOT BUY RECOMMENDATIONS!
Comments contained in the body of this report are technical
opinions only. The material herein has been obtained
from sources believed to be reliable and accurate, however,
its accuracy and completeness cannot be guaranteed.
This site is not an investment advisor, hence it does
not endorse or recommend any securities or other investments.
Any recommendation contained in this report may not
be suitable for all investors and it is not to be deemed
an offer or solicitation on our part with respect to
the purchase or sale of any securities. All trademarks,
service marks and trade names appearing in this report
are the property of their respective owners, and are
likewise used for identification purposes only.
This report is a service available
only to active Paid Premium Members.
You may opt-out of receiving report notifications
at any time. Questions or comments may be submitted
by writing to Premium Membership Services 665 S.E. 10 Street, Suite 201 Deerfield Beach, FL 33441-5634 or by calling 1-800-965-8307
or 954-785-1121.
|
|
|

