You are not logged in.
This means you
CAN ONLY VIEW reports that were published prior to Monday, March 10, 2025.
You
MUST UPGRADE YOUR MEMBERSHIP if you want to see any current reports.
AFTER MARKET UPDATE - TUESDAY, JULY 12TH, 2011
Previous After Market Report Next After Market Report >>>
|
|
|
|
DOW |
-58.88 |
12,446.88 |
-0.47% |
|
Volume |
924,539,300 |
+12% |
|
Volume |
1,957,138,350 |
+13% |
|
NASDAQ |
-20.71 |
2,781.91 |
-0.74% |
|
Advancers |
1,247 |
40% |
|
Advancers |
1,059 |
40% |
|
S&P 500 |
-5.86 |
1,313.63 |
-0.44% |
|
Decliners |
1,757 |
56% |
|
Decliners |
1,515 |
57% |
|
Russell 2000 |
-3.77 |
829.77 |
-0.45% |
|
52 Wk Highs |
46 |
|
|
52 Wk Highs |
54 |
|
|
S&P 600 |
-1.49 |
447.20 |
-0.33% |
|
52 Wk Lows |
37 |
|
|
52 Wk Lows |
35 |
|
|
 |
Distributional Action Puts Rally Under Pressure Again
Kenneth J. Gruneisen - Passed the CAN SLIM® Master's Exam
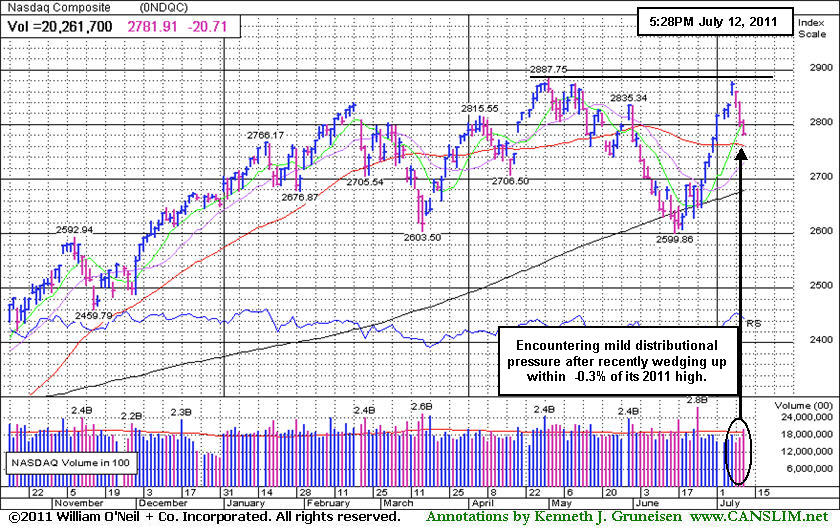
Another losing session marked a 3rd straight day of unanimous losses for the Dow Jones Industrial Average, S&P 500 Index, and Nasdaq Composite Index. The losses came with higher volume totals than those reported on Monday's session on the NYSE and on the Nasdaq exchange which indicated "distribution", a worrisome pick-up in institutional selling pressure weighing on the market once again. Declining issues beat advancers by about a 3-2 ratio on the NYSE and on the Nasdaq exchange. New 52-week highs still outnumbered new 52-week lows on both the Nasdaq exchange and the NYSE. There were 17 high-ranked companies from the CANSLIM.net Leaders List that made new 52-week highs and appeared on the CANSLIM.net BreakOuts Page, up from the total of 14 on the prior session. There were only 4 gainers out of the 16 high-ranked leaders currently included on the Featured Stocks Page.
Tuesday's choppy session ended on a sour note when Moody's downgraded Ireland's credit rating to junk status in the last hour of trading. The news offset successful bond auctions in Italy and Greece. Meanwhile, minutes of June's Federal Reserve meeting revealed support by some members for further stimulus if the U.S. economy remains weak. There were some positive signs in the U.S. trade report. Even though the trade deficit widened to the highest level in almost three years in May, U.S. exports remained strong and were close to April's record.
Semiconductor stocks were flattened by disappointing numbers out of Microchip Technology Inc (MCHP -12.14%) and Novellus Systems Inc (NVLS -11.24%). The price of oil closed up more than $2 per barrel. Gold rose for a sixth day, and reached a record settlement price in New York.
Distributional pressure has put the current rally under pressure again. Earnings news and guidance from companies may be a catalyst for additional volatility in the coming weeks as earnings announcements roll in. Our July 2011 issue of CANSLIM.net News is due to be released soon with a comprehensive summary of current market conditions that further clarifies matters concerning the M criteria! The Q2 2011 CANSLIM.net Webcast is available "ON DEMAND" now to UPGRADED MEMBERS ONLY - (CLICK HERE).
PICTURED: The Nasdaq Composite Index has been encountering mild distributional pressure after recently wedging up to within -0.3% of its 52-week high.
|
 Kenneth J. Gruneisen started out as a licensed stockbroker in August 1987, a couple of months prior to the historic stock market crash that took the Dow Jones Industrial Average down -22.6% in a single day. He has published daily fact-based fundamental and technical analysis on high-ranked stocks online for two decades. Through FACTBASEDINVESTING.COM, Kenneth provides educational articles, news, market commentary, and other information regarding proven investment systems that work in good times and bad.
Comments contained in the body of this report are technical opinions only and are not necessarily those of Gruneisen Growth Corp. The material herein has been obtained from sources believed to be reliable and accurate, however, its accuracy and completeness cannot be guaranteed. Our firm, employees, and customers may effect transactions, including transactions contrary to any recommendation herein, or have positions in the securities mentioned herein or options with respect thereto. Any recommendation contained in this report may not be suitable for all investors and it is not to be deemed an offer or solicitation on our part with respect to the purchase or sale of any securities. |
|
 |
Gold & Silver Index Rebounds Above 50 & 200 DMA Lines
Kenneth J. Gruneisen - Passed the CAN SLIM® Master's Exam
The tech sector had a negative bias as the Semiconductor Index ($SOX -2.89%) led the retreat, followed by the Networking Index ($NWX -1.40%), Internet Index ($IIX -0.76%), and Biotechnology Index ($BTK -0.12%). Energy-related shares slipped as the Oil Services Index ($OSX -0.84%) and Integrated Oil Index ($XOI -0.57%) finished modestly lower. The Broker/Dealer Index ($XBD +0.04%) held its ground but the Bank Index ($BKX -0.23%) and Retail Index ($RLX -0.22% ) suffered small losses. Defensive groups rose as the Healthcare Index ($HMO +0.47%) posted a small gain and the Gold & Silver Index ($XAU +2.72%) was a standout gainer.
Charts courtesy www.stockcharts.com
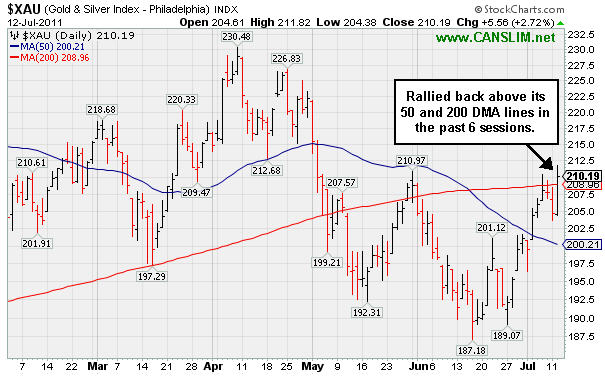
PICTURED: The Gold & Silver Index ($XAU +2.72%) rallied back above its 50-day and 200-day moving average (DMA) lines in the past 6 sessions.
| Oil Services |
$OSX |
263.44 |
-2.22 |
-0.84% |
+7.47% |
| Healthcare |
$HMO |
2,432.06 |
+11.46 |
+0.47% |
+43.74% |
| Integrated Oil |
$XOI |
1,284.78 |
-7.35 |
-0.57% |
+5.90% |
| Semiconductor |
$SOX |
394.96 |
-11.77 |
-2.89% |
-4.09% |
| Networking |
$NWX |
294.34 |
-4.18 |
-1.40% |
+4.91% |
| Internet |
$IIX |
312.18 |
-2.39 |
-0.76% |
+1.45% |
| Broker/Dealer |
$XBD |
104.00 |
+0.05 |
+0.04% |
-14.41% |
| Retail |
$RLX |
543.93 |
-1.19 |
-0.22% |
+6.99% |
| Gold & Silver |
$XAU |
210.19 |
+5.56 |
+2.72% |
-7.23% |
| Bank |
$BKX |
46.86 |
-0.11 |
-0.23% |
-10.25% |
| Biotech |
$BTK |
1,438.62 |
-1.66 |
-0.12% |
+10.87% |
|
|
|
 |
Falling Under New Pivot Point Without Triggering Fresh Buy Signal
Kenneth J. Gruneisen - Passed the CAN SLIM® Master's Exam
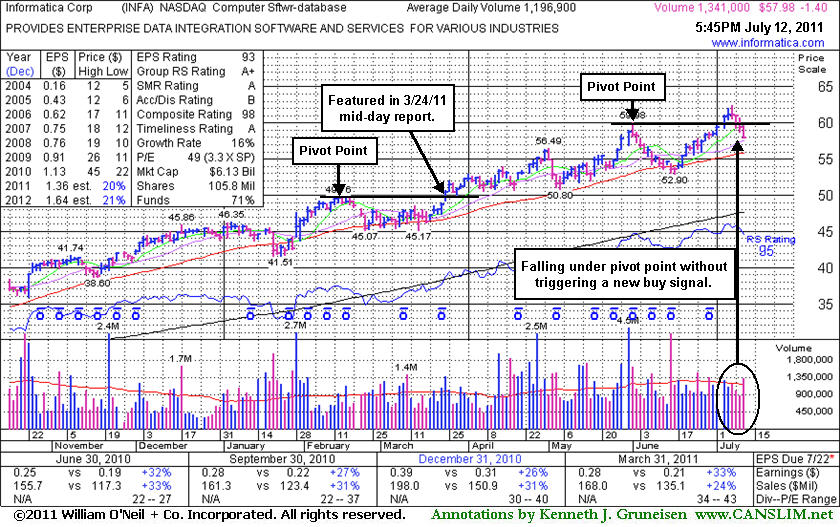
Informatica Corp. (INFA -$1.40 or -2.36% to $57.98) has been pulling back, consolidating below its new pivot point recently cited. This high-ranked Computer Software - Database firm faces no resistance due to overhead supply. Disciplined investors know to watch for a volume-driven breakout gain above the pivot point with at least +50% above average volume to first trigger a convincing new (or add-on) technical buy signal before taking action.
Following its last appearance in this FSU section with an annotated daily graph on 6/17/11 under the headline, "Computer Software Firm Extended From Last Base Pattern", this Redwood City, CA-based firm found support near its 50-day moving average (DMA) line. On July 1st its color code was changed to yellow as a new pivot point was cited based on a new short flat base pattern. Although it quietly wedged above the pivot point, the gains came without sufficient volume to trigger a buy signal. Following those half-hearted gains there have been 4 consecutive losses. Today's loss came with slightly above average volume and it closed near the session low, showing signs of distributional pressure rather than more favorable institutional accumulation.
Since the 3/24/11 mid-day report (read here) highlighted in yellow at $50.04 it has traded as much as +24.7% higher. It reported +33% earnings on +24% sales revenues for the quarter ended March 31, 2011 versus the year ago period. That followed prior strong results after its Jun, Sep, and Dec '10 earnings increases were all above the +25% minimum guidelines. It has also maintained a steady annual earnings (A criteria) history. The number of top-rated funds owning its shares rose from 634 in Mar '10 to 726 in Mar '11, a reassuring sign concerning the I criteria.
|
|
|
Color Codes Explained :
Y - Better candidates highlighted by our
staff of experts.
G - Previously featured
in past reports as yellow but may no longer be buyable under the
guidelines.
***Last / Change / Volume data in this table is the closing quote data***
Symbol/Exchange
Company Name
Industry Group |
PRICE |
CHANGE
(%Change) |
Day High |
Volume
(% DAV)
(% 50 day avg vol) |
52 Wk Hi
% From Hi |
Featured
Date |
Price
Featured |
Pivot Featured |
|
Max Buy |
CACC
-
NASDAQ
Credit Acceptance Corp
FINANCIAL SERVICES - Credit Services
|
$82.63
|
-0.38
-0.46% |
$84.31
|
15,816
36.95% of 50 DAV
50 DAV is 42,800
|
$86.87
-4.88%
|
6/2/2011
|
$76.10
|
PP = $82.39
|
|
MB = $86.51
|
Most Recent Note - 7/11/2011 11:31:03 AM
Y - Consolidating after its 6/30/11 technical breakout, holding its ground above its pivot point, and it is not extended beyond its "max buy" level. Prior highs in the $80-82 area define initial support to watch on pullbacks.
>>> The latest Featured Stock Update with an annotated graph appeared on 6/27/2011. Click here.
View all notes |
Alert me of new notes |
CANSLIM.net Company Profile |
SEC |
Zacks Reports |
StockTalk |
News |
Chart |
Request a new note
C
A N
S L
I M


|
CMG
-
NYSE
Chipotle Mexican Grill
LEISURE - Restaurants
|
$319.71
|
-0.98
-0.31% |
$323.50
|
644,166
81.52% of 50 DAV
50 DAV is 790,200
|
$329.80
-3.06%
|
4/1/2011
|
$274.00
|
PP = $275.10
|
|
MB = $288.86
|
Most Recent Note - 7/11/2011 5:02:27 PM
G - Pulled back today on near average volume. Extended from prior highs and an upward trendline that define chart support to watch. See the latest FSU analysis for more details and a new annotated weekly graph.
>>> The latest Featured Stock Update with an annotated graph appeared on 7/8/2011. Click here.
View all notes |
Alert me of new notes |
CANSLIM.net Company Profile |
SEC |
Zacks Reports |
StockTalk |
News |
Chart |
Request a new note
C
A N
S L
I M
|
EW
-
NYSE
Edwards Lifesciences Cp
HEALTH SERVICES - Medical Appliances and Equipment
|
$89.90
|
-0.23
-0.26% |
$90.54
|
695,727
90.74% of 50 DAV
50 DAV is 766,700
|
$91.82
-2.09%
|
7/6/2011
|
$89.19
|
PP = $90.48
|
|
MB = $95.00
|
Most Recent Note - 7/11/2011 4:57:10 PM
Y - This high-ranked Medical - Products firm is quietly perched within close striking distance of its 52-week and all-time highs. Disciplined investors will watch first for volume-driven gains and a strong close above its pivot point to trigger a proper technical buy signal. See the latest FSU analysis for more details and a new annotated weekly graph.
>>> The latest Featured Stock Update with an annotated graph appeared on 7/7/2011. Click here.
View all notes |
Alert me of new notes |
CANSLIM.net Company Profile |
SEC |
Zacks Reports |
StockTalk |
News |
Chart |
Request a new note
C
A N
S L
I M
|
EZPW
-
NASDAQ
Ezcorp Inc Cl A
SPECIALTY RETAIL - Specialty Retail, Other
|
$36.64
|
-0.09
-0.25% |
$37.28
|
315,861
80.87% of 50 DAV
50 DAV is 390,600
|
$38.66
-5.23%
|
6/13/2011
|
$31.18
|
PP = $33.41
|
|
MB = $35.08
|
Most Recent Note - 7/11/2011 12:25:21 PM
G - Holding its ground near all-time highs after a streak of 10 consecutive volume-driven gains. It is very extended from prior highs in the $33 area that define support to watch on pullbacks.
>>> The latest Featured Stock Update with an annotated graph appeared on 7/5/2011. Click here.
View all notes |
Alert me of new notes |
CANSLIM.net Company Profile |
SEC |
Zacks Reports |
StockTalk |
News |
Chart |
Request a new note
C
A N
S L
I M
|
FCFS
-
NASDAQ
First Cash Financial Svs
SPECIALTY RETAIL - Specialty Retail, Other
|
$42.60
|
-0.09
-0.21% |
$42.95
|
171,139
92.66% of 50 DAV
50 DAV is 184,700
|
$44.84
-5.00%
|
5/31/2011
|
$42.00
|
PP = $40.23
|
|
MB = $42.24
|
Most Recent Note - 7/11/2011 4:53:53 PM
Y - Down on lighter volume for a second consecutive session since hitting a new all-time high. Slightly extended from its prior base. Prior highs in the $40-42 area define initial support areas to watch.
>>> The latest Featured Stock Update with an annotated graph appeared on 6/22/2011. Click here.
View all notes |
Alert me of new notes |
CANSLIM.net Company Profile |
SEC |
Zacks Reports |
StockTalk |
News |
Chart |
Request a new note
C
A N
S L
I M
|
Symbol/Exchange
Company Name
Industry Group |
PRICE |
CHANGE
(%Change) |
Day High |
Volume
(% DAV)
(% 50 day avg vol) |
52 Wk Hi
% From Hi |
Featured
Date |
Price
Featured |
Pivot Featured |
|
Max Buy |
FOSL
-
NASDAQ
Fossil Inc
CONSUMER DURABLES - Recreational Goods, Other
|
$125.57
|
+0.57
0.46% |
$126.20
|
882,982
114.78% of 50 DAV
50 DAV is 769,300
|
$128.42
-2.22%
|
2/1/2011
|
$73.30
|
PP = $74.44
|
|
MB = $78.16
|
Most Recent Note - 7/11/2011 12:27:28 PM
G - Touched another new all-time high today. It is extended from prior highs in the $107 area that now define initial support to watch near its 50 DMA line.
>>> The latest Featured Stock Update with an annotated graph appeared on 6/28/2011. Click here.
View all notes |
Alert me of new notes |
CANSLIM.net Company Profile |
SEC |
Zacks Reports |
StockTalk |
News |
Chart |
Request a new note
C
A N
S L
I M
|
HS
-
NYSE
Healthspring Inc
HEALTH SERVICES - Health Care Plans
|
$46.26
|
-0.24
-0.52% |
$46.60
|
893,927
99.68% of 50 DAV
50 DAV is 896,800
|
$48.95
-5.50%
|
6/16/2011
|
$42.44
|
PP = $45.21
|
|
MB = $47.47
|
Most Recent Note - 7/11/2011 11:22:22 AM
Y - Quietly consolidating under its "max buy" level today and its color code is changed to yellow. Prior resistance near $45 defines support to watch.
>>> The latest Featured Stock Update with an annotated graph appeared on 7/11/2011. Click here.
View all notes |
Alert me of new notes |
CANSLIM.net Company Profile |
SEC |
Zacks Reports |
StockTalk |
News |
Chart |
Request a new note
C
A N
S L
I M
|
INFA
-
NASDAQ
Informatica Corp
COMPUTER SOFTWARE and SERVICES - Business Software and Services
|
$57.98
|
-1.40
-2.36% |
$59.65
|
1,340,962
112.04% of 50 DAV
50 DAV is 1,196,900
|
$62.42
-7.11%
|
7/1/2011
|
$59.36
|
PP = $60.08
|
|
MB = $63.08
|
 Most Recent Note - 7/12/2011 5:55:06 PM
Y - Volume increased to slightly above average behind today's 4th consecutive loss. This high-ranked Computer Software - Database firm faces no resistance due to overhead supply, but disciplined investors would wait for a volume-driven breakout to trigger a new (or add-on) technical buy signal. See the latest FSU analysis for more details and a new annotated graph.
>>> The latest Featured Stock Update with an annotated graph appeared on 7/12/2011. Click here.
View all notes |
Alert me of new notes |
CANSLIM.net Company Profile |
SEC |
Zacks Reports |
StockTalk |
News |
Chart |
Request a new note
C
A N
S L
I M
|
LULU
-
NASDAQ
Lululemon Athletica
MANUFACTURING - Textile Manufacturing
|
$59.92
|
+1.03
1.75% |
$60.70
|
3,497,271
84.46% of 50 DAV
50 DAV is 4,140,800
|
$61.92
-3.23%
|
6/21/2011
|
$102.95
|
PP = $101.14
|
|
MB = $106.20
|
Most Recent Note - 7/12/2011 10:23:24 AM
G - Do not be confused by the 2:1 split impacting its share price effective today while perched near its all-time high. Its rally of better than +20% in less than 2-3 weeks after its recent technical breakout argues for investors to follow the investment system rule of holding stocks with such powerful early gains for 8 weeks minimum.
>>> The latest Featured Stock Update with an annotated graph appeared on 6/21/2011. Click here.
View all notes |
Alert me of new notes |
CANSLIM.net Company Profile |
SEC |
Zacks Reports |
StockTalk |
News |
Chart |
Request a new note
C
A N
S L
I M
|
MWIV
-
NASDAQ
M W I Veterinary Supply
HEALTH SERVICES - Medical Instruments and; Supplies
|
$84.15
|
+1.03
1.24% |
$84.94
|
36,012
50.86% of 50 DAV
50 DAV is 70,800
|
$86.99
-3.26%
|
7/11/2011
|
$83.39
|
PP = $84.67
|
|
MB = $88.90
|
Most Recent Note - 7/11/2011 4:39:31 PM
Y - Down today on quiet volume. Perched within close striking distance of a new high close. Color code is changed to yellow with new pivot point cited based on its 5/20/11 high plus 10 cents. Volume-driven gains are needed to confirm a proper technical buy signal.
>>> The latest Featured Stock Update with an annotated graph appeared on 6/30/2011. Click here.
View all notes |
Alert me of new notes |
CANSLIM.net Company Profile |
SEC |
Zacks Reports |
StockTalk |
News |
Chart |
Request a new note
C
A N
S L
I M
|
Symbol/Exchange
Company Name
Industry Group |
PRICE |
CHANGE
(%Change) |
Day High |
Volume
(% DAV)
(% 50 day avg vol) |
52 Wk Hi
% From Hi |
Featured
Date |
Price
Featured |
Pivot Featured |
|
Max Buy |
OPNT
-
NASDAQ
Opnet Technologies
INTERNET - Internet Software and Services
|
$38.82
|
-1.10
-2.76% |
$39.91
|
101,424
82.12% of 50 DAV
50 DAV is 123,500
|
$42.51
-8.68%
|
6/28/2011
|
$40.87
|
PP = $42.61
|
|
MB = $44.74
|
Most Recent Note - 7/12/2011 5:19:58 PM
G - Today's 3rd consecutive loss on below average volume led to a close near its 50 DMA line and -8.7% off its 52-week high. Color code is changed to green after mild distributional damage. Disciplined investors would note that it did not trigger a confirming technical buy signal after its new pivot point was cited. Recent lows near $36 define important near-term chart support.
>>> The latest Featured Stock Update with an annotated graph appeared on 7/1/2011. Click here.
View all notes |
Alert me of new notes |
CANSLIM.net Company Profile |
SEC |
Zacks Reports |
StockTalk |
News |
Chart |
Request a new note
C
A N
S L
I M
|
OTEX
-
NASDAQ
Open Text Corp
INTERNET - Internet Software and Services
|
$65.30
|
-0.07
-0.11% |
$65.60
|
159,214
57.15% of 50 DAV
50 DAV is 278,600
|
$68.67
-4.91%
|
6/1/2011
|
$65.86
|
PP = $67.18
|
|
MB = $70.54
|
Most Recent Note - 7/11/2011 11:24:38 AM
Y - Pulling back from its 52-week high and slumping back under its pivot point today after a recent streak of consecutive gains without great volume conviction. Volume-driven gains above the previously cited pivot point may trigger a technical buy signal.
>>> The latest Featured Stock Update with an annotated graph appeared on 6/24/2011. Click here.
View all notes |
Alert me of new notes |
CANSLIM.net Company Profile |
SEC |
Zacks Reports |
StockTalk |
News |
Chart |
Request a new note
C
A N
S L
I M
|
QSII
-
NASDAQ
Quality Systems Inc
COMPUTER SOFTWARE and SERVICES - Healthcare Information Service
|
$89.10
|
-0.94
-1.04% |
$90.05
|
120,067
50.03% of 50 DAV
50 DAV is 240,000
|
$92.38
-3.55%
|
7/6/2011
|
$91.26
|
PP = $91.67
|
|
MB = $96.25
|
Most Recent Note - 7/11/2011 12:49:53 PM
Y - Pulling back today after touching new all-time highs last week. Formed a lopsided 9-week cup shaped base without a handle. Color code was changed to yellow in the 7/06/11 mid-day report. A volume-driven gain above its pivot point is still needed to trigger a new technical buy signal. This long-ago featured Computer Software - Medical firm's earnings and sales increases in the recent quarterly comparisons showed acceleration. It has also maintained a steady and strong annual earnings history (A criteria).

>>> The latest Featured Stock Update with an annotated graph appeared on 7/6/2011. Click here.
View all notes |
Alert me of new notes |
CANSLIM.net Company Profile |
SEC |
Zacks Reports |
StockTalk |
News |
Chart |
Request a new note
C
A N
S L
I M
|
SWI
-
NYSE
Solarwinds Inc
COMPUTER SOFTWARE and SERVICES - Application Software
|
$24.94
|
-0.42
-1.66% |
$25.39
|
346,217
39.03% of 50 DAV
50 DAV is 887,000
|
$26.68
-6.52%
|
6/7/2011
|
$24.22
|
PP = $25.05
|
|
MB = $26.30
|
Most Recent Note - 7/11/2011 5:05:52 PM
Y - Finished near the session high today with a small loss on below average volume, a sign of prompt support after a gap down and early weakness that tested near recent chart lows and its 50 DMA line. Its color code was changed to yellow after the quiet pullback without heavy volume. More damaging losses would raise concerns and trigger technical sell signals.
>>> The latest Featured Stock Update with an annotated graph appeared on 6/29/2011. Click here.
View all notes |
Alert me of new notes |
CANSLIM.net Company Profile |
SEC |
Zacks Reports |
StockTalk |
News |
Chart |
Request a new note
C
A N
S L
I M
|
ULTA
-
NASDAQ
Ulta Salon Cosm & Frag
SPECIALTY RETAIL - Specialty Retail, Other
|
$64.29
|
-0.67
-1.03% |
$65.65
|
963,987
109.26% of 50 DAV
50 DAV is 882,300
|
$68.80
-6.56%
|
1/6/2011
|
$36.12
|
PP = $37.34
|
|
MB = $39.21
|
Most Recent Note - 7/12/2011 1:24:13 PM
G - Perched near its all-time high today, extended from any sound base pattern and well above its 50 DMA line. It may produce more climactic gains, but disciplined investors avoid chasing extended stocks.
>>> The latest Featured Stock Update with an annotated graph appeared on 6/20/2011. Click here.
View all notes |
Alert me of new notes |
CANSLIM.net Company Profile |
SEC |
Zacks Reports |
StockTalk |
News |
Chart |
Request a new note
C
A N
S L
I M
|
Symbol/Exchange
Company Name
Industry Group |
PRICE |
CHANGE
(%Change) |
Day High |
Volume
(% DAV)
(% 50 day avg vol) |
52 Wk Hi
% From Hi |
Featured
Date |
Price
Featured |
Pivot Featured |
|
Max Buy |
ZAGG
-
NASDAQ
Zagg Inc
SPECIALTY RETAIL - Specialty Retail, Other
|
$13.16
|
+0.54
4.28% |
$13.62
|
2,290,081
107.11% of 50 DAV
50 DAV is 2,138,100
|
$15.85
-16.97%
|
6/1/2011
|
$10.92
|
PP = $10.59
|
|
MB = $11.12
|
Most Recent Note - 7/12/2011 3:22:06 PM
G - Posting a solid gain today, consolidating well above its 50 DMA line and prior highs defining support. It is now in the 7th week since its powerful breakout, and after tallying gains greater than +20% in the first 2-3 weeks it argues for investors to follow the investment system rule of holding stocks with such powerful early gains for 8 weeks minimum unless there is a bad technical breakdown.
>>> The latest Featured Stock Update with an annotated graph appeared on 6/23/2011. Click here.
View all notes |
Alert me of new notes |
CANSLIM.net Company Profile |
SEC |
Zacks Reports |
StockTalk |
News |
Chart |
Request a new note
C
A N
S L
I M
|
|
|
|
THESE ARE NOT BUY RECOMMENDATIONS!
Comments contained in the body of this report are technical
opinions only. The material herein has been obtained
from sources believed to be reliable and accurate, however,
its accuracy and completeness cannot be guaranteed.
This site is not an investment advisor, hence it does
not endorse or recommend any securities or other investments.
Any recommendation contained in this report may not
be suitable for all investors and it is not to be deemed
an offer or solicitation on our part with respect to
the purchase or sale of any securities. All trademarks,
service marks and trade names appearing in this report
are the property of their respective owners, and are
likewise used for identification purposes only.
This report is a service available
only to active Paid Premium Members.
You may opt-out of receiving report notifications
at any time. Questions or comments may be submitted
by writing to Premium Membership Services 665 S.E. 10 Street, Suite 201 Deerfield Beach, FL 33441-5634 or by calling 1-800-965-8307
or 954-785-1121.
|
|
|

