You are not logged in.
This means you
CAN ONLY VIEW reports that were published prior to Monday, April 14, 2025.
You
MUST UPGRADE YOUR MEMBERSHIP if you want to see any current reports.
AFTER MARKET UPDATE - MONDAY, JULY 12TH, 2010
Previous After Market Report Next After Market Report >>>
|
|
|
|
DOW |
+18.24 |
10,216.27 |
+0.18% |
|
Volume |
854,884,231 |
-3% |
|
Volume |
1,775,413,721 |
+14% |
|
NASDAQ |
+1.91 |
2,198.36 |
+0.09% |
|
Advancers |
1,072 |
35% |
|
Advancers |
808 |
29% |
|
S&P 500 |
+0.79 |
1,078.75 |
+0.07% |
|
Decliners |
1,896 |
61% |
|
Decliners |
1,865 |
68% |
|
Russell 2000 |
-7.82 |
621.61 |
-1.24% |
|
52 Wk Highs |
87 |
|
|
52 Wk Highs |
29 |
|
|
S&P 600 |
-3.65 |
334.91 |
-1.08% |
|
52 Wk Lows |
12 |
|
|
52 Wk Lows |
42 |
|
|
 |
Decliners Outnumber Advancers While Major Averages Edge Higher
Adam Sarhan, Contributing Writer,
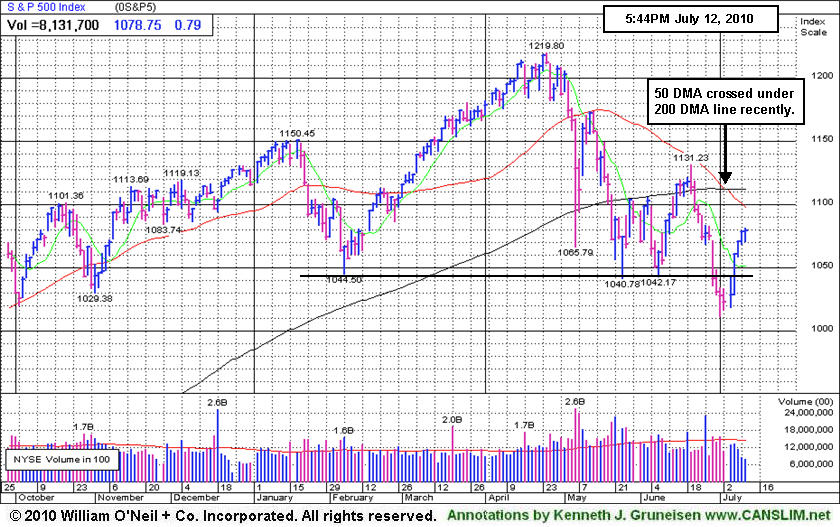
The major averages closed slightly higher after spending most of the day trading between positive and negative territory. Volume, a critical component of institutional sponsorship, was mixed: higher on the Nasdaq and lower on the NYSE. There were 21 high-ranked companies from the CANSLIM.net Leaders List that made a new 52-week high and appeared on the CANSLIM.net BreakOuts Page, higher than the 16 issues that appeared on the prior session. Decliners led advancers by nearly a 2-to-1 ratio on the NYSE and over a 2-to-1 ratio on the Nasdaq exchange. New 52-week highs outnumbered new 52-week lows on the NYSE but trailed on the Nasdaq exchange. It remains critically important for leadership (new highs) to expand if the new rally effort will prove to be a sustained market advance. If not, last Wednesday's strong move may turn out to be the latest in a string of failed rallies confirmed with follow-through days.
Earnings season officially began after Monday's closing bell when Alcoa Inc. (AA -0.64%), the first Dow component, released their Q2 results. The largest US aluminum company was profitable in Q2 and said sales rose +22%. Over the next few weeks, it will be very interesting to see how companies fared last quarter and, equally important, to see how the market reacts to the numbers. Analysts believe that Q2 earnings for S&P 500 companies rose +34%. This week alone, there will be approximately 23 companies in the S&P 500 that are slated to release their results.
Looking forward, the window is now open for disciplined investors to begin carefully buying high-ranked stocks again. The major indices' 200-day moving average (DMA) lines may act as near term resistance. Remember to remain very selective because all of the major averages are still trading below their downward sloping 50 and 200 DMA lines. It was also somewhat disconcerting to see volume remain light (below average) behind the confirming gains. It is important to note that approximately 75% of FTDs lead to new sustained rallies, while 25% fail. In addition, every major rally in market history has begun with a FTD, but not every FTD leads to a new rally. Trade accordingly.
Q2 Webcast Rewind: The Q2 2010 CANSLIM.net Webcast aired at 8PM on Wednesday, June 30, 2010. A link to the webcast has been added near the top on the Premium Membership Homepage which will allow all who have UPGRADED with a currently active premium (paid) membership to view the webcast ON DEMAND at any time. To UPGRADE now for access to the webcast and all premium reports CLICK HERE.
PICTURED: The S&P 500 Index's 50-day moving average (DMA) line recently crossed under its 200 DMA line, which was noted as a worrisome sign.
|
|
|
 |
Broker/Dealer Index Approaching Downward Trendline
Kenneth J. Gruneisen - Passed the CAN SLIM® Master's Exam
The Semiconductor Index ($SOX +1.13%) was one of Monday's session's best gainers and Internet Index ($IIX +0.64%) posted a modest gain, meanwhile the Biotechnology Index ($BTK -1.70%) lagged and the Networking Index ($NWX -0.14%) edged lower. The Broker/Dealer Index ($XBD -0.01%) held its ground and the Bank Index ($BKX +0.16%) inched higher and the Retail Index ($RLX -0.24%) inched lower. Defensive groups had a slightly negative bias as the Healthcare Index ($HMO -0.84%) and Gold & Silver Index ($XAU -0.78%) lost ground. Energy-related shares were mixed as the Integrated Oil Index ($XOI +0.59%) and the Oil Services Index ($OSX -0.29%) showed no great decisiveness.
Charts courtesy www.stockcharts.com
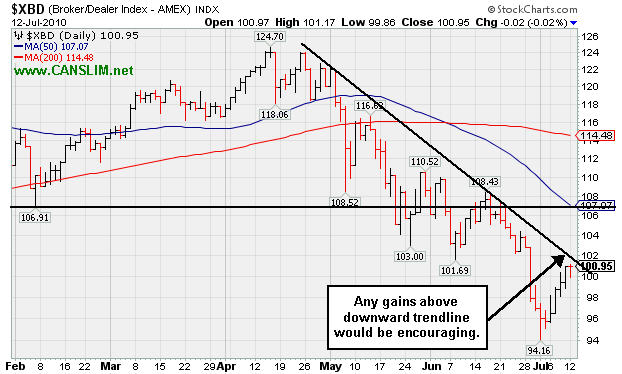
PICTURED: The Broker/Dealer Index ($XBD -0.01%) is well below its 50-day and 200-day moving average (DMA) lines. Any gains above its downward trendline would be an encouraging sign.
| Oil Services |
$OSX |
176.97 |
-0.52 |
-0.29% |
-9.21% |
| Healthcare |
$HMO |
1,408.53 |
-11.87 |
-0.84% |
-4.37% |
| Integrated Oil |
$XOI |
951.65 |
+5.58 |
+0.59% |
-10.91% |
| Semiconductor |
$SOX |
355.33 |
+3.97 |
+1.13% |
-1.27% |
| Networking |
$NWX |
228.69 |
-0.32 |
-0.14% |
-1.02% |
| Internet |
$IIX |
234.46 |
+1.49 |
+0.64% |
+0.26% |
| Broker/Dealer |
$XBD |
100.96 |
-0.01 |
-0.01% |
-12.25% |
| Retail |
$RLX |
394.41 |
-0.93 |
-0.24% |
-4.06% |
| Gold & Silver |
$XAU |
173.73 |
-1.36 |
-0.78% |
+3.26% |
| Bank |
$BKX |
49.47 |
+0.08 |
+0.16% |
+15.83% |
| Biotech |
$BTK |
1,020.08 |
-17.61 |
-1.70% |
+8.27% |
|
|
|
 |
Distributional Pressure After Failure To Trigger Buy Signal
Kenneth J. Gruneisen - Passed the CAN SLIM® Master's Exam
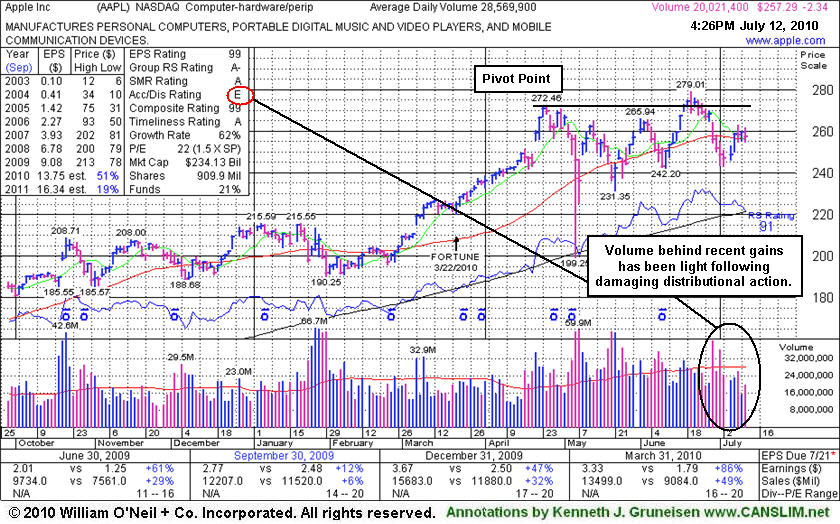
Apple Inc (AAPL -$2.34 or -0.90% to $257.29) is consolidating just above its 50-day moving average (DMA) line. Recent lows in the $242-243 area now define important chart support to watch, meanwhile it needs more time to possibly form a sound new base. Its Accumulation/Distribution rank remains at a lowest-possible E (see red circle) rating. Recent gains lacked volume after it failed to trigger a proper technical buy signal and then encountered heavy distributional pressure following its appearance in the 6/17/10 mid-day report (read here) with new pivot point cited based upon its all-time high plus ten cents. An annotated graph and more detailed analysis followed in that evening's report under the headline "Saucy Details On Apple Worth Reviewing". The article (linked to above) summarized important details and some of the prior coverage published concerning of this long-time favorite. Members who have not followed the ongoing analysis provided should take time to review what has been written.
|
|
|
Color Codes Explained :
Y - Better candidates highlighted by our
staff of experts.
G - Previously featured
in past reports as yellow but may no longer be buyable under the
guidelines.
***Last / Change / Volume data in this table is the closing quote data***
Symbol/Exchange
Company Name
Industry Group |
PRICE |
CHANGE
(%Change) |
Day High |
Volume
(% DAV)
(% 50 day avg vol) |
52 Wk Hi
% From Hi |
Featured
Date |
Price
Featured |
Pivot Featured |
|
Max Buy |
AAPL
-
NASDAQ
Apple Inc
COMPUTER HARDWARE - Personal Computers
|
$257.29
|
-2.34
-0.90% |
$261.85
|
20,072,462
69.69% of 50 DAV
50 DAV is 28,801,900
|
$279.01
-7.79%
|
6/17/2010
|
$270.95
|
PP = $272.56
|
|
MB = $286.19
|
 Most Recent Note - 7/12/2010 4:32:40 PM
G - Is consolidating just above its 50 DMA line. Recent gains lacked volume after it failed to trigger a proper technical buy signal and then encountered heavy distributional pressure. Recent lows in the $242-243 area define important chart support to watch.
>>> The latest Featured Stock Update with an annotated graph appeared on 7/12/2010. Click here.
View all notes |
Alert me of new notes |
CANSLIM.net Company Profile |
SEC |
Zacks Reports |
StockTalk |
News |
Chart |
Request a new note
C
A N
S L
I M


|
ABV
-
NYSE
Comp De Bebidas Adr
FOOD and BEVERAGE - Beverages - Brewers
|
$104.88
|
-1.92
-1.80% |
$106.60
|
380,152
50.74% of 50 DAV
50 DAV is 749,200
|
$109.33
-4.07%
|
6/29/2010
|
$104.74
|
PP = $109.33
|
|
MB = $114.80
|
Most Recent Note - 7/12/2010 4:35:14 PM
Y - Today's loss on light volume ended a streak of 6 consecutive gains for this Brazil-based beverage firm. It found support near its 50 DMA line recently and has not yet traded above its pivot point since featured in the 6/29/10 mid-day report (read here).
>>> The latest Featured Stock Update with an annotated graph appeared on 6/29/2010. Click here.
View all notes |
Alert me of new notes |
CANSLIM.net Company Profile |
SEC |
Zacks Reports |
StockTalk |
News |
Chart |
Request a new note
C
A N
S L
I M
|
BIDU
-
NASDAQ
Baidu Inc Ads
INTERNET - Internet Information Providers
|
$70.73
|
-0.47
-0.66% |
$71.78
|
8,274,126
54.76% of 50 DAV
50 DAV is 15,108,800
|
$82.29
-14.05%
|
1/13/2010
|
$43.13
|
PP = $42.68
|
|
MB = $44.81
|
Most Recent Note - 7/12/2010 4:41:47 PM
G - Consolidating below its 50 DMA line (now $71.72), while since it encountered damaging distribution its recent gains have lacked volume. Prior lows in the $66 area define important chart support.
>>> The latest Featured Stock Update with an annotated graph appeared on 6/21/2010. Click here.
View all notes |
Alert me of new notes |
CANSLIM.net Company Profile |
SEC |
Zacks Reports |
StockTalk |
News |
Chart |
Request a new note
C
A N
S L
I M
|
CISG
-
NASDAQ
Cninsure Inc Ads
INSURANCE - Insurance Brokers
|
$24.86
|
+0.13
0.53% |
$25.15
|
548,856
171.36% of 50 DAV
50 DAV is 320,300
|
$28.62
-13.14%
|
6/16/2010
|
$27.20
|
PP = $27.75
|
|
MB = $29.14
|
Most Recent Note - 7/12/2010 4:12:59 PM
G - Struggling below its 50 DMA line and -13% off its 52-week high now, it would need to rally above stubborn resistance in the $28 area for its outlook to turn bullish, technically. Based on weak action it will be dropped from the Featured Stocks list tonight. On news of a recent Stock Offering it gapped down on 7/08/10 and violated its 50 DMA line, raising concerns.
>>> The latest Featured Stock Update with an annotated graph appeared on 6/18/2010. Click here.
View all notes |
Alert me of new notes |
CANSLIM.net Company Profile |
SEC |
Zacks Reports |
StockTalk |
News |
Chart |
Request a new note
C
A N
S L
I M
|
CRM
-
NYSE
Salesforce.Com Inc
INTERNET - Internet Software and Services
|
$91.85
|
+0.07
0.08% |
$92.75
|
1,133,012
38.41% of 50 DAV
50 DAV is 2,949,700
|
$97.94
-6.22%
|
6/2/2010
|
$88.44
|
PP = $89.60
|
|
MB = $94.08
|
Most Recent Note - 7/12/2010 5:01:57 PM
Y - Rising further above its 50 DMA line today while posting a 8th consecutive gain on ever-decreasing volume. Recent low ($83.61 on 7/01/10) defines an important chart support level to watch now.
>>> The latest Featured Stock Update with an annotated graph appeared on 6/22/2010. Click here.
View all notes |
Alert me of new notes |
CANSLIM.net Company Profile |
SEC |
Zacks Reports |
StockTalk |
News |
Chart |
Request a new note
C
A N
S L
I M
|
Symbol/Exchange
Company Name
Industry Group |
PRICE |
CHANGE
(%Change) |
Day High |
Volume
(% DAV)
(% 50 day avg vol) |
52 Wk Hi
% From Hi |
Featured
Date |
Price
Featured |
Pivot Featured |
|
Max Buy |
CVLT
-
NASDAQ
Commvault Systems Inc
COMPUTER SOFTWARE and SERVICES - Business Software and Services
|
$23.47
|
+0.08
0.34% |
$23.71
|
384,728
64.65% of 50 DAV
50 DAV is 595,100
|
$24.51
-4.24%
|
7/6/2010
|
$23.16
|
PP = $24.45
|
|
MB = $25.67
|
Most Recent Note - 7/12/2010 5:02:40 PM
Y - Consolidating above its 50 and 200 DMA lines just -4.2% off its high, still building on the right side of a 6-month flat base. Featured in the 7/06/10 mid-day report (read here).
>>> The latest Featured Stock Update with an annotated graph appeared on 7/6/2010. Click here.
View all notes |
Alert me of new notes |
CANSLIM.net Company Profile |
SEC |
Zacks Reports |
StockTalk |
News |
Chart |
Request a new note
C
A N
S L
I M
|
DECK
-
NASDAQ
Deckers Outdoor Corp
CONSUMER NON-DURABLES - Textile - Apparel Footwear
|
$46.11
|
-1.05
-2.23% |
$47.63
|
1,039,439
66.96% of 50 DAV
50 DAV is 1,552,400
|
$56.12
-17.83%
|
6/11/2010
|
$157.34
|
PP = $158.57
|
|
MB = $166.50
|
Most Recent Note - 7/9/2010 4:00:00 PM
G - Struggling below its 50 DMA line which may now act as resistance, while a rally above that short-term average would help its outlook, technically. Do not be confused, as the most recent Featured Price, Pivot Point and Max Buy levels have been adjusted to account for a stock split 3:1 effective as of 7/06/10.
>>> The latest Featured Stock Update with an annotated graph appeared on 7/1/2010. Click here.
View all notes |
Alert me of new notes |
CANSLIM.net Company Profile |
SEC |
Zacks Reports |
StockTalk |
News |
Chart |
Request a new note
C
A N
S L
I M
|
FFIV
-
NASDAQ
F 5 Networks Inc
INTERNET - Internet Software and Services
|
$76.67
|
+1.44
1.91% |
$77.96
|
1,373,317
80.88% of 50 DAV
50 DAV is 1,698,000
|
$77.10
-0.56%
|
6/16/2010
|
$74.50
|
PP = $74.10
|
|
MB = $77.81
|
Most Recent Note - 7/12/2010 5:11:45 PM
Y - Gain today on light volume for a new 52-week high. Found support at its 50 DMA line last week. Recent low ($66.79 on 7/01/10) now defines a near-term chart support level to watch.
>>> The latest Featured Stock Update with an annotated graph appeared on 7/7/2010. Click here.
View all notes |
Alert me of new notes |
CANSLIM.net Company Profile |
SEC |
Zacks Reports |
StockTalk |
News |
Chart |
Request a new note
C
A N
S L
I M
|
MELI
-
NASDAQ
Mercadolibre Inc
INTERNET - Internet Software and; Services
|
$58.85
|
-0.27
-0.46% |
$59.64
|
930,601
99.48% of 50 DAV
50 DAV is 935,500
|
$62.14
-5.29%
|
5/13/2010
|
$54.21
|
PP = $55.85
|
|
MB = $58.64
|
Most Recent Note - 7/12/2010 5:13:55 PM
Y - Small loss today on average volume ended a streak of 4 gains in a row after finding support near its 50 DMA line. Its recent low ($49.55 on 7/01/10) now defines near-term chart support.
>>> The latest Featured Stock Update with an annotated graph appeared on 6/30/2010. Click here.
View all notes |
Alert me of new notes |
CANSLIM.net Company Profile |
SEC |
Zacks Reports |
StockTalk |
News |
Chart |
Request a new note
C
A N
S L
I M
|
NEM
-
NYSE
Newmont Mining Corp
METALS and MINING - Gold
|
$61.58
|
-0.35
-0.57% |
$62.50
|
6,301,408
61.67% of 50 DAV
50 DAV is 10,218,300
|
$63.38
-2.84%
|
6/22/2010
|
$59.60
|
PP = $59.67
|
|
MB = $62.65
|
Most Recent Note - 7/12/2010 5:16:45 PM
Y - Holding its ground today quietly perched near all-time highs.
>>> The latest Featured Stock Update with an annotated graph appeared on 7/9/2010. Click here.
View all notes |
Alert me of new notes |
CANSLIM.net Company Profile |
SEC |
Zacks Reports |
StockTalk |
News |
Chart |
Request a new note
C
A N
S L
I M
|
Symbol/Exchange
Company Name
Industry Group |
PRICE |
CHANGE
(%Change) |
Day High |
Volume
(% DAV)
(% 50 day avg vol) |
52 Wk Hi
% From Hi |
Featured
Date |
Price
Featured |
Pivot Featured |
|
Max Buy |
ROVI
-
NASDAQ
Rovi Corp
COMPUTER SOFTWARE andamp; SERVICES - Security Software andamp; Services
|
$41.98
|
-0.60
-1.41% |
$42.87
|
922,849
63.04% of 50 DAV
50 DAV is 1,464,000
|
$42.66
-1.59%
|
6/3/2010
|
$38.70
|
PP = $40.16
|
|
MB = $42.17
|
Most Recent Note - 7/12/2010 5:17:59 PM
G - Pulled back on lighter volume today after 4 consecutive gains. Color code was changed to green after it closed above its "max buy" level.
>>> The latest Featured Stock Update with an annotated graph appeared on 6/28/2010. Click here.
View all notes |
Alert me of new notes |
CANSLIM.net Company Profile |
SEC |
Zacks Reports |
StockTalk |
News |
Chart |
Request a new note
C
A N
S L
I M
|
THOR
-
NASDAQ
Thoratec Corp
HEALTH SERVICES - Medical Instruments and Supplies
|
$44.80
|
-0.06
-0.13% |
$44.86
|
666,288
57.15% of 50 DAV
50 DAV is 1,165,800
|
$47.93
-6.53%
|
6/3/2010
|
$44.38
|
PP = $45.35
|
|
MB = $47.62
|
Most Recent Note - 7/12/2010 5:19:18 PM
Y - Quietly consolidating above support at its a 50 DMA line, an important support level.
>>> The latest Featured Stock Update with an annotated graph appeared on 6/23/2010. Click here.
View all notes |
Alert me of new notes |
CANSLIM.net Company Profile |
SEC |
Zacks Reports |
StockTalk |
News |
Chart |
Request a new note
C
A N
S L
I M
|
ULTA
-
NASDAQ
Ulta Salon Cosm & Frag
SPECIALTY RETAIL - Specialty Retail, Other
|
$23.09
|
-0.42
-1.79% |
$23.48
|
412,348
59.80% of 50 DAV
50 DAV is 689,500
|
$26.75
-13.68%
|
5/28/2010
|
$25.58
|
PP = $25.86
|
|
MB = $27.15
|
Most Recent Note - 7/12/2010 11:27:01 AM
G - Pulling back today with light volume while its 50 DMA line has acted as recent resistance. Its May - June chart lows in the $21 area define the next support level just above its 200 DMA line.
>>> The latest Featured Stock Update with an annotated graph appeared on 6/25/2010. Click here.
View all notes |
Alert me of new notes |
CANSLIM.net Company Profile |
SEC |
Zacks Reports |
StockTalk |
News |
Chart |
Request a new note
C
A N
S L
I M
|
VIT
-
NYSE
Vanceinfo Tech Inc Ads
COMPUTER SOFTWARE and SERVICES - Business Software and Services
|
$25.63
|
-0.05
-0.19% |
$26.90
|
875,091
127.88% of 50 DAV
50 DAV is 684,300
|
$26.50
-3.28%
|
7/8/2010
|
$25.20
|
PP = $26.58
|
|
MB = $27.91
|
Most Recent Note - 7/12/2010 5:22:27 PM
Y - Its negative reversal today on higher volume and close near the session low, technically, appears to be a sign of distributional pressure near its prior high. It did not trigger a buy signal with respect to the pivot point cited after gapping up on 7/08/10, when it briefly matched its all-time high and appeared in the mid-day report (read here).
>>> The latest Featured Stock Update with an annotated graph appeared on 7/8/2010. Click here.
View all notes |
Alert me of new notes |
CANSLIM.net Company Profile |
SEC |
Zacks Reports |
StockTalk |
News |
Chart |
Request a new note
C
A N
S L
I M
|
|
|
|
THESE ARE NOT BUY RECOMMENDATIONS!
Comments contained in the body of this report are technical
opinions only. The material herein has been obtained
from sources believed to be reliable and accurate, however,
its accuracy and completeness cannot be guaranteed.
This site is not an investment advisor, hence it does
not endorse or recommend any securities or other investments.
Any recommendation contained in this report may not
be suitable for all investors and it is not to be deemed
an offer or solicitation on our part with respect to
the purchase or sale of any securities. All trademarks,
service marks and trade names appearing in this report
are the property of their respective owners, and are
likewise used for identification purposes only.
This report is a service available
only to active Paid Premium Members.
You may opt-out of receiving report notifications
at any time. Questions or comments may be submitted
by writing to Premium Membership Services 665 S.E. 10 Street, Suite 201 Deerfield Beach, FL 33441-5634 or by calling 1-800-965-8307
or 954-785-1121.
|
|
|


