You are not logged in.
This means you
CAN ONLY VIEW reports that were published prior to Monday, April 14, 2025.
You
MUST UPGRADE YOUR MEMBERSHIP if you want to see any current reports.
AFTER MARKET UPDATE - THURSDAY, JULY 11TH, 2013
Previous After Market Report Next After Market Report >>>
|
|
|
|
DOW |
+169.26 |
15,460.92 |
+1.11% |
|
Volume |
741,922,170 |
+11% |
|
Volume |
1,673,278,360 |
+11% |
|
NASDAQ |
+57.54 |
3,578.30 |
+1.63% |
|
Advancers |
2,672 |
86% |
|
Advancers |
1,803 |
70% |
|
S&P 500 |
+22.40 |
1,675.02 |
+1.36% |
|
Decliners |
399 |
13% |
|
Decliners |
719 |
28% |
|
Russell 2000 |
+12.76 |
1,033.18 |
+1.25% |
|
52 Wk Highs |
371 |
|
|
52 Wk Highs |
401 |
|
|
S&P 600 |
+5.73 |
582.68 |
+0.99% |
|
52 Wk Lows |
11 |
|
|
52 Wk Lows |
10 |
|
|
 |
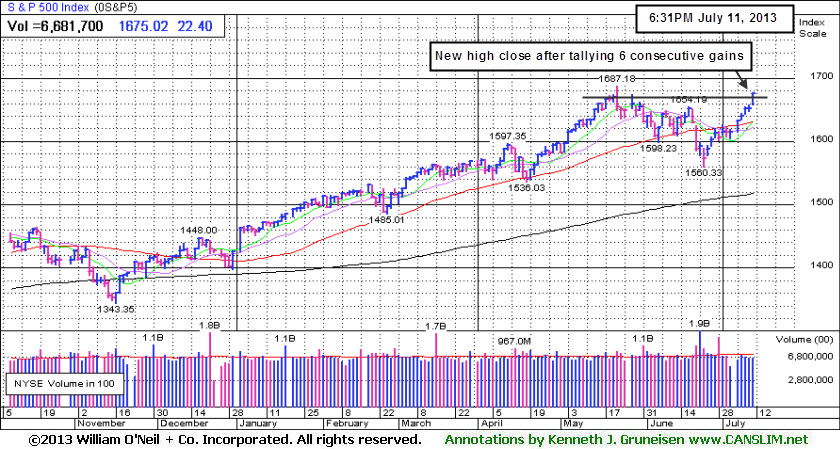
Rally Resumes as S&P 500 Index Hits New All-Time High
Kenneth J. Gruneisen - Passed the CAN SLIM® Master's Exam
The tech-heavy Nasdaq Composite Index led the major averages higher with a solid +1.6% gain as it blasted to new 2013 highs, and the S&P 500 Index ended at a new all-time high close as it rose nearly +1.4%. The bullish action signaled that the market is in a confirmed rally as the major indices' substantial gains were coupled with a great expansion in leadership (stocks new 52-week highs). The volume totals were reported higher than the prior session on the NYSE and on the Nasdaq exchange, indicating that institutional buying demand was on the rise - a key component to a proper follow-through day. Breadth was clearly positive as advancers outnumbered decliners by nearly a 3-1 margin on the Nasdaq exchange and by more than a 6-1 margin on the NYSE. There were 147 high-ranked companies from the CANSLIM.net Leaders List made new 52-week highs and appeared on the CANSLIM.net BreakOuts Page, a huge increase from the prior session total of 85 stocks. The list of stocks hitting new 52-week highs expanded and substantially outnumbered new 52-week lows on both the NYSE and the Nasdaq exchange. There were gains for 10 of the 11 high-ranked companies currently included on the Featured Stocks Page.
The major averages rallied following comments from Fed Chairman Bernanke. In a speech after Wednesday's close, Bernanke said the central bank will maintain its accommodative monetary policy for the foreseeable future. On the economic front, a report showed initial jobless claims unexpectedly rose 16,000 to 360,000 in the prior week.
All 10 sectors in the S&P 500 were higher on the session. Materials and technology were the best performing groups. Freeport McMoRan copper & Gold inc (FCX +4.55%) and Newmont Mining Corp (NEM +5.67%) bounced from their lows as gold rallied amid a weaker dollar. Microsoft Corp (MSFT +2.84%) rallied after it announced a reorganization of its business units. Homebuilders were higher, paced by a big rise in DR Horton Inc (DHI +9.17%). Yum! Brands Inc (YUM -1.15%) lagged following its latest earnings release. Bank stocks underperformed, including Regions Financial Corp (RF -2.47%). JP Morgan Chase & Co (JPM +0.57%) was up slightly ahead of its earnings release tomorrow before the open.
Treasuries extended their winning streak to a fourth session with the 10-year note up 15/32 to yield 2.57%.
The market (M criteria) has flashed substantial strength and leadership, making a favorable shift from the latest brief correction. Now in a confirmed rally, odds are considered most favorable to investors making new buying efforts. That means it is time for investors who have preserved their cash and confidence during a market downdraft to look to be proactive with buying efforts focused on the individual leaders best matching the winning models of the fact-based investment system.
Study the companies on the CANSLIM.net Featured Stocks Page - a page showing the most action-worthy candidates' latest notes and links to additional resources including detailed analysis with data-packed graphs which are annotated by a Certified expert. The Premium Member Homepage - includes "dynamic archives" to all prior pay reports published. Watch for an announcement via email concerning the next WEBCAST.
PICTURED: The benchmark S&P 500 Index rallied nearly +1.4% for a new all-time close. It is up +17.46% year-to-date.
|
 Kenneth J. Gruneisen started out as a licensed stockbroker in August 1987, a couple of months prior to the historic stock market crash that took the Dow Jones Industrial Average down -22.6% in a single day. He has published daily fact-based fundamental and technical analysis on high-ranked stocks online for two decades. Through FACTBASEDINVESTING.COM, Kenneth provides educational articles, news, market commentary, and other information regarding proven investment systems that work in good times and bad.
Comments contained in the body of this report are technical opinions only and are not necessarily those of Gruneisen Growth Corp. The material herein has been obtained from sources believed to be reliable and accurate, however, its accuracy and completeness cannot be guaranteed. Our firm, employees, and customers may effect transactions, including transactions contrary to any recommendation herein, or have positions in the securities mentioned herein or options with respect thereto. Any recommendation contained in this report may not be suitable for all investors and it is not to be deemed an offer or solicitation on our part with respect to the purchase or sale of any securities. |
|
 |
XAU Rebounds From Low; Financials Lagged Amid Broader Group Gains
Kenneth J. Gruneisen - Passed the CAN SLIM® Master's Exam
The Nasdaq Composite Index was helped to new 2013 highs by unanimous gains from the tech sector as there were big gains from the Internet Index ($IIX +1.97%), Semiconductor Index ($SOX +2.07%), Networking Index ($NWX +2.72%), and the Biotechnology Index ($BTK +2.83%). The Retail Index ($RLX +1.15%) a was a positive influence on the major averages. The Integrated Oil Index ($XOI +1.74%) outpaced the Oil Services Index ($OSX +0.38%), and the Healthcare Index ($HMO +0.51%) also posted a modest gain. Meanwhile, the Bank Index ($BKX -0.41%) edged lower and the Broker/Dealer Index ($XBD +0.16%) posted a small gain on the session while financial shares did not participate in the otherwise widespread rally.
Charts courtesy www.stockcharts.com
o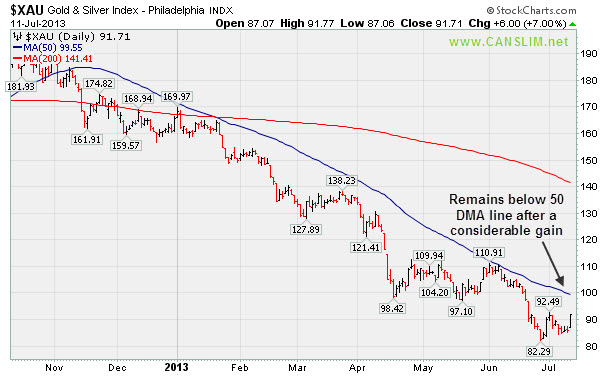
PICTURED: The Gold & Silver Index ($XAU +7.00%) was a standout gainer on Thursday while the market enjoyed broad-based gains from growth-oriented groups. However, after its big gain the XAU is still well below its 50-day moving average line. That short-term average has acted as resistance throughout its descent this year.
| Oil Services |
$OSX |
265.15 |
+1.00 |
+0.38% |
+20.44% |
| Healthcare |
$HMO |
3,335.79 |
+16.91 |
+0.51% |
+32.68% |
| Integrated Oil |
$XOI |
1,376.52 |
+23.59 |
+1.74% |
+10.85% |
| Semiconductor |
$SOX |
486.56 |
+9.86 |
+2.07% |
+26.69% |
| Networking |
$NWX |
273.16 |
+7.24 |
+2.72% |
+20.57% |
| Internet |
$IIX |
397.43 |
+7.69 |
+1.97% |
+21.54% |
| Broker/Dealer |
$XBD |
132.52 |
+0.22 |
+0.16% |
+40.49% |
| Retail |
$RLX |
836.51 |
+9.50 |
+1.15% |
+28.09% |
| Gold & Silver |
$XAU |
91.71 |
+6.00 |
+7.00% |
-44.62% |
| Bank |
$BKX |
63.67 |
-0.26 |
-0.41% |
+24.16% |
| Biotech |
$BTK |
2,125.46 |
+58.50 |
+2.83% |
+37.39% |
|
|
|
 |
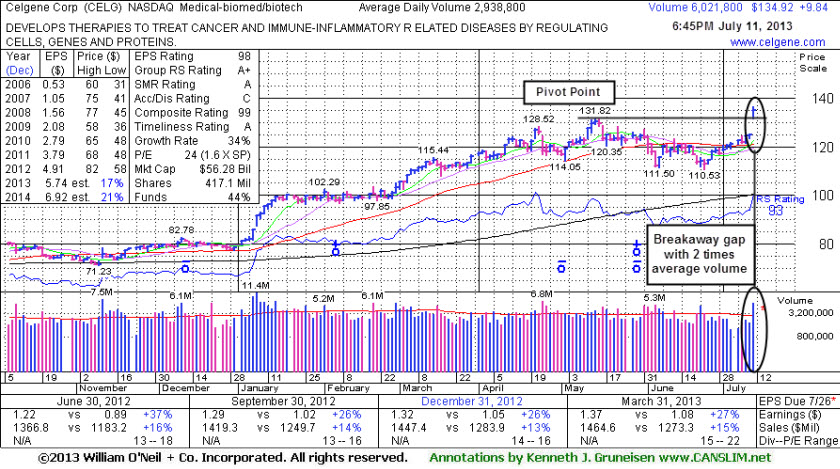
Finished Strong After Breakaway Gap to a New 52-Week High
Kenneth J. Gruneisen - Passed the CAN SLIM® Master's Exam
Celgene Corp (CELG +$9.84 or +7.87% to $134.92) was highlighted in yellow with new pivot point based on its 5/14/13 high plus 10 cent in the earlier mid-day report (read here). It gapped up today and triggered a technical buy signal with a strong finish after hitting a new 52-week high as its considerable gain was backed by twice its average daily trading volume. It rebounded above its 50-day moving average (DMA) line with recent gains lacking great volume conviction but nonetheless helping its technical stance improve. The high-ranked Medical - Biomed/Biotech firm had been sputtering since dropped from the Featured Stocks list on 6/05/13 when last shown in this FSU section under the headline, "Following 50-Day Moving Average Violation More Damage Mounts". At the time, members were reminded - "Any stock that is sold can always be bought back later if strength returns."
The stock's Accumulation/ Distribution Rating has improved to a C from a D+ rating in the interim. Today's technical buy signal was coupled with strong action in the broader market (M criteria) which encourages investors to increase their buying efforts in worthy looking candidates. CELG has maintained a strong earnings history (C and A criteria), and it recently reported earnings +27% on +15% sales revenues for the Mar '13 quarter. The number of top-rated funds owning its shares rose from 1,623 in Dec '11 to 1,850 in Jun '13, a reassuring trend concerning the I criteria. However, the company is already well-known by the institutional crowd, and that means that very few are likely to just be discovering it.
The bullish action today also came on the heels of encouraging headlines (read here) concerning one of its cancer treatments, Revlimid, which met its goal in stopping the spread of multiple myeloma when used with the steroid dexamethasone.
|
|
|
Color Codes Explained :
Y - Better candidates highlighted by our
staff of experts.
G - Previously featured
in past reports as yellow but may no longer be buyable under the
guidelines.
***Last / Change / Volume data in this table is the closing quote data***
Symbol/Exchange
Company Name
Industry Group |
PRICE |
CHANGE
(%Change) |
Day High |
Volume
(% DAV)
(% 50 day avg vol) |
52 Wk Hi
% From Hi |
Featured
Date |
Price
Featured |
Pivot Featured |
|
Max Buy |
AMBA
-
NASDAQ
Ambarella Inc
ELECTRONICS - Semiconductor - Specialized
|
$17.80
|
+0.91
5.39% |
$17.99
|
1,135,806
96.64% of 50 DAV
50 DAV is 1,175,300
|
$18.58
-4.20%
|
5/6/2013
|
$15.31
|
PP = $16.10
|
|
MB = $16.91
|
 Most Recent Note - 7/11/2013 7:35:18 PM
G - Posted a solid gain today with average volume. It is extended from a sound base and consolidating above its 50 DMA line - important chart support where a violation would trigger a worrisome technical sell signal.
>>> The latest Featured Stock Update with an annotated graph appeared on 6/27/2013. Click here.
View all notes |
Alert me of new notes |
CANSLIM.net Company Profile |
SEC |
Zacks Reports |
StockTalk |
News |
Chart |
Request a new note
C
A N
S L
I M


|
CELG
-
NASDAQ
Celgene Corp
DRUGS - Drug Manufacturers - Major
|
$134.92
|
+9.84
7.87% |
$136.36
|
6,021,824
204.91% of 50 DAV
50 DAV is 2,938,800
|
$131.82
2.35%
|
7/11/2013
|
$133.25
|
PP = $131.92
|
|
MB = $138.52
|
Most Recent Note - 7/11/2013 7:33:37 PM
Y - Breakaway gap and solid gain with twice average volume triggered a technical buy signal as it finished above the new pivot point cited based on its 5/14/13 high plus 10 cents. It has returned to the Featured Stocks list and is covered in greater detail in the latest FSU analysis with an annotated graph.
>>> The latest Featured Stock Update with an annotated graph appeared on 7/11/2013. Click here.
View all notes |
Alert me of new notes |
CANSLIM.net Company Profile |
SEC |
Zacks Reports |
StockTalk |
News |
Chart |
Request a new note
C
A N
S L
I M
|
FLT
-
NYSE
Fleetcor Technologies
DIVERSIFIED SERVICES - Business/Management Services
|
$86.65
|
+0.98
1.14% |
$87.07
|
505,212
56.93% of 50 DAV
50 DAV is 887,400
|
$89.75
-3.45%
|
5/29/2013
|
$86.02
|
PP = $85.66
|
|
MB = $89.94
|
Most Recent Note - 7/9/2013 5:50:14 PM
G- Rose from its 50 DMA line and finished near the session high with below average volume behind its gain. The recent low ($80.28 on 6/21/13) defines important near-term support where a violation would raise more serious concerns.
>>> The latest Featured Stock Update with an annotated graph appeared on 6/28/2013. Click here.
View all notes |
Alert me of new notes |
CANSLIM.net Company Profile |
SEC |
Zacks Reports |
StockTalk |
News |
Chart |
Request a new note
C
A N
S L
I M
|
LOPE
-
NASDAQ
Grand Canyon Education
DIVERSIFIED SERVICES - Education and; Training Services
|
$35.70
|
+0.60
1.71% |
$36.38
|
802,909
185.77% of 50 DAV
50 DAV is 432,200
|
$35.53
0.48%
|
6/19/2013
|
$31.47
|
PP = $34.17
|
|
MB = $35.88
|
Most Recent Note - 7/5/2013 6:36:54 PM
Y - Touched a new 52-week high but reversed into the red at the close. Subsequent volume driven gains above its pivot point may trigger a new technical buy signal. Its 50 DMA line and recent lows define support in the $30-31 area.
>>> The latest Featured Stock Update with an annotated graph appeared on 7/2/2013. Click here.
View all notes |
Alert me of new notes |
CANSLIM.net Company Profile |
SEC |
Zacks Reports |
StockTalk |
News |
Chart |
Request a new note
C
A N
S L
I M
|
PCLN
-
NASDAQ
Priceline.Com Inc
INTERNET - Internet Software and Services
|
$910.35
|
+18.03
2.02% |
$912.86
|
815,385
111.01% of 50 DAV
50 DAV is 734,500
|
$900.40
1.11%
|
7/8/2013
|
$878.28
|
PP = $847.43
|
|
MB = $889.80
|
Most Recent Note - 7/9/2013 6:27:28 PM
G - Rallied above its "max buy" level with today's 10th consecutive gain and its color code is changed to green while getting extended from its base. Prior highs in the $847 area define initial support to watch on pullbacks. See the latest FSU analysis for more details and a new annotated graph.
>>> The latest Featured Stock Update with an annotated graph appeared on 7/9/2013. Click here.
View all notes |
Alert me of new notes |
CANSLIM.net Company Profile |
SEC |
Zacks Reports |
StockTalk |
News |
Chart |
Request a new note
C
A N
S L
I M
|
Symbol/Exchange
Company Name
Industry Group |
PRICE |
CHANGE
(%Change) |
Day High |
Volume
(% DAV)
(% 50 day avg vol) |
52 Wk Hi
% From Hi |
Featured
Date |
Price
Featured |
Pivot Featured |
|
Max Buy |
PRLB
-
NYSE
Proto Labs Inc
MANUFACTURING - Small Tools and Accessories
|
$64.61
|
+1.34
2.12% |
$65.50
|
325,914
70.61% of 50 DAV
50 DAV is 461,600
|
$67.40
-4.14%
|
6/17/2013
|
$59.37
|
PP = $59.94
|
|
MB = $62.94
|
Most Recent Note - 7/8/2013 2:08:25 PM
G- Still holding its ground stubbornly near its 52-week high with volume totals cooling following a "negative reversal" on 6/28/13 with heavy volume. Prior highs near $59 define important near-term support above its 50 DMA line.
>>> The latest Featured Stock Update with an annotated graph appeared on 6/26/2013. Click here.
View all notes |
Alert me of new notes |
CANSLIM.net Company Profile |
SEC |
Zacks Reports |
StockTalk |
News |
Chart |
Request a new note
C
A N
S L
I M
|
RRTS
-
NYSE
Roadrunner Trans Systems
TRANSPORTATION - Air Delivery and Freight Service
|
$29.74
|
-0.43
-1.43% |
$30.50
|
87,929
42.36% of 50 DAV
50 DAV is 207,600
|
$30.19
-1.49%
|
4/3/2013
|
$22.77
|
PP = $23.75
|
|
MB = $24.94
|
Most Recent Note - 7/5/2013 6:32:20 PM
G - Finished at the session high and 2 cents off its best-ever close with a gain on below average volume. Wedged higher without great volume conviction after finding support above its 50 DMA line. Perched within close striking distance of its 52-week high.
>>> The latest Featured Stock Update with an annotated graph appeared on 7/3/2013. Click here.
View all notes |
Alert me of new notes |
CANSLIM.net Company Profile |
SEC |
Zacks Reports |
StockTalk |
News |
Chart |
Request a new note
C
A N
S L
I M
|
SSNC
-
NASDAQ
S S & C Technologies
COMPUTER SOFTWARE and SERVICES - Application Software
|
$36.05
|
+1.55
4.49% |
$36.18
|
1,004,332
224.43% of 50 DAV
50 DAV is 447,500
|
$34.89
3.33%
|
7/11/2013
|
$35.80
|
PP = $34.54
|
|
MB = $36.27
|
Most Recent Note - 7/11/2013 7:40:45 PM
Y - Finished near the session high following a gap up for a considerable gain backed by +124% above average volume. Cleared the pivot point based on its 5/08/13 high plus 10 cents cited in the earlier mid-day report (read here) and triggered a technical buy signal while rising from an orderly base above its 50 DMA line. Completed another Secondary Offering on 5/09/13. Noted in the 5/20/13 mid-day report - "The high-ranked Computer Software - Financial firm completed previously noted Secondary Offerings on 3/14/13 and on 7/19/12. The past 4 quarterly comparisons through Mar '13 showed earnings increases above the +25% minimum guideline (C criteria) for buy candidates and its annual earnings (A criteria) history has been strong."

There are no Featured Stock Updates™ available for this stock at this time. You may request one by clicking the Request a New Note link below
View all notes |
Alert me of new notes |
CANSLIM.net Company Profile |
SEC |
Zacks Reports |
StockTalk |
News |
Chart |
Request a new note
C
A N
S L
I M
|
SSYS
-
NASDAQ
Stratasys Ltd
COMPUTER HARDWARE - Computer Peripherals
|
$93.47
|
+0.34
0.37% |
$95.75
|
1,130,736
137.93% of 50 DAV
50 DAV is 819,800
|
$94.90
-1.51%
|
7/8/2013
|
$91.44
|
PP = $95.00
|
|
MB = $99.75
|
Most Recent Note - 7/11/2013 1:14:01 PM
Y - Touched a new 52-week high today amid widespread gains. Finished near the session high at a best-ever close with a solid gain on above average volume on the prior session when noted - "Subsequent volume-driven gains above the pivot point based on its 5/14/13 high plus 10 cents may trigger a technical buy signal. Very little resistance remains due to overhead supply."
>>> The latest Featured Stock Update with an annotated graph appeared on 7/8/2013. Click here.
View all notes |
Alert me of new notes |
CANSLIM.net Company Profile |
SEC |
Zacks Reports |
StockTalk |
News |
Chart |
Request a new note
C
A N
S L
I M
|
VRX
-
NYSE
Valeant Pharmaceuticals
DRUGS - Drug Manufacturers - Other
|
$92.47
|
+2.27
2.52% |
$92.50
|
1,727,273
84.57% of 50 DAV
50 DAV is 2,042,500
|
$96.25
-3.93%
|
4/30/2013
|
$60.24
|
PP = $76.66
|
|
MB = $80.49
|
Most Recent Note - 7/5/2013 6:33:02 PM
G- Holding its ground since completing a new Public Offering on 6/18/13 following recent M&A news. Concerns were raised by its sub par Mar '13 earnings report. See the latest FSU analysis for more details and a new annotated graph.
>>> The latest Featured Stock Update with an annotated graph appeared on 7/5/2013. Click here.
View all notes |
Alert me of new notes |
CANSLIM.net Company Profile |
SEC |
Zacks Reports |
StockTalk |
News |
Chart |
Request a new note
C
A N
S L
I M
|
Symbol/Exchange
Company Name
Industry Group |
PRICE |
CHANGE
(%Change) |
Day High |
Volume
(% DAV)
(% 50 day avg vol) |
52 Wk Hi
% From Hi |
Featured
Date |
Price
Featured |
Pivot Featured |
|
Max Buy |
YNDX
-
NASDAQ
Yandex N V Class A
INTERNET - Internet Information Providers
|
$30.39
|
+0.90
3.05% |
$30.68
|
5,242,393
230.28% of 50 DAV
50 DAV is 2,276,500
|
$29.78
2.05%
|
7/10/2013
|
$29.29
|
PP = $29.59
|
|
MB = $31.07
|
Most Recent Note - 7/11/2013 7:43:53 PM
Y - Gapped up and hit a new 52-week high with +130% above average volume behind today's 5th consecutive gain triggering a technical buy signal while rallying above its pivot point. An annotated weekly graph was included in the 7/10/13 mid-day report (read here) and it was noted that evening - "Additional volume-driven gains above its pivot point may trigger a proper technical buy signal. It has earned high ranks and maintained a strong quarterly and annual earnings history (C and A criteria). The number of top-rated funds owning its shares rose from 276 in Sep '12 to 403 in Jun '13, a reassuring sign concerning the I criteria. See the latest FSU analysis for more details and an annotated daily graph."
>>> The latest Featured Stock Update with an annotated graph appeared on 7/10/2013. Click here.
View all notes |
Alert me of new notes |
CANSLIM.net Company Profile |
SEC |
Zacks Reports |
StockTalk |
News |
Chart |
Request a new note
C
A N
S L
I M
|
|
|
|
THESE ARE NOT BUY RECOMMENDATIONS!
Comments contained in the body of this report are technical
opinions only. The material herein has been obtained
from sources believed to be reliable and accurate, however,
its accuracy and completeness cannot be guaranteed.
This site is not an investment advisor, hence it does
not endorse or recommend any securities or other investments.
Any recommendation contained in this report may not
be suitable for all investors and it is not to be deemed
an offer or solicitation on our part with respect to
the purchase or sale of any securities. All trademarks,
service marks and trade names appearing in this report
are the property of their respective owners, and are
likewise used for identification purposes only.
This report is a service available
only to active Paid Premium Members.
You may opt-out of receiving report notifications
at any time. Questions or comments may be submitted
by writing to Premium Membership Services 665 S.E. 10 Street, Suite 201 Deerfield Beach, FL 33441-5634 or by calling 1-800-965-8307
or 954-785-1121.
|
|
|

