You are not logged in.
This means you
CAN ONLY VIEW reports that were published prior to Monday, April 14, 2025.
You
MUST UPGRADE YOUR MEMBERSHIP if you want to see any current reports.
AFTER MARKET UPDATE - WEDNESDAY, JULY 11TH, 2012
Previous After Market Report Next After Market Report >>>
|
|
|
|
DOW |
-48.59 |
12,604.53 |
-0.38% |
|
Volume |
768,028,020 |
+6% |
|
Volume |
1,570,173,410 |
-5% |
|
NASDAQ |
-14.35 |
2,887.98 |
-0.49% |
|
Advancers |
1,598 |
50% |
|
Advancers |
1,215 |
47% |
|
S&P 500 |
-0.02 |
1,341.45 |
-0.00% |
|
Decliners |
1,479 |
46% |
|
Decliners |
1,233 |
48% |
|
Russell 2000 |
-2.91 |
792.26 |
-0.37% |
|
52 Wk Highs |
113 |
|
|
52 Wk Highs |
58 |
|
|
S&P 600 |
-1.54 |
441.55 |
-0.35% |
|
52 Wk Lows |
30 |
|
|
52 Wk Lows |
50 |
|
|
 |
Dow and S&P 500 Index Fall for 5th Consecutive Session
Kenneth J. Gruneisen - Passed the CAN SLIM® Master's Exam
On Wednesday the major averages fell again, extending the Dow Jones Industrial Average's losing streak to a 5th consecutive session. Behind the indices' losses the volume totals were mixed, higher on the NYSE versus the prior session, yet lower on the Nasdaq exchange. Advancers and decliners were very evenly mixed on both the NYSE and on the Nasdaq exchange. The total number of new 52-week highs led new 52-week lows on the NYSE and on the Nasdaq exchange. There were 16 high-ranked companies from the CANSLIM.net Leaders List made new 52-week highs and appeared on the CANSLIM.net BreakOuts Page, down from the prior session total of 53 stocks. At the session's close there were gains for only 5 of the 19 high-ranked companies currently included on the Featured Stocks Page.
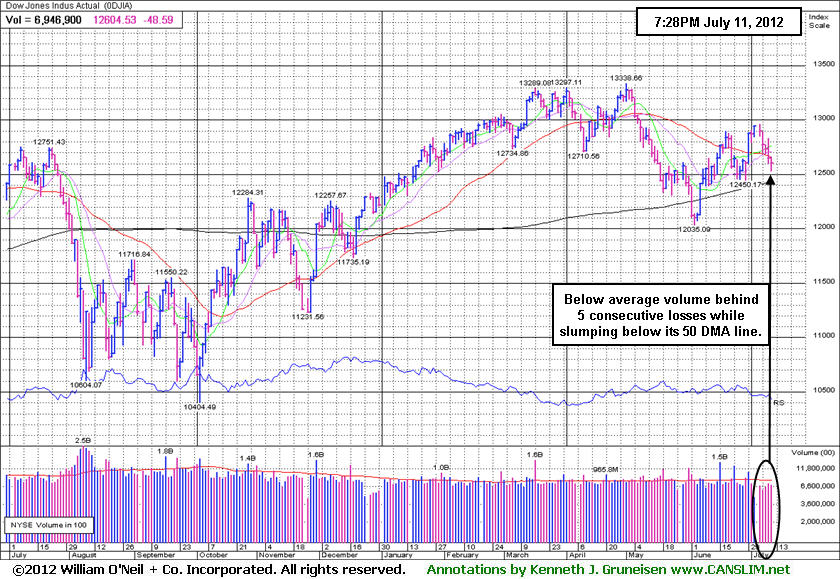
The major averages spent most of session trading between gains and losses ahead of the release of the minutes from June FOMC meeting. Stocks dropped following the release and the dollar hit a two-year high against the euro after minutes from the Federal Reserve's June meeting showed any additional bond buying by the Fed was likely to happen only if the U.S. economy gets weaker. Negative corporate outlooks were also a headwind for the market. Shares of Best Buy Inc (BBY -8.37%) fell after competitor HH Gregg lowered its full-year forecasts. Goldcorp Inc (GG -9.74%) retreated after the miner cut its 2012 gold production forecast. Technology was the worst performing sector with Google Inc (GOOG -1.81%) falling. Energy stocks were the best performing group as oil advanced. Shares of Exxon Mobil Corp (XOM +1.53%) and Chevron Corp (CVX +0.93%) gained ground.
The upward trend concerning the M criteria has come under some recent pressure, however, investors should note that new buying efforts are still encouraged under the fact-based system. Action may only be justified in worthy buy candidates with strong fundamental and technical characteristics matching all key investment criteria. As always, disciplined investors avoid chasing extended stocks, and they limit losses if any stock ever falls more than -7% from its purchase price. The best buy candidates identified by CANSLIM.net's experts are always viewable on the Featured Stocks page.
The Q2 2012 WEBCAST is available "ON DEMAND" - CLICK HERE. Upgraded members now get access to these informative *Quarterly Webcasts included at no additional cost. (*Previously sold separately at $99 per webcast.) Links to archived webcasts and all prior reports are on the Premium Member Homepage.
PICTURED: The Dow Jones Industrial Average fell for a 5th consecutive loss on below average volume, slumping under its 50-day moving average (DMA) line. Volume totals were above average behind prior gains after it found support near its longer term 200 DMA line and halted the prior market "correction". More damaging losses on above average volume would be a more worrisome sign of institutional selling pressure
|
 Kenneth J. Gruneisen started out as a licensed stockbroker in August 1987, a couple of months prior to the historic stock market crash that took the Dow Jones Industrial Average down -22.6% in a single day. He has published daily fact-based fundamental and technical analysis on high-ranked stocks online for two decades. Through FACTBASEDINVESTING.COM, Kenneth provides educational articles, news, market commentary, and other information regarding proven investment systems that work in good times and bad.
Comments contained in the body of this report are technical opinions only and are not necessarily those of Gruneisen Growth Corp. The material herein has been obtained from sources believed to be reliable and accurate, however, its accuracy and completeness cannot be guaranteed. Our firm, employees, and customers may effect transactions, including transactions contrary to any recommendation herein, or have positions in the securities mentioned herein or options with respect thereto. Any recommendation contained in this report may not be suitable for all investors and it is not to be deemed an offer or solicitation on our part with respect to the purchase or sale of any securities. |
|
 |
Financial and Energy-Related Groups Led Gainers
Kenneth J. Gruneisen - Passed the CAN SLIM® Master's Exam
The financial group had a positive bias as the Broker/Dealer Index ($XBD +0.92%) and Bank Index ($BKX +1.21%) tallied gains. Energy-related shares rose and helped the Integrated Oil Index ($XOI +1.52%) and the Oil Services Index ($OSX +1.78%) tallied gains. The Healthcare Index ($HMO +0.61%) posted a modest gain. The tech sector had a negative bias as the Networking Index ($NWX -1.57%), Biotechnology Index ($BTK -1.25%), Semiconductor Index ($SOX -0.92%), and the Internet Index ($IIX -0.55%) again finished with unanimous losses. The Retail Index ($RLX -0.85%) also was a negative influence on the major averages. The Gold & Silver Index ($XAU -1.75%) slumped again, further punishing defensively positioned investors.
Charts courtesy www.stockcharts.com
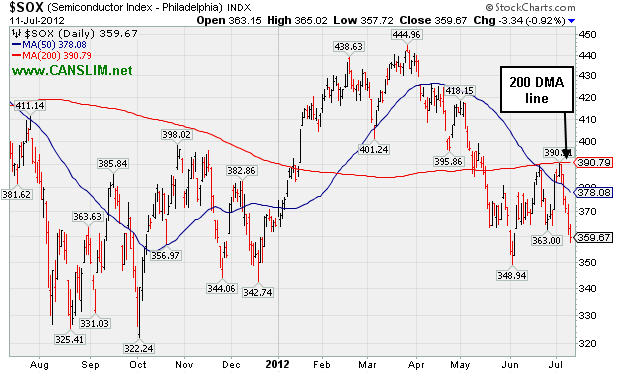
PICTURED: The Semiconductor Index ($SOX -0.92%) recently ran into resistance at its 200-day moving average (DMA) line and it is slumping toward its 2012 lows.
| Oil Services |
$OSX |
202.89 |
+3.54 |
+1.78% |
-6.19% |
| Healthcare |
$HMO |
2,391.07 |
+14.61 |
+0.61% |
+4.80% |
| Integrated Oil |
$XOI |
1,157.67 |
+17.32 |
+1.52% |
-5.81% |
| Semiconductor |
$SOX |
359.67 |
-3.34 |
-0.92% |
-1.31% |
| Networking |
$NWX |
198.04 |
-3.16 |
-1.57% |
-7.96% |
| Internet |
$IIX |
289.36 |
-1.61 |
-0.55% |
+2.70% |
| Broker/Dealer |
$XBD |
84.95 |
+0.77 |
+0.92% |
+2.02% |
| Retail |
$RLX |
606.47 |
-5.21 |
-0.85% |
+15.92% |
| Gold & Silver |
$XAU |
148.53 |
-2.65 |
-1.75% |
-17.78% |
| Bank |
$BKX |
45.09 |
+0.54 |
+1.21% |
+14.50% |
| Biotech |
$BTK |
1,454.30 |
-18.44 |
-1.25% |
+33.25% |
|
|
|
 |
Healthy Action Following Latest Breakout
Kenneth J. Gruneisen - Passed the CAN SLIM® Master's Exam
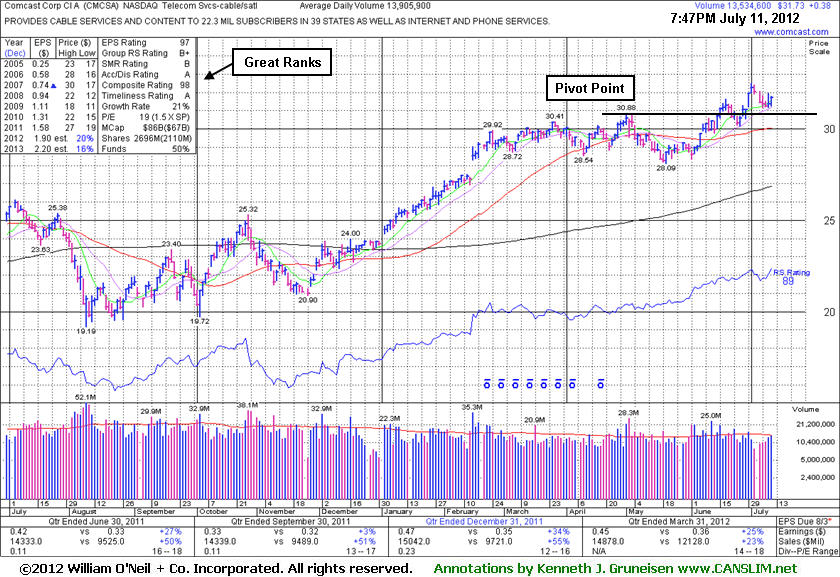
Comcast Corp Cl A (CMCSA +$0.38 or +1.21% to $31.73) has still been consolidating in a tight range near its 52-week high, holding ground above its pivot point. No overhead supply remains to act as resistance and it is still trading below its "max buy" level. Its last appearance in this FSU section with an annotated daily graph was on 6/11/12 under the headline, "New Pivot Point Cited as Resilient Leader Challenges Highs". Subsequent volume-driven gains above its pivot point triggered a new (or add-on) technical buy signal. Its prior highs and 50-day moving average (DMA) line now define important near-term chart support levels to watch on pullbacks. Healthy stocks do not usually slump more than -7% below their pivot point in a bullish market environment. Keep in mind that 3 out of 4 stocks follow along in the direction of the major averages (M criteria).
It recently reported earnings +25% on +23% sales for the quarter ended March 31, 2012 versus the year ago period. The 3 prior quarterly comparisons (through Dec '11) showed sales revenues increases above the year ago periods by +50%, and earnings increases were above the +25% guideline (C criteria) in 3 of the past 4 comparisons. Its annual earnings (A criteria) history has been strong. The number of top-rated funds owning its shares rose from 1,916 in Jun '11 to 2,014 in Mar '12, a reassuring sign concerning the I criteria. Leadership from other firms in the Telecom Services - Cable/Satellite industry group is a reassuring sign concerning the L criteria. Its huge supply of 2.088 billion shares in the float could make it less likely to be a great sprinter, meanwhile, the S criteria calls for investors to usually look at small-cap or mid-cap companies.
|
|
|
Color Codes Explained :
Y - Better candidates highlighted by our
staff of experts.
G - Previously featured
in past reports as yellow but may no longer be buyable under the
guidelines.
***Last / Change / Volume data in this table is the closing quote data***
Symbol/Exchange
Company Name
Industry Group |
PRICE |
CHANGE
(%Change) |
Day High |
Volume
(% DAV)
(% 50 day avg vol) |
52 Wk Hi
% From Hi |
Featured
Date |
Price
Featured |
Pivot Featured |
|
Max Buy |
ALXN
-
NASDAQ
Alexion Pharmaceuticals
DRUGS - Drug Manufacturers - Other
|
$96.68
|
-1.43
-1.46% |
$98.28
|
1,544,931
70.37% of 50 DAV
50 DAV is 2,195,400
|
$104.38
-7.38%
|
5/1/2012
|
$91.73
|
PP = $95.11
|
|
MB = $99.87
|
Most Recent Note - 7/10/2012 4:49:04 PM
Y - Color code is changed to yellow after quietly pulling back below its "max buy" level today with a 5th consecutive loss on below average volume. Prior highs in the $95 area define support to watch on pullbacks.
>>> The latest Featured Stock Update with an annotated graph appeared on 6/29/2012. Click here.
View all notes |
Alert me of new notes |
CANSLIM.net Company Profile |
SEC |
Zacks Reports |
StockTalk |
News |
Chart |
Request a new note
C
A N
S L
I M


|
ASPS
-
NASDAQ
Altisource Ptf Sltns Sa
REAL ESTATE - Property Management/Developmen
|
$73.37
|
+0.21
0.29% |
$73.69
|
64,563
48.95% of 50 DAV
50 DAV is 131,900
|
$76.20
-3.71%
|
6/5/2012
|
$60.01
|
PP = $63.00
|
|
MB = $66.15
|
Most Recent Note - 7/9/2012 4:44:22 PM
G - Still stubbornly holding its ground near its 52-week high, extended from its prior base. Prior highs in the $65 area define support to watch on pullbacks.
>>> The latest Featured Stock Update with an annotated graph appeared on 7/3/2012. Click here.
View all notes |
Alert me of new notes |
CANSLIM.net Company Profile |
SEC |
Zacks Reports |
StockTalk |
News |
Chart |
Request a new note
C
A N
S L
I M
|
CERN
-
NASDAQ
Cerner Corp
COMPUTER SOFTWARE and SERVICES - Healthcare Information Service
|
$80.58
|
-1.24
-1.52% |
$81.80
|
1,253,002
83.38% of 50 DAV
50 DAV is 1,502,800
|
$88.32
-8.76%
|
6/7/2012
|
$78.36
|
PP = $84.20
|
|
MB = $88.41
|
Most Recent Note - 7/9/2012 7:00:02 PM
G - Holding its ground since rebounding back above its 50 DMA line helping its technical stance. It has not formed a proper base since negating its prior breakout. See the latest FSU analysis for more details and a new annotated daily graph.
>>> The latest Featured Stock Update with an annotated graph appeared on 7/9/2012. Click here.
View all notes |
Alert me of new notes |
CANSLIM.net Company Profile |
SEC |
Zacks Reports |
StockTalk |
News |
Chart |
Request a new note
C
A N
S L
I M
|
CMCSA
-
NASDAQ
Comcast Corp Cl A
MEDIA - CATV Systems
|
$31.73
|
+0.38
1.21% |
$31.81
|
14,069,300
101.18% of 50 DAV
50 DAV is 13,905,900
|
$32.50
-2.37%
|
6/11/2012
|
$29.94
|
PP = $30.98
|
|
MB = $32.53
|
 Most Recent Note - 7/11/2012 8:06:55 PM
Y - Still consolidating in a tight range near its 52-week high, holding ground above its pivot point. No overhead supply remains to act as resistance and it is still trading below its "max buy" level. See the latest FSU analysis for more details and a new annotated graph.
>>> The latest Featured Stock Update with an annotated graph appeared on 7/11/2012. Click here.
View all notes |
Alert me of new notes |
CANSLIM.net Company Profile |
SEC |
Zacks Reports |
StockTalk |
News |
Chart |
Request a new note
C
A N
S L
I M
|
CSTR
-
NASDAQ
Coinstar Inc
DIVERSIFIED SERVICES - Personal Services
|
$66.25
|
-0.75
-1.12% |
$68.11
|
1,021,391
98.99% of 50 DAV
50 DAV is 1,031,800
|
$71.82
-7.76%
|
6/26/2012
|
$64.05
|
PP = $67.00
|
|
MB = $70.35
|
Most Recent Note - 7/10/2012 4:50:49 PM
Y - Pulled back today to its pivot point with slightly higher volume behind its 3rd consecutive loss. Disciplined investors always limit losses by selling if any stock falls more than -7% from their purchase price.
>>> The latest Featured Stock Update with an annotated graph appeared on 6/26/2012. Click here.
View all notes |
Alert me of new notes |
CANSLIM.net Company Profile |
SEC |
Zacks Reports |
StockTalk |
News |
Chart |
Request a new note
C
A N
S L
I M
|
Symbol/Exchange
Company Name
Industry Group |
PRICE |
CHANGE
(%Change) |
Day High |
Volume
(% DAV)
(% 50 day avg vol) |
52 Wk Hi
% From Hi |
Featured
Date |
Price
Featured |
Pivot Featured |
|
Max Buy |
DG
-
NYSE
Dollar General Corp
RETAIL - Discount, Variety Stores
|
$54.92
|
-0.68
-1.22% |
$55.56
|
1,896,234
50.04% of 50 DAV
50 DAV is 3,789,600
|
$56.04
-2.00%
|
5/7/2012
|
$48.51
|
PP = $47.69
|
|
MB = $50.07
|
Most Recent Note - 7/5/2012 4:00:34 PM
G - Posted a small gain today with average volume, hovering near its all-time high, extended from its prior base. Completed another Secondary Offering on 6/05/12, its 4th Secondary Offering since September '11.
>>> The latest Featured Stock Update with an annotated graph appeared on 6/12/2012. Click here.
View all notes |
Alert me of new notes |
CANSLIM.net Company Profile |
SEC |
Zacks Reports |
StockTalk |
News |
Chart |
Request a new note
C
A N
S L
I M
|
ECHO
-
NASDAQ
Echo Global Logistics
DIVERSIFIED SERVICES - Business/Management Services
|
$19.02
|
+0.02
0.11% |
$19.19
|
212,538
181.66% of 50 DAV
50 DAV is 117,000
|
$19.48
-2.36%
|
6/22/2012
|
$18.98
|
PP = $19.48
|
|
MB = $20.45
|
Most Recent Note - 7/11/2012 12:01:53 PM
Y - Holding its ground today after 4 consecutive small gains. Recent volume-driven gains were followed by a gap down on 7/03/12 with higher volume after not quite triggering a technical buy signal under the fact-based system.
>>> The latest Featured Stock Update with an annotated graph appeared on 6/22/2012. Click here.
View all notes |
Alert me of new notes |
CANSLIM.net Company Profile |
SEC |
Zacks Reports |
StockTalk |
News |
Chart |
Request a new note
C
A N
S L
I M
|
EXPE
-
NASDAQ
Expedia Inc
INTERNET - Internet Information Providers
|
$45.61
|
-0.11
-0.24% |
$46.23
|
2,343,063
56.01% of 50 DAV
50 DAV is 4,183,200
|
$50.66
-9.97%
|
4/27/2012
|
$41.80
|
PP = $35.57
|
|
MB = $37.35
|
Most Recent Note - 7/10/2012 4:44:04 PM
G - Slumped with higher volume today for its 5th consecutive loss, testing important support at its 50 DMA line. It is extended from its prior highs in the $43 area which define support below that important short-term average.
>>> The latest Featured Stock Update with an annotated graph appeared on 7/10/2012. Click here.
View all notes |
Alert me of new notes |
CANSLIM.net Company Profile |
SEC |
Zacks Reports |
StockTalk |
News |
Chart |
Request a new note
C
A N
S L
I M
|
GNC
-
NYSE
G N C Holdings Inc
RETAIL - Drug Stores
|
$38.87
|
-1.02
-2.56% |
$39.89
|
2,297,518
96.33% of 50 DAV
50 DAV is 2,385,100
|
$42.70
-8.97%
|
6/29/2012
|
$39.20
|
PP = $40.00
|
|
MB = $42.00
|
Most Recent Note - 7/11/2012 2:47:31 PM
Y - Loss today has it slumping below its pivot point and trading near its 50 DMA line. Disciplined investors always limit losses if any stock falls more than -7% from their purchase price.
>>> The latest Featured Stock Update with an annotated graph appeared on 7/5/2012. Click here.
View all notes |
Alert me of new notes |
CANSLIM.net Company Profile |
SEC |
Zacks Reports |
StockTalk |
News |
Chart |
Request a new note
C
A N
S L
I M
|
GPX
-
NYSE
G P Strategies Corp
DIVERSIFIED SERVICES - Education and Training Services
|
$17.38
|
-0.46
-2.58% |
$17.88
|
43,222
75.83% of 50 DAV
50 DAV is 57,000
|
$18.99
-8.48%
|
6/29/2012
|
$18.01
|
PP = $18.15
|
|
MB = $19.06
|
Most Recent Note - 7/11/2012 2:50:10 PM
Y - Today's loss on lighter volume has it slumping further below its old high close. Losses completely negated the recent breakout and raised concerns. Disciplined investors always limit losses by selling any stock if it falls more than -7% from their purchase price.
>>> The latest Featured Stock Update with an annotated graph appeared on 7/6/2012. Click here.
View all notes |
Alert me of new notes |
CANSLIM.net Company Profile |
SEC |
Zacks Reports |
StockTalk |
News |
Chart |
Request a new note
C
A N
S L
I M
|
Symbol/Exchange
Company Name
Industry Group |
PRICE |
CHANGE
(%Change) |
Day High |
Volume
(% DAV)
(% 50 day avg vol) |
52 Wk Hi
% From Hi |
Featured
Date |
Price
Featured |
Pivot Featured |
|
Max Buy |
MLNX
-
NASDAQ
Mellanox Technologies
ELECTRONICS - Semiconductor - Broad Line
|
$66.20
|
-2.83
-4.10% |
$69.32
|
1,455,177
243.83% of 50 DAV
50 DAV is 596,800
|
$77.69
-14.79%
|
6/18/2012
|
$70.90
|
PP = $67.30
|
|
MB = $70.67
|
Most Recent Note - 7/11/2012 2:45:29 PM
G - Pulling back for a damaging 4th consecutive loss today with ever-increasing volume, undercutting its pivot point and raising concerns. Recent chart lows define important support to watch nearly coinciding with its 50 DMA line.
>>> The latest Featured Stock Update with an annotated graph appeared on 6/25/2012. Click here.
View all notes |
Alert me of new notes |
CANSLIM.net Company Profile |
SEC |
Zacks Reports |
StockTalk |
News |
Chart |
Request a new note
C
A N
S L
I M
|
N
-
NYSE
Netsuite Inc
DIVERSIFIED SERVICES - Business/Management Services
|
$49.35
|
-0.73
-1.46% |
$50.26
|
791,131
145.43% of 50 DAV
50 DAV is 544,000
|
$56.06
-11.97%
|
6/20/2012
|
$51.83
|
PP = $51.88
|
|
MB = $54.47
|
Most Recent Note - 7/10/2012 4:52:56 PM
Y - Above average volume was behind today's 4th consecutive damaging loss. It undercut its pivot point and negated its recent breakout raising concerns. Disciplined investors always limit losses by selling if any stock falls more than -7% from their purchase price.
>>> The latest Featured Stock Update with an annotated graph appeared on 6/20/2012. Click here.
View all notes |
Alert me of new notes |
CANSLIM.net Company Profile |
SEC |
Zacks Reports |
StockTalk |
News |
Chart |
Request a new note
C
A N
S L
I M
|
NSM
-
NYSE
Nationstar Mtg Hldgs Inc
FINANCIAL SERVICES - Credit Services
|
$24.35
|
+0.05
0.21% |
$24.54
|
518,690
66.06% of 50 DAV
50 DAV is 785,200
|
$24.78
-1.74%
|
6/27/2012
|
$20.29
|
PP = $20.46
|
|
MB = $21.48
|
Most Recent Note - 7/9/2012 4:57:51 PM
G - Hit yet another new 52-week high today with lighter volume behind an 8th consecutive gain, getting more extended from its prior base. Prior highs in the $20 area define important support to watch on pullbacks.
>>> The latest Featured Stock Update with an annotated graph appeared on 6/27/2012. Click here.
View all notes |
Alert me of new notes |
CANSLIM.net Company Profile |
SEC |
Zacks Reports |
StockTalk |
News |
Chart |
Request a new note
C
A N
S L
I M
|
NTES
-
NASDAQ
Netease Inc Adr
INTERNET - Internet Information Providers
|
$57.43
|
-0.48
-0.83% |
$58.48
|
450,073
61.12% of 50 DAV
50 DAV is 736,400
|
$65.54
-12.37%
|
3/19/2012
|
$56.18
|
PP = $55.10
|
|
MB = $57.86
|
Most Recent Note - 7/9/2012 4:59:39 PM
G - Sank below its 50 DMA line with today's loss on lighter volume again hurting its technical stance. Chart support to watch is near prior lows in the $55 area.
>>> The latest Featured Stock Update with an annotated graph appeared on 6/19/2012. Click here.
View all notes |
Alert me of new notes |
CANSLIM.net Company Profile |
SEC |
Zacks Reports |
StockTalk |
News |
Chart |
Request a new note
C
A N
S L
I M
|
SXCI
-
NASDAQ
S X C Health Solutions
COMPUTER SOFTWARE and SERVICES - Healthcare Information Service
|
$94.97
|
+1.95
2.10% |
$94.97
|
558,638
46.64% of 50 DAV
50 DAV is 1,197,700
|
$104.79
-9.37%
|
6/14/2012
|
$94.71
|
PP = $100.60
|
|
MB = $105.63
|
Most Recent Note - 7/11/2012 6:18:41 PM
Y - SXC Health Solutions and Catalyst Health Solutions completed the previously noted merger and are now Catamaran Corp (CTRX). SXCI was last noted on 7/10/12 - "Ended near the session low today, testing its 50 DMA line with its 6th consecutive small loss. Churning above average volume recently while not making headway above its pivot point. Reversed and closed in the red after trading up on a few prior sessions, and the "negative reversals" were noted as signs of distributional pressure."
There are no Featured Stock Updates™ available for this stock at this time. You may request one by clicking the Request a New Note link below
View all notes |
Alert me of new notes |
CANSLIM.net Company Profile |
SEC |
Zacks Reports |
StockTalk |
News |
Chart |
Request a new note
C
A N
S L
I M
|
Symbol/Exchange
Company Name
Industry Group |
PRICE |
CHANGE
(%Change) |
Day High |
Volume
(% DAV)
(% 50 day avg vol) |
52 Wk Hi
% From Hi |
Featured
Date |
Price
Featured |
Pivot Featured |
|
Max Buy |
TDG
-
NYSE
Transdigm Group Inc
AEROSPACE/DEFENSE - Aerospace/Defense Products and; Services
|
$127.73
|
-2.30
-1.77% |
$130.48
|
205,890
38.06% of 50 DAV
50 DAV is 540,900
|
$136.34
-6.31%
|
6/18/2012
|
$127.00
|
PP = $132.79
|
|
MB = $139.43
|
Most Recent Note - 7/10/2012 4:59:03 PM
Y - Reversed early gains today and closed near the session low with a loss on light volume. It has held its ground since recently noted when its 6/29/12 gain above its pivot point was backed by only +32% above average volume, below the minimum threshold need to trigger a proper new (or add-on) technical buy signal. Its 50 DMA line defines important support to watch.
>>> The latest Featured Stock Update with an annotated graph appeared on 6/18/2012. Click here.
View all notes |
Alert me of new notes |
CANSLIM.net Company Profile |
SEC |
Zacks Reports |
StockTalk |
News |
Chart |
Request a new note
C
A N
S L
I M
|
TNGO
-
NASDAQ
Tangoe Inc
COMPUTER SOFTWARE and SERVICES - Technical and System Software
|
$19.98
|
-0.86
-4.13% |
$21.22
|
279,396
51.73% of 50 DAV
50 DAV is 540,100
|
$23.05
-13.32%
|
6/27/2012
|
$21.70
|
PP = $23.15
|
|
MB = $24.31
|
Most Recent Note - 7/11/2012 8:05:34 PM
G - Slumped under its 50 DMA line today with a 5th consecutive loss on light volume, and its color code is changed to green. Gains back above that important short-term average are needed to help its outlook, and gains above the pivot point backed by +40% above average volume or greater could trigger a new technical buy signal.
>>> The latest Featured Stock Update with an annotated graph appeared on 6/28/2012. Click here.
View all notes |
Alert me of new notes |
CANSLIM.net Company Profile |
SEC |
Zacks Reports |
StockTalk |
News |
Chart |
Request a new note
C
A N
S L
I M
|
VSI
-
NYSE
Vitamin Shoppe Inc
SPECIALTY RETAIL - Specialty Retail, Other
|
$55.90
|
-1.24
-2.17% |
$57.10
|
289,990
56.03% of 50 DAV
50 DAV is 517,600
|
$58.22
-3.98%
|
6/29/2012
|
$54.93
|
PP = $55.03
|
|
MB = $57.78
|
Most Recent Note - 7/11/2012 2:51:27 PM
Y - Pulling back today from its 52-week high hit on the prior session. Recent gains helped it trade above the new pivot point based on its 6/22/12 high after forming an 8-week cup-with-handle base, but the gains have lacked the volume required to trigger a proper new (or add-on) technical buy signal.
>>> The latest Featured Stock Update with an annotated graph appeared on 7/2/2012. Click here.
View all notes |
Alert me of new notes |
CANSLIM.net Company Profile |
SEC |
Zacks Reports |
StockTalk |
News |
Chart |
Request a new note
C
A N
S L
I M
|
WFM
-
NASDAQ
Whole Foods Market Inc
RETAIL - Grocery Stores
|
$93.70
|
-1.42
-1.49% |
$95.44
|
1,362,099
67.54% of 50 DAV
50 DAV is 2,016,600
|
$97.25
-3.65%
|
6/13/2012
|
$89.90
|
PP = $91.60
|
|
MB = $96.18
|
Most Recent Note - 7/5/2012 1:12:05 PM
G - Color code is changed to green after inching above its "max buy" level. Recently hovering near its 52-week high with no resistance remaining due to overhead supply. Its prior highs in the $91.50 area define initial support to watch on pullbacks.
>>> The latest Featured Stock Update with an annotated graph appeared on 6/13/2012. Click here.
View all notes |
Alert me of new notes |
CANSLIM.net Company Profile |
SEC |
Zacks Reports |
StockTalk |
News |
Chart |
Request a new note
C
A N
S L
I M
|
|
|
|
THESE ARE NOT BUY RECOMMENDATIONS!
Comments contained in the body of this report are technical
opinions only. The material herein has been obtained
from sources believed to be reliable and accurate, however,
its accuracy and completeness cannot be guaranteed.
This site is not an investment advisor, hence it does
not endorse or recommend any securities or other investments.
Any recommendation contained in this report may not
be suitable for all investors and it is not to be deemed
an offer or solicitation on our part with respect to
the purchase or sale of any securities. All trademarks,
service marks and trade names appearing in this report
are the property of their respective owners, and are
likewise used for identification purposes only.
This report is a service available
only to active Paid Premium Members.
You may opt-out of receiving report notifications
at any time. Questions or comments may be submitted
by writing to Premium Membership Services 665 S.E. 10 Street, Suite 201 Deerfield Beach, FL 33441-5634 or by calling 1-800-965-8307
or 954-785-1121.
|
|
|

