You are not logged in.
This means you
CAN ONLY VIEW reports that were published prior to Monday, March 10, 2025.
You
MUST UPGRADE YOUR MEMBERSHIP if you want to see any current reports.
AFTER MARKET UPDATE - MONDAY, JULY 11TH, 2011
Previous After Market Report Next After Market Report >>>
|
|
|
|
DOW |
-151.44 |
12,505.76 |
-1.20% |
|
Volume |
828,660,450 |
+8% |
|
Volume |
1,735,616,200 |
+11% |
|
NASDAQ |
-57.19 |
2,802.62 |
-2.00% |
|
Advancers |
427 |
14% |
|
Advancers |
455 |
17% |
|
S&P 500 |
-24.31 |
1,319.49 |
-1.81% |
|
Decliners |
2,597 |
84% |
|
Decliners |
2,179 |
80% |
|
Russell 2000 |
-19.03 |
833.54 |
-2.23% |
|
52 Wk Highs |
34 |
|
|
52 Wk Highs |
49 |
|
|
S&P 600 |
-9.19 |
448.69 |
-2.01% |
|
52 Wk Lows |
30 |
|
|
52 Wk Lows |
32 |
|
|
 |
Major Averages Fall as Fear Grows Over Potential Default
Kenneth J. Gruneisen - Passed the CAN SLIM® Master's Exam
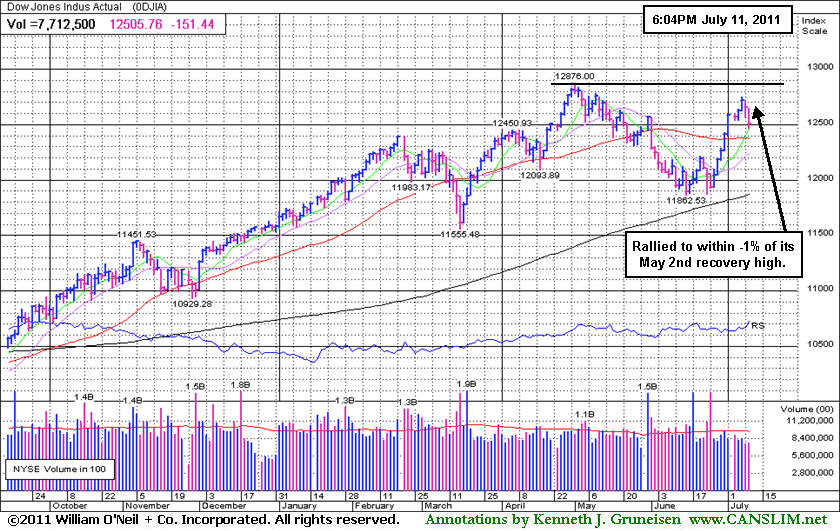
Monday's unanimous losses for the Dow Jones Industrial Average, S&P 500 Index, and Nasdaq Composite Index erased last week's gains and more. Higher volume totals than reported on Friday's session on the NYSE and on the Nasdaq exchange indicated a pick-up in institutional selling pressure weighing on the market following recent gains. Declining issues beat advancers 6-1 on the NYSE and by nearly 4-1 on the Nasdaq exchange. New 52-week highs outnumbered new 52-week lows on both the Nasdaq exchange and the NYSE. There were only 14 high-ranked companies from the CANSLIM.net Leaders List that made new 52-week highs and appeared on the CANSLIM.net BreakOuts Page, down from the total of 27 on the prior session. There was only 1 gainer out of the 16 high-ranked leaders currently included on the Featured Stocks Page.
Budget talks in Washington appeared to show little progress and fear of a potential US default grew. Investors also fretted that Italy is becoming more vulnerable to the European debt contagion. The week began with an ugly day led by financial stocks as Bank of America Corp (BAC -3.27%) sank to a 52-week low, JP Morgan Chase & Co (JPM -3.22%) slumped to December 2010 levels, and Citigroup Inc (C -5.33%) fell for a larger loss. Meanwhile, treasuries and gold advanced as investors shunned risk. The 10-year Treasury note was up almost a full point to yield 2.92%. Gold climbed to a two-week high, topping $1,550 an ounce.
Aftershocks from Friday's dismal jobs report may have kept the market on edge. Oil declined for a second day in New York on speculation that a slump in Chinese imports and rising unemployment in the U.S. may indicate fuel demand will falter. Halliburton Co (HAL -2.9%) pulled back from last week's new 52-week high. Consumer staple stocks such as The Clorox Co (CLX +2.83%) held up better than most as investors looked for steady earnings. Alcoa Inc (AA -2.9%) pulled back ahead of its earnings report and after the session close it reported earnings more than doubling the year ago quarter ended June 30th on +27% sales revenues.
Our July 2011 issue of CANSLIM.net News is due to be released soon with a comprehensive summary of current market conditions that further clarifies matters concerning the M criteria! The Q2 2011 CANSLIM.net Webcast is available "ON DEMAND" now to UPGRADED MEMBERS ONLY - (CLICK HERE).
PICTURED: The Dow Jones Industrial Average rallied last week to within -1% of its May 2nd recovery high.
|
 Kenneth J. Gruneisen started out as a licensed stockbroker in August 1987, a couple of months prior to the historic stock market crash that took the Dow Jones Industrial Average down -22.6% in a single day. He has published daily fact-based fundamental and technical analysis on high-ranked stocks online for two decades. Through FACTBASEDINVESTING.COM, Kenneth provides educational articles, news, market commentary, and other information regarding proven investment systems that work in good times and bad.
Comments contained in the body of this report are technical opinions only and are not necessarily those of Gruneisen Growth Corp. The material herein has been obtained from sources believed to be reliable and accurate, however, its accuracy and completeness cannot be guaranteed. Our firm, employees, and customers may effect transactions, including transactions contrary to any recommendation herein, or have positions in the securities mentioned herein or options with respect thereto. Any recommendation contained in this report may not be suitable for all investors and it is not to be deemed an offer or solicitation on our part with respect to the purchase or sale of any securities. |
|
 |
Financial Groups Dragged Market Lower Again
Kenneth J. Gruneisen - Passed the CAN SLIM® Master's Exam
The Bank Index ($BKX -2.83%) and Broker/Dealer Index ($XBD -2.70%) had a heavy influence on the major averages as they sank on Monday. The Networking Index ($NWX -2.82%), Biotechnology Index ($BTK -2.35%), Internet Index ($IIX -2.19%), and Semiconductor Index ($SOX -1.71%) suffered unanimous losses. The Healthcare Index ($HMO -2.81%) and the Retail Index ($RLX -1.73%) faced profit-taking pressures. Commodity-linked groups also slumped as the Oil Services Index ($OSX -2.57%), Integrated Oil Index ($XOI -2.52%), and Gold & Silver Index ($XAU -1.53%) lost ground.
Charts courtesy www.stockcharts.com
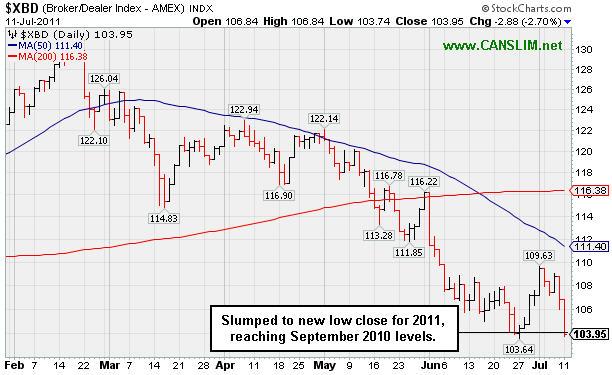
PICTURED: The Broker/Dealer Index ($XBD -2.70%) slumped to a new low close for 2011, reaching September 2010 levels.
| Oil Services |
$OSX |
265.66 |
-7.02 |
-2.57% |
+8.38% |
| Healthcare |
$HMO |
2,420.60 |
-70.11 |
-2.81% |
+43.06% |
| Integrated Oil |
$XOI |
1,292.13 |
-33.44 |
-2.52% |
+6.51% |
| Semiconductor |
$SOX |
406.73 |
-7.07 |
-1.71% |
-1.24% |
| Networking |
$NWX |
298.51 |
-8.66 |
-2.82% |
+6.40% |
| Internet |
$IIX |
314.57 |
-7.06 |
-2.19% |
+2.22% |
| Broker/Dealer |
$XBD |
103.95 |
-2.88 |
-2.70% |
-14.45% |
| Retail |
$RLX |
545.12 |
-9.60 |
-1.73% |
+7.23% |
| Gold & Silver |
$XAU |
204.63 |
-3.18 |
-1.53% |
-9.69% |
| Bank |
$BKX |
46.97 |
-1.37 |
-2.83% |
-10.04% |
| Biotech |
$BTK |
1,440.29 |
-34.72 |
-2.35% |
+10.99% |
|
|
|
 |
Pullback On Lighter Volume Following Latest Breakout
Kenneth J. Gruneisen - Passed the CAN SLIM® Master's Exam
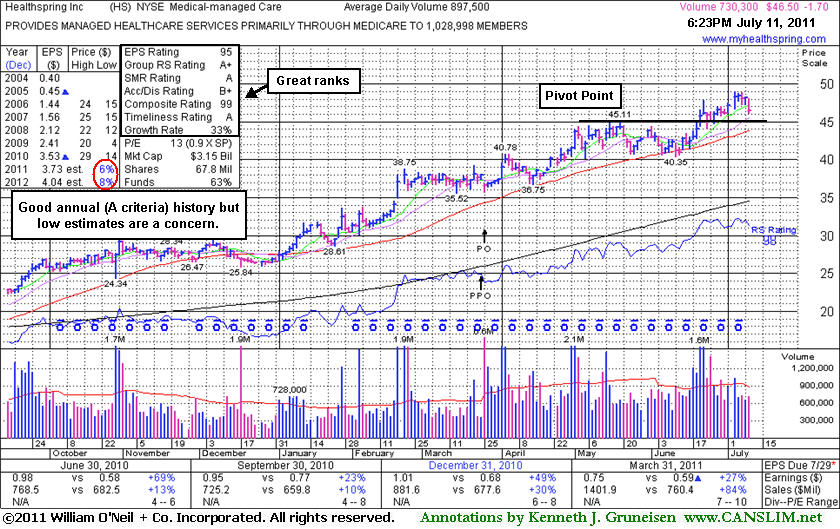
Healthspring Inc (HS -$1.70 or -3.53% to $46.50) is quietly consolidating under its "max buy" level today and its color code was changed to yellow. Odds are best for investors when buying stock while they are rising, not falling. As it consolidates, prior resistance near $45 defines support to watch now above important support at its 50-day moving average (DMA) line. After its last appearance in this FSU section on June 16, 2011 with an annotated graph under the headline, New Pivot Point Cited After Orderly Consolidation", it rallied from near its 50 DMA line with a streak of consecutive volume-driven gains to new highs as it triggered another technical buy signal.
Since HS was first featured at $19.91 in the 8/27/10 mid-day report it has traded up as much as +146%. Along the way it had paused to form new bases and new pivot points were noted before it broke out again. The number of top-rated funds owning its shares rose from 437 in June '10 to 519 in March '11, a reassuring sign concerning the I criteria. For the quarter ended March 31, 2011 versus the year earlier period its +84% increase in sales revenues marked an acceleration from +30% and +10% increases in the Sep and Dec '10 quarters, respectively. It has maintained strong earnings increases above the +25% guideline (C criteria) in the latest quarters and other bullish characteristics including high ranks. Street earnings estimates calling for EPS growth only in the +6-8% range in FY '11 and FY '12 remain a concern (see red circle).
 |
|
|
Color Codes Explained :
Y - Better candidates highlighted by our
staff of experts.
G - Previously featured
in past reports as yellow but may no longer be buyable under the
guidelines.
***Last / Change / Volume data in this table is the closing quote data***
Symbol/Exchange
Company Name
Industry Group |
PRICE |
CHANGE
(%Change) |
Day High |
Volume
(% DAV)
(% 50 day avg vol) |
52 Wk Hi
% From Hi |
Featured
Date |
Price
Featured |
Pivot Featured |
|
Max Buy |
CACC
-
NASDAQ
Credit Acceptance Corp
FINANCIAL SERVICES - Credit Services
|
$83.01
|
-1.92
-2.26% |
$84.77
|
47,717
113.34% of 50 DAV
50 DAV is 42,100
|
$86.87
-4.44%
|
6/2/2011
|
$76.10
|
PP = $82.39
|
|
MB = $86.51
|
 Most Recent Note - 7/11/2011 11:31:03 AM
Y - Consolidating after its 6/30/11 technical breakout, holding its ground above its pivot point, and it is not extended beyond its "max buy" level. Prior highs in the $80-82 area define initial support to watch on pullbacks.
>>> The latest Featured Stock Update with an annotated graph appeared on 6/27/2011. Click here.
View all notes |
Alert me of new notes |
CANSLIM.net Company Profile |
SEC |
Zacks Reports |
StockTalk |
News |
Chart |
Request a new note
C
A N
S L
I M


|
CMG
-
NYSE
Chipotle Mexican Grill
LEISURE - Restaurants
|
$320.69
|
-4.61
-1.42% |
$326.46
|
788,935
99.03% of 50 DAV
50 DAV is 796,700
|
$329.80
-2.76%
|
4/1/2011
|
$274.00
|
PP = $275.10
|
|
MB = $288.86
|
Most Recent Note - 7/11/2011 5:02:27 PM
G - Pulled back today on near average volume. Extended from prior highs and an upward trendline that define chart support to watch. See the latest FSU analysis for more details and a new annotated weekly graph.
>>> The latest Featured Stock Update with an annotated graph appeared on 7/8/2011. Click here.
View all notes |
Alert me of new notes |
CANSLIM.net Company Profile |
SEC |
Zacks Reports |
StockTalk |
News |
Chart |
Request a new note
C
A N
S L
I M
|
EW
-
NYSE
Edwards Lifesciences Cp
HEALTH SERVICES - Medical Appliances and Equipment
|
$90.13
|
-0.78
-0.86% |
$90.79
|
582,769
76.33% of 50 DAV
50 DAV is 763,500
|
$91.82
-1.84%
|
7/6/2011
|
$89.19
|
PP = $90.48
|
|
MB = $95.00
|
Most Recent Note - 7/11/2011 4:57:10 PM
Y - This high-ranked Medical - Products firm is quietly perched within close striking distance of its 52-week and all-time highs. Disciplined investors will watch first for volume-driven gains and a strong close above its pivot point to trigger a proper technical buy signal. See the latest FSU analysis for more details and a new annotated weekly graph.
>>> The latest Featured Stock Update with an annotated graph appeared on 7/7/2011. Click here.
View all notes |
Alert me of new notes |
CANSLIM.net Company Profile |
SEC |
Zacks Reports |
StockTalk |
News |
Chart |
Request a new note
C
A N
S L
I M
|
EZPW
-
NASDAQ
Ezcorp Inc Cl A
SPECIALTY RETAIL - Specialty Retail, Other
|
$36.73
|
-0.89
-2.37% |
$38.06
|
594,535
153.90% of 50 DAV
50 DAV is 386,300
|
$38.66
-4.99%
|
6/13/2011
|
$31.18
|
PP = $33.41
|
|
MB = $35.08
|
Most Recent Note - 7/11/2011 12:25:21 PM
G - Holding its ground near all-time highs after a streak of 10 consecutive volume-driven gains. It is very extended from prior highs in the $33 area that define support to watch on pullbacks.
>>> The latest Featured Stock Update with an annotated graph appeared on 7/5/2011. Click here.
View all notes |
Alert me of new notes |
CANSLIM.net Company Profile |
SEC |
Zacks Reports |
StockTalk |
News |
Chart |
Request a new note
C
A N
S L
I M
|
FCFS
-
NASDAQ
First Cash Financial Svs
SPECIALTY RETAIL - Specialty Retail, Other
|
$42.69
|
-0.98
-2.24% |
$43.57
|
138,617
74.01% of 50 DAV
50 DAV is 187,300
|
$44.84
-4.79%
|
5/31/2011
|
$42.00
|
PP = $40.23
|
|
MB = $42.24
|
Most Recent Note - 7/11/2011 4:53:53 PM
Y - Down on lighter volume for a second consecutive session since hitting a new all-time high. Slightly extended from its prior base. Prior highs in the $40-42 area define initial support areas to watch.
>>> The latest Featured Stock Update with an annotated graph appeared on 6/22/2011. Click here.
View all notes |
Alert me of new notes |
CANSLIM.net Company Profile |
SEC |
Zacks Reports |
StockTalk |
News |
Chart |
Request a new note
C
A N
S L
I M
|
Symbol/Exchange
Company Name
Industry Group |
PRICE |
CHANGE
(%Change) |
Day High |
Volume
(% DAV)
(% 50 day avg vol) |
52 Wk Hi
% From Hi |
Featured
Date |
Price
Featured |
Pivot Featured |
|
Max Buy |
FOSL
-
NASDAQ
Fossil Inc
CONSUMER DURABLES - Recreational Goods, Other
|
$125.00
|
+0.35
0.28% |
$128.42
|
1,110,946
147.11% of 50 DAV
50 DAV is 755,200
|
$126.36
-1.08%
|
2/1/2011
|
$73.30
|
PP = $74.44
|
|
MB = $78.16
|
Most Recent Note - 7/11/2011 12:27:28 PM
G - Touched another new all-time high today. It is extended from prior highs in the $107 area that now define initial support to watch near its 50 DMA line.
>>> The latest Featured Stock Update with an annotated graph appeared on 6/28/2011. Click here.
View all notes |
Alert me of new notes |
CANSLIM.net Company Profile |
SEC |
Zacks Reports |
StockTalk |
News |
Chart |
Request a new note
C
A N
S L
I M
|
HS
-
NYSE
Healthspring Inc
HEALTH SERVICES - Health Care Plans
|
$46.50
|
-1.70
-3.53% |
$48.09
|
732,733
81.64% of 50 DAV
50 DAV is 897,500
|
$48.95
-5.01%
|
6/16/2011
|
$42.44
|
PP = $45.21
|
|
MB = $47.47
|
Most Recent Note - 7/11/2011 11:22:22 AM
Y - Quietly consolidating under its "max buy" level today and its color code is changed to yellow. Prior resistance near $45 defines support to watch.
>>> The latest Featured Stock Update with an annotated graph appeared on 7/11/2011. Click here.
View all notes |
Alert me of new notes |
CANSLIM.net Company Profile |
SEC |
Zacks Reports |
StockTalk |
News |
Chart |
Request a new note
C
A N
S L
I M
|
INFA
-
NASDAQ
Informatica Corp
COMPUTER SOFTWARE and SERVICES - Business Software and Services
|
$59.38
|
-1.53
-2.51% |
$60.73
|
896,272
74.67% of 50 DAV
50 DAV is 1,200,300
|
$62.42
-4.87%
|
7/1/2011
|
$59.36
|
PP = $60.08
|
|
MB = $63.08
|
Most Recent Note - 7/11/2011 11:20:13 AM
Y - Quiet pullback today, consolidating below its new pivot point recently cited. This high-ranked Computer Software - Database firm faces no overhead supply. Disciplined investors watch for a volume-driven breakout to first trigger a new (or add-on) technical buy signal before taking action.
>>> The latest Featured Stock Update with an annotated graph appeared on 6/17/2011. Click here.
View all notes |
Alert me of new notes |
CANSLIM.net Company Profile |
SEC |
Zacks Reports |
StockTalk |
News |
Chart |
Request a new note
C
A N
S L
I M
|
LULU
-
NASDAQ
Lululemon Athletica
MANUFACTURING - Textile Manufacturing
|
$117.78
|
-2.47
-2.05% |
$120.57
|
1,529,889
74.08% of 50 DAV
50 DAV is 2,065,200
|
$123.84
-4.89%
|
6/21/2011
|
$102.95
|
PP = $101.14
|
|
MB = $106.20
|
Most Recent Note - 7/11/2011 4:58:39 PM
G - Pulling back today on lighter than average volume, perched near its all-time high. Its rally of better than +20% in less than 2-3 weeks after its recent technical breakout argues for investors to follow the investment system rule of holding stocks with such powerful early gains for 8 weeks minimum.
>>> The latest Featured Stock Update with an annotated graph appeared on 6/21/2011. Click here.
View all notes |
Alert me of new notes |
CANSLIM.net Company Profile |
SEC |
Zacks Reports |
StockTalk |
News |
Chart |
Request a new note
C
A N
S L
I M
|
MWIV
-
NASDAQ
M W I Veterinary Supply
HEALTH SERVICES - Medical Instruments and; Supplies
|
$83.12
|
-1.06
-1.26% |
$84.34
|
32,101
44.83% of 50 DAV
50 DAV is 71,600
|
$86.99
-4.45%
|
7/11/2011
|
$83.39
|
PP = $84.67
|
|
MB = $88.90
|
Most Recent Note - 7/11/2011 4:39:31 PM
Y - Down today on quiet volume. Perched within close striking distance of a new high close. Color code is changed to yellow with new pivot point cited based on its 5/20/11 high plus 10 cents. Volume-driven gains are needed to confirm a proper technical buy signal.
>>> The latest Featured Stock Update with an annotated graph appeared on 6/30/2011. Click here.
View all notes |
Alert me of new notes |
CANSLIM.net Company Profile |
SEC |
Zacks Reports |
StockTalk |
News |
Chart |
Request a new note
C
A N
S L
I M
|
Symbol/Exchange
Company Name
Industry Group |
PRICE |
CHANGE
(%Change) |
Day High |
Volume
(% DAV)
(% 50 day avg vol) |
52 Wk Hi
% From Hi |
Featured
Date |
Price
Featured |
Pivot Featured |
|
Max Buy |
OPNT
-
NASDAQ
Opnet Technologies
INTERNET - Internet Software and Services
|
$39.92
|
-0.71
-1.75% |
$40.47
|
45,500
36.87% of 50 DAV
50 DAV is 123,400
|
$42.51
-6.09%
|
6/28/2011
|
$40.87
|
PP = $42.61
|
|
MB = $44.74
|
Most Recent Note - 7/11/2011 5:00:41 PM
Y - Small loss today on light volume while quietly consolidating above its 50 DMA line and only -6.1% off its 52-week high. Disciplined investors always watch for a confirming technical buy signal before taking action. Recent lows near $36 define important near-term chart support.
>>> The latest Featured Stock Update with an annotated graph appeared on 7/1/2011. Click here.
View all notes |
Alert me of new notes |
CANSLIM.net Company Profile |
SEC |
Zacks Reports |
StockTalk |
News |
Chart |
Request a new note
C
A N
S L
I M
|
OTEX
-
NASDAQ
Open Text Corp
INTERNET - Internet Software and Services
|
$65.37
|
-2.17
-3.21% |
$66.97
|
187,724
63.68% of 50 DAV
50 DAV is 294,800
|
$68.67
-4.81%
|
6/1/2011
|
$65.86
|
PP = $67.18
|
|
MB = $70.54
|
Most Recent Note - 7/11/2011 11:24:38 AM
Y - Pulling back from its 52-week high and slumping back under its pivot point today after a recent streak of consecutive gains without great volume conviction. Volume-driven gains above the previously cited pivot point may trigger a technical buy signal.
>>> The latest Featured Stock Update with an annotated graph appeared on 6/24/2011. Click here.
View all notes |
Alert me of new notes |
CANSLIM.net Company Profile |
SEC |
Zacks Reports |
StockTalk |
News |
Chart |
Request a new note
C
A N
S L
I M
|
QSII
-
NASDAQ
Quality Systems Inc
COMPUTER SOFTWARE and SERVICES - Healthcare Information Service
|
$90.04
|
-1.44
-1.57% |
$91.82
|
388,415
164.65% of 50 DAV
50 DAV is 235,900
|
$92.38
-2.53%
|
7/6/2011
|
$91.26
|
PP = $91.67
|
|
MB = $96.25
|
Most Recent Note - 7/11/2011 12:49:53 PM
Y - Pulling back today after touching new all-time highs last week. Formed a lopsided 9-week cup shaped base without a handle. Color code was changed to yellow in the 7/06/11 mid-day report. A volume-driven gain above its pivot point is still needed to trigger a new technical buy signal. This long-ago featured Computer Software - Medical firm's earnings and sales increases in the recent quarterly comparisons showed acceleration. It has also maintained a steady and strong annual earnings history (A criteria).

>>> The latest Featured Stock Update with an annotated graph appeared on 7/6/2011. Click here.
View all notes |
Alert me of new notes |
CANSLIM.net Company Profile |
SEC |
Zacks Reports |
StockTalk |
News |
Chart |
Request a new note
C
A N
S L
I M
|
SWI
-
NYSE
Solarwinds Inc
COMPUTER SOFTWARE and SERVICES - Application Software
|
$25.36
|
-0.32
-1.25% |
$25.41
|
806,417
91.68% of 50 DAV
50 DAV is 879,600
|
$26.68
-4.95%
|
6/7/2011
|
$24.22
|
PP = $25.05
|
|
MB = $26.30
|
Most Recent Note - 7/11/2011 5:05:52 PM
Y - Finished near the session high today with a small loss on below average volume, a sign of prompt support after a gap down and early weakness that tested near recent chart lows and its 50 DMA line. Its color code was changed to yellow after the quiet pullback without heavy volume. More damaging losses would raise concerns and trigger technical sell signals.
>>> The latest Featured Stock Update with an annotated graph appeared on 6/29/2011. Click here.
View all notes |
Alert me of new notes |
CANSLIM.net Company Profile |
SEC |
Zacks Reports |
StockTalk |
News |
Chart |
Request a new note
C
A N
S L
I M
|
ULTA
-
NASDAQ
Ulta Salon Cosm & Frag
SPECIALTY RETAIL - Specialty Retail, Other
|
$64.96
|
-3.74
-5.44% |
$68.44
|
896,342
103.18% of 50 DAV
50 DAV is 868,700
|
$68.80
-5.58%
|
1/6/2011
|
$36.12
|
PP = $37.34
|
|
MB = $39.21
|
Most Recent Note - 7/11/2011 10:56:17 AM
G - Pulling back today after a strong finish for another new all-time high on the prior session. Extended from any sound base pattern. It may produce more climactic gains, but disciplined investors avoid chasing extended stocks.
>>> The latest Featured Stock Update with an annotated graph appeared on 6/20/2011. Click here.
View all notes |
Alert me of new notes |
CANSLIM.net Company Profile |
SEC |
Zacks Reports |
StockTalk |
News |
Chart |
Request a new note
C
A N
S L
I M
|
Symbol/Exchange
Company Name
Industry Group |
PRICE |
CHANGE
(%Change) |
Day High |
Volume
(% DAV)
(% 50 day avg vol) |
52 Wk Hi
% From Hi |
Featured
Date |
Price
Featured |
Pivot Featured |
|
Max Buy |
ZAGG
-
NASDAQ
Zagg Inc
SPECIALTY RETAIL - Specialty Retail, Other
|
$12.51
|
-0.20
-1.57% |
$12.88
|
935,168
44.30% of 50 DAV
50 DAV is 2,110,800
|
$15.85
-21.07%
|
6/1/2011
|
$10.92
|
PP = $10.59
|
|
MB = $11.12
|
Most Recent Note - 7/11/2011 11:16:25 AM
G - Consolidating well above its 50 DMA line and prior highs defining support. It is now in the 7th week since its powerful breakout, and after tallying gains greater than +20% in the first 2-3 weeks it argues for investors to follow the investment system rule of holding stocks with such powerful early gains for 8 weeks minimum unless there is a bad technical breakdown.
>>> The latest Featured Stock Update with an annotated graph appeared on 6/23/2011. Click here.
View all notes |
Alert me of new notes |
CANSLIM.net Company Profile |
SEC |
Zacks Reports |
StockTalk |
News |
Chart |
Request a new note
C
A N
S L
I M
|
|
|
|
THESE ARE NOT BUY RECOMMENDATIONS!
Comments contained in the body of this report are technical
opinions only. The material herein has been obtained
from sources believed to be reliable and accurate, however,
its accuracy and completeness cannot be guaranteed.
This site is not an investment advisor, hence it does
not endorse or recommend any securities or other investments.
Any recommendation contained in this report may not
be suitable for all investors and it is not to be deemed
an offer or solicitation on our part with respect to
the purchase or sale of any securities. All trademarks,
service marks and trade names appearing in this report
are the property of their respective owners, and are
likewise used for identification purposes only.
This report is a service available
only to active Paid Premium Members.
You may opt-out of receiving report notifications
at any time. Questions or comments may be submitted
by writing to Premium Membership Services 665 S.E. 10 Street, Suite 201 Deerfield Beach, FL 33441-5634 or by calling 1-800-965-8307
or 954-785-1121.
|
|
|

