You are not logged in.
This means you
CAN ONLY VIEW reports that were published prior to Monday, April 14, 2025.
You
MUST UPGRADE YOUR MEMBERSHIP if you want to see any current reports.
AFTER MARKET UPDATE - WEDNESDAY, JULY 10TH, 2013
Previous After Market Report Next After Market Report >>>
|
|
|
|
DOW |
-8.68 |
15,291.66 |
-0.06% |
|
Volume |
670,448,480 |
-3% |
|
Volume |
1,509,004,120 |
-4% |
|
NASDAQ |
+16.50 |
3,520.76 |
+0.47% |
|
Advancers |
1,601 |
51% |
|
Advancers |
1,427 |
56% |
|
S&P 500 |
+0.30 |
1,652.62 |
+0.02% |
|
Decliners |
1,395 |
45% |
|
Decliners |
1,028 |
40% |
|
Russell 2000 |
+2.37 |
1,020.42 |
+0.23% |
|
52 Wk Highs |
184 |
|
|
52 Wk Highs |
247 |
|
|
S&P 600 |
+0.78 |
576.95 |
+0.14% |
|
52 Wk Lows |
35 |
|
|
52 Wk Lows |
14 |
|
|
 |
Nasdaq Composite Leads Indices' Rally Effort
Kenneth J. Gruneisen - Passed the CAN SLIM® Master's Exam
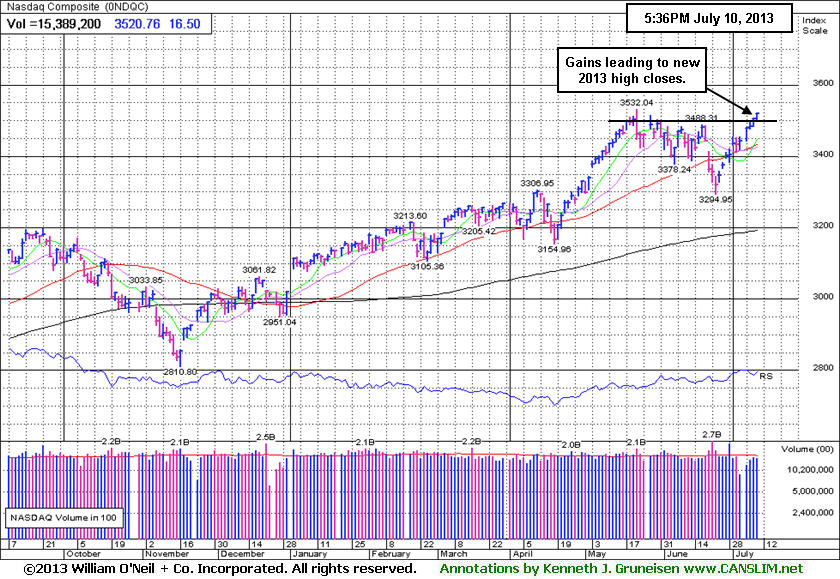
Stocks finished little changed on Wednesday with the tech-heavy Nasdaq Composite Index leading the major averages higher. Volume totals were reported lighter than the prior session on the NYSE and on the Nasdaq exchange. Advancers outnumbered decliners by an 8-7 margin on the NYSE and by a 7-5 margin on the Nasdaq exchange. There were 85 high-ranked companies from the CANSLIM.net Leaders List made new 52-week highs and appeared on the CANSLIM.net BreakOuts Page, down from the prior session total of 124 stocks. The list of stocks hitting new 52-week highs contracted yet still easily outnumbered new 52-week lows on both the NYSE and the Nasdaq exchange. There were gains for 5 of the 11 high-ranked companies currently included on the Featured Stocks Page.
The major averages ended a choppy trading session mixed following the release of the minutes from the Fed's June meeting. Although the report showed several policymakers favored a reduction in the central bank's asset purchases, many wanted to see further signs of improvement in the labor market before tapering its bond buying program. On the data front, wholesale inventories fell in May by the most since September 2011.
Family Dollar Stores Inc (FDO +7.11%) rallied after the discount retailer posted quarterly results above consensus estimates. Financials were the worst performing sector, led by a decline in bank stocks including Comerica Inc (CMA -2.14%). Energy also weighed on the market as Nabors Industries Ltd (NBR -6.31%) on its reduced income forecast. Health care was the best performing group with Amgen Inc (AMGN +3.79%) rallying. Shares of YUM! Brands Inc (YUM -0.42%) edged lower ahead of its earnings release following the close.
Treasuries retreated with the 10-year note down 11/32 to yield 2.68%.
Thursday's session marks Day 12 of the current rally attempt. Disciplined investors will note that the market (M criteria) did not produce a follow-through day within the most ideal period between days 4-7 of a new rally attempt. In spite of the recent rebound there is still a need for caution until a new rally is confirmed by a proper follow-through day (FTD) of meaningful gains (+1.4% or greater) from at least one of the major averages on higher volume coupled with an expansion in leadership (stocks hitting new 52-week highs). The rally attempt remains valid unless the Day 1 lows are violated which would clearly indicate deterioration and signal that the correction is worsening.
Upcoming CANSLIM.net reports will observe and explain any noteworthy shifts in the market direction (M criteria) while especially highlighting the characteristics and important details in the bold portion of this commentary. Regular readers are aware via prior reports since early June repeatedly reminding members - "Be protective of any gains, and limit losses! Be especially watchful for any individual issues flashing technical sell signals. It is vitally important to your success with the fact-based investment system to reduce exposure and preserve cash during market downdrafts."
Individual leaders best matching the winning models of the fact-based investment system are on the Featured Stocks Page - with our Certified experts' latest notes and links to additional resources including detailed analysis with annotated graphs. The Premium Member Homepage - includes "dynamic archives" to all prior pay reports published. Watch for an announcement via email concerning the next WEBCAST.
PICTURED: The Nasdaq Composite Index has tallied gains in 10 of the past 11 sessions and its recent gains lifted it to new closing highs for 2013.
|
 Kenneth J. Gruneisen started out as a licensed stockbroker in August 1987, a couple of months prior to the historic stock market crash that took the Dow Jones Industrial Average down -22.6% in a single day. He has published daily fact-based fundamental and technical analysis on high-ranked stocks online for two decades. Through FACTBASEDINVESTING.COM, Kenneth provides educational articles, news, market commentary, and other information regarding proven investment systems that work in good times and bad.
Comments contained in the body of this report are technical opinions only and are not necessarily those of Gruneisen Growth Corp. The material herein has been obtained from sources believed to be reliable and accurate, however, its accuracy and completeness cannot be guaranteed. Our firm, employees, and customers may effect transactions, including transactions contrary to any recommendation herein, or have positions in the securities mentioned herein or options with respect thereto. Any recommendation contained in this report may not be suitable for all investors and it is not to be deemed an offer or solicitation on our part with respect to the purchase or sale of any securities. |
|
 |
Tech Sector Gains Offset by Weaker Financial and Commodity-Linked Groups
Kenneth J. Gruneisen - Passed the CAN SLIM® Master's Exam
The Semiconductor Index ($SOX +1.12%) and the Biotechnology Index ($BTK +1.30%) led the tech sector higher while the Networking Index ($NWX +0.70%) and Internet Index ($IIX +0.23%) followed. The Retail Index ($RLX +0.10%) and the Healthcare Index ($HMO +0.15%) eked out minor gains. Meanwhile, weakness in financial shares weighed on the major averages as the Bank Index ($BKX -0.99%) and the Broker/Dealer Index ($XBD -0.48%) both lost ground. Energy-related shares also drifted lower as the Oil Services Index ($OSX -0.71%) and the Integrated Oil Index ($XOI -0.35%) lost ground, and the Gold & Silver Index ($XAU -0.33%) edged lower.
Charts courtesy www.stockcharts.com
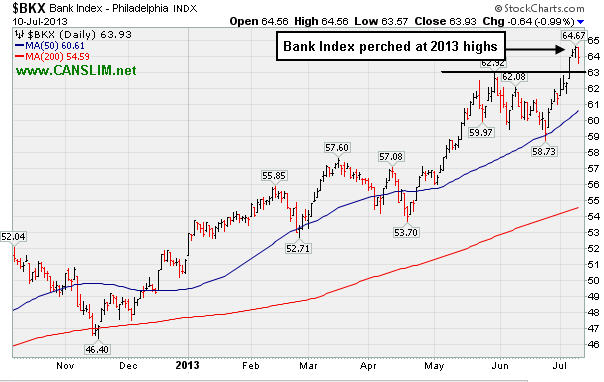
PICTURED: The Bank Index ($BKX -0.99%) paused perched at 2013 highs.
| Oil Services |
$OSX |
264.15 |
-1.90 |
-0.71% |
+19.98% |
| Healthcare |
$HMO |
3,318.88 |
+5.13 |
+0.15% |
+32.01% |
| Integrated Oil |
$XOI |
1,352.93 |
-4.76 |
-0.35% |
+8.95% |
| Semiconductor |
$SOX |
476.70 |
+5.29 |
+1.12% |
+24.12% |
| Networking |
$NWX |
265.91 |
+1.85 |
+0.70% |
+17.37% |
| Internet |
$IIX |
389.74 |
+0.90 |
+0.23% |
+19.19% |
| Broker/Dealer |
$XBD |
132.31 |
-0.63 |
-0.48% |
+40.26% |
| Retail |
$RLX |
827.01 |
+0.85 |
+0.10% |
+26.64% |
| Gold & Silver |
$XAU |
85.71 |
-0.28 |
-0.33% |
-48.24% |
| Bank |
$BKX |
63.93 |
-0.64 |
-0.99% |
+24.67% |
| Biotech |
$BTK |
2,066.96 |
+26.58 |
+1.30% |
+33.61% |
|
|
|
 |
Finished Near Pivot Point With Solid Volume-Driven Gain
Kenneth J. Gruneisen - Passed the CAN SLIM® Master's Exam
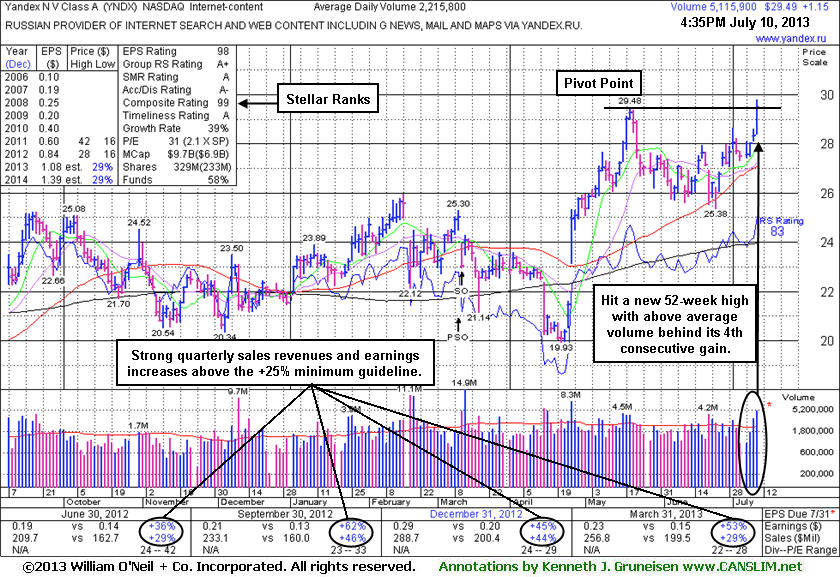
Yandex (YNDX +$1.15 or +4.06% to $29.49) was highlighted in yellow with pivot point ($29.58) cited based on its 5/20/13 high plus 10 cents and an annotated weekly graph was included in the earlier mid-day report (read here). The daily chart below shows that it hit a new 52-week high but finished just shy of the pivot point identified while today's 4th consecutive gain with ever-increasing volume was backed by +135% above average volume. Additional volume-driven gains and a strong finish above the pivot point may help it clinch a proper technical buy signal.
YNDX has shown strong quarterly sales revenues and earnings increases through Mar '13 versus the year ago periods. It has earned high ranks and maintained a strong quarterly and annual earnings history (C and A criteria). The number of top-rated funds owning its shares rose from 276 in Sep '12 to 403 in Jun '13, a reassuring sign concerning the I criteria. The Internet - Content group has recently shown leadership and it currently has the highest possible A+ Group Relative Strength Rating, a reassuring sign concerning the L criteria of the fact-based investment system.
|
|
|
Color Codes Explained :
Y - Better candidates highlighted by our
staff of experts.
G - Previously featured
in past reports as yellow but may no longer be buyable under the
guidelines.
***Last / Change / Volume data in this table is the closing quote data***
Symbol/Exchange
Company Name
Industry Group |
PRICE |
CHANGE
(%Change) |
Day High |
Volume
(% DAV)
(% 50 day avg vol) |
52 Wk Hi
% From Hi |
Featured
Date |
Price
Featured |
Pivot Featured |
|
Max Buy |
AMBA
-
NASDAQ
Ambarella Inc
ELECTRONICS - Semiconductor - Specialized
|
$16.89
|
-0.01
-0.06% |
$17.04
|
583,279
49.51% of 50 DAV
50 DAV is 1,178,200
|
$18.58
-9.10%
|
5/6/2013
|
$15.31
|
PP = $16.10
|
|
MB = $16.91
|
Most Recent Note - 7/8/2013 2:03:36 PM
G - Quietly consolidating near its "max buy" level. Found support while recently consolidating above its 50 DMA line - important chart support where a violation would trigger a worrisome technical sell signal.
>>> The latest Featured Stock Update with an annotated graph appeared on 6/27/2013. Click here.
View all notes |
Alert me of new notes |
CANSLIM.net Company Profile |
SEC |
Zacks Reports |
StockTalk |
News |
Chart |
Request a new note
C
A N
S L
I M


|
EQM
-
NYSE
E Q T Midstream Partners
ENERGY - Oil and Gas Pipelines
|
$43.60
|
-1.75
-3.86% |
$45.54
|
1,292,889
790.27% of 50 DAV
50 DAV is 163,600
|
$51.72
-15.70%
|
4/25/2013
|
$40.16
|
PP = $40.84
|
|
MB = $42.88
|
 Most Recent Note - 7/10/2013 4:30:20 PM
Suffered another damaging loss with higher above average volume today raising greater concerns while violating the prior low ($44.83 on 6/05/13) previously noted as important support. Due to weak action it will be dropped from the Featured Stocks list tonight
>>> The latest Featured Stock Update with an annotated graph appeared on 7/1/2013. Click here.
View all notes |
Alert me of new notes |
CANSLIM.net Company Profile |
SEC |
Zacks Reports |
StockTalk |
News |
Chart |
Request a new note
C
A N
S L
I M
|
FLT
-
NYSE
Fleetcor Technologies
DIVERSIFIED SERVICES - Business/Management Services
|
$85.67
|
-0.13
-0.15% |
$86.00
|
386,662
43.09% of 50 DAV
50 DAV is 897,300
|
$89.75
-4.55%
|
5/29/2013
|
$86.02
|
PP = $85.66
|
|
MB = $89.94
|
Most Recent Note - 7/9/2013 5:50:14 PM
G- Rose from its 50 DMA line and finished near the session high with below average volume behind its gain. The recent low ($80.28 on 6/21/13) defines important near-term support where a violation would raise more serious concerns.
>>> The latest Featured Stock Update with an annotated graph appeared on 6/28/2013. Click here.
View all notes |
Alert me of new notes |
CANSLIM.net Company Profile |
SEC |
Zacks Reports |
StockTalk |
News |
Chart |
Request a new note
C
A N
S L
I M
|
LOPE
-
NASDAQ
Grand Canyon Education
DIVERSIFIED SERVICES - Education and; Training Services
|
$35.10
|
+0.26
0.75% |
$35.53
|
612,025
142.90% of 50 DAV
50 DAV is 428,300
|
$35.17
-0.20%
|
6/19/2013
|
$31.47
|
PP = $34.17
|
|
MB = $35.88
|
Most Recent Note - 7/5/2013 6:36:54 PM
Y - Touched a new 52-week high but reversed into the red at the close. Subsequent volume driven gains above its pivot point may trigger a new technical buy signal. Its 50 DMA line and recent lows define support in the $30-31 area.
>>> The latest Featured Stock Update with an annotated graph appeared on 7/2/2013. Click here.
View all notes |
Alert me of new notes |
CANSLIM.net Company Profile |
SEC |
Zacks Reports |
StockTalk |
News |
Chart |
Request a new note
C
A N
S L
I M
|
PCLN
-
NASDAQ
Priceline.Com Inc
INTERNET - Internet Software and Services
|
$892.32
|
-4.74
-0.53% |
$897.00
|
521,793
70.92% of 50 DAV
50 DAV is 735,700
|
$900.40
-0.90%
|
7/8/2013
|
$878.28
|
PP = $847.43
|
|
MB = $889.80
|
Most Recent Note - 7/9/2013 6:27:28 PM
G - Rallied above its "max buy" level with today's 10th consecutive gain and its color code is changed to green while getting extended from its base. Prior highs in the $847 area define initial support to watch on pullbacks. See the latest FSU analysis for more details and a new annotated graph.
>>> The latest Featured Stock Update with an annotated graph appeared on 7/9/2013. Click here.
View all notes |
Alert me of new notes |
CANSLIM.net Company Profile |
SEC |
Zacks Reports |
StockTalk |
News |
Chart |
Request a new note
C
A N
S L
I M
|
Symbol/Exchange
Company Name
Industry Group |
PRICE |
CHANGE
(%Change) |
Day High |
Volume
(% DAV)
(% 50 day avg vol) |
52 Wk Hi
% From Hi |
Featured
Date |
Price
Featured |
Pivot Featured |
|
Max Buy |
PRAA
-
NASDAQ
Portfolio Recovery Assoc
DIVERSIFIED SERVICES - Business/Management Services
|
$139.62
|
-6.89
-4.70% |
$146.69
|
395,071
417.62% of 50 DAV
50 DAV is 94,600
|
$163.87
-14.80%
|
5/1/2013
|
$130.77
|
PP = $127.88
|
|
MB = $134.27
|
Most Recent Note - 7/10/2013 4:32:12 PM
Sank further below its 50 DMA line today with a 3rd consecutive damaging loss with even higher above average volume raising greater concerns. Due to weak action it will be dropped from the Featured Stocks list tonight.
>>> The latest Featured Stock Update with an annotated graph appeared on 6/25/2013. Click here.
View all notes |
Alert me of new notes |
CANSLIM.net Company Profile |
SEC |
Zacks Reports |
StockTalk |
News |
Chart |
Request a new note
C
A N
S L
I M
|
PRLB
-
NYSE
Proto Labs Inc
MANUFACTURING - Small Tools and Accessories
|
$63.27
|
-0.11
-0.17% |
$64.19
|
469,949
101.22% of 50 DAV
50 DAV is 464,300
|
$67.40
-6.13%
|
6/17/2013
|
$59.37
|
PP = $59.94
|
|
MB = $62.94
|
Most Recent Note - 7/8/2013 2:08:25 PM
G- Still holding its ground stubbornly near its 52-week high with volume totals cooling following a "negative reversal" on 6/28/13 with heavy volume. Prior highs near $59 define important near-term support above its 50 DMA line.
>>> The latest Featured Stock Update with an annotated graph appeared on 6/26/2013. Click here.
View all notes |
Alert me of new notes |
CANSLIM.net Company Profile |
SEC |
Zacks Reports |
StockTalk |
News |
Chart |
Request a new note
C
A N
S L
I M
|
RRTS
-
NYSE
Roadrunner Trans Systems
TRANSPORTATION - Air Delivery and Freight Service
|
$30.17
|
+0.63
2.13% |
$30.19
|
136,249
65.92% of 50 DAV
50 DAV is 206,700
|
$29.55
2.10%
|
4/3/2013
|
$22.77
|
PP = $23.75
|
|
MB = $24.94
|
Most Recent Note - 7/5/2013 6:32:20 PM
G - Finished at the session high and 2 cents off its best-ever close with a gain on below average volume. Wedged higher without great volume conviction after finding support above its 50 DMA line. Perched within close striking distance of its 52-week high.
>>> The latest Featured Stock Update with an annotated graph appeared on 7/3/2013. Click here.
View all notes |
Alert me of new notes |
CANSLIM.net Company Profile |
SEC |
Zacks Reports |
StockTalk |
News |
Chart |
Request a new note
C
A N
S L
I M
|
SSYS
-
NASDAQ
Stratasys Ltd
COMPUTER HARDWARE - Computer Peripherals
|
$93.13
|
+5.40
6.16% |
$93.13
|
1,101,308
136.35% of 50 DAV
50 DAV is 807,700
|
$94.90
-1.86%
|
7/8/2013
|
$91.44
|
PP = $95.00
|
|
MB = $99.75
|
Most Recent Note - 7/10/2013 4:35:26 PM
Y - Finished near the session high today and at a best-ever close with a solid gain on above average volume. Subsequent volume-driven gains above the pivot point based on its 5/14/13 high plus 10 cents may trigger a technical buy signal. Very little resistance remains due to overhead supply.
>>> The latest Featured Stock Update with an annotated graph appeared on 7/8/2013. Click here.
View all notes |
Alert me of new notes |
CANSLIM.net Company Profile |
SEC |
Zacks Reports |
StockTalk |
News |
Chart |
Request a new note
C
A N
S L
I M
|
VRX
-
NYSE
Valeant Pharmaceuticals
DRUGS - Drug Manufacturers - Other
|
$90.20
|
+0.24
0.27% |
$90.72
|
973,737
46.47% of 50 DAV
50 DAV is 2,095,200
|
$96.25
-6.29%
|
4/30/2013
|
$60.24
|
PP = $76.66
|
|
MB = $80.49
|
Most Recent Note - 7/5/2013 6:33:02 PM
G- Holding its ground since completing a new Public Offering on 6/18/13 following recent M&A news. Concerns were raised by its sub par Mar '13 earnings report. See the latest FSU analysis for more details and a new annotated graph.
>>> The latest Featured Stock Update with an annotated graph appeared on 7/5/2013. Click here.
View all notes |
Alert me of new notes |
CANSLIM.net Company Profile |
SEC |
Zacks Reports |
StockTalk |
News |
Chart |
Request a new note
C
A N
S L
I M
|
Symbol/Exchange
Company Name
Industry Group |
PRICE |
CHANGE
(%Change) |
Day High |
Volume
(% DAV)
(% 50 day avg vol) |
52 Wk Hi
% From Hi |
Featured
Date |
Price
Featured |
Pivot Featured |
|
Max Buy |
YNDX
-
NASDAQ
Yandex N V Class A
INTERNET - Internet Information Providers
|
$29.49
|
+1.15
4.06% |
$29.78
|
5,212,712
235.25% of 50 DAV
50 DAV is 2,215,800
|
$29.48
0.03%
|
7/10/2013
|
$29.29
|
PP = $29.59
|
|
MB = $31.07
|
Most Recent Note - 7/10/2013 6:07:00 PM
Y - Hit a new 52-week high with +135% above average volume behind today's 4th consecutive gain while challenging its pivot point cited based on its 5/20/13 high plus 10 cents. An annotated weekly graph was included in the earlier mid-day report (read here). Additional volume-driven gains above its pivot point may trigger a proper technical buy signal. It has earned high ranks and maintained a strong quarterly and annual earnings history (C and A criteria). The number of top-rated funds owning its shares rose from 276 in Sep '12 to 403 in Jun '13, a reassuring sign concerning the I criteria. See the latest FSU analysis for more details and an annotated daily graph.
>>> The latest Featured Stock Update with an annotated graph appeared on 7/10/2013. Click here.
View all notes |
Alert me of new notes |
CANSLIM.net Company Profile |
SEC |
Zacks Reports |
StockTalk |
News |
Chart |
Request a new note
C
A N
S L
I M
|
|
|
|
THESE ARE NOT BUY RECOMMENDATIONS!
Comments contained in the body of this report are technical
opinions only. The material herein has been obtained
from sources believed to be reliable and accurate, however,
its accuracy and completeness cannot be guaranteed.
This site is not an investment advisor, hence it does
not endorse or recommend any securities or other investments.
Any recommendation contained in this report may not
be suitable for all investors and it is not to be deemed
an offer or solicitation on our part with respect to
the purchase or sale of any securities. All trademarks,
service marks and trade names appearing in this report
are the property of their respective owners, and are
likewise used for identification purposes only.
This report is a service available
only to active Paid Premium Members.
You may opt-out of receiving report notifications
at any time. Questions or comments may be submitted
by writing to Premium Membership Services 665 S.E. 10 Street, Suite 201 Deerfield Beach, FL 33441-5634 or by calling 1-800-965-8307
or 954-785-1121.
|
|
|

