***Last / Change / Volume data in this table is the closing quote data***
Symbol/Exchange
Company Name
Industry Group |
PRICE |
CHANGE
(%Change) |
Day High |
Volume
(% DAV)
(% 50 day avg vol) |
52 Wk Hi
% From Hi |
Featured
Date |
Price
Featured |
Pivot Featured |
|
Max Buy |
ALXN
-
NASDAQ
Alexion Pharmaceuticals
DRUGS - Drug Manufacturers - Other
|
$98.11
|
-2.32
-2.31% |
$101.85
|
1,392,748
63.65% of 50 DAV
50 DAV is 2,188,100
|
$104.38
-6.01%
|
5/1/2012
|
$91.73
|
PP = $95.11
|
|
MB = $99.87
|
 Most Recent Note - 7/10/2012 4:49:04 PM
Y - Color code is changed to yellow after quietly pulling back below its "max buy" level today with a 5th consecutive loss on below average volume. Prior highs in the $95 area define support to watch on pullbacks.
>>> The latest Featured Stock Update with an annotated graph appeared on 6/29/2012. Click here.
View all notes |
Alert me of new notes |
CANSLIM.net Company Profile |
SEC |
Zacks Reports |
StockTalk |
News |
Chart |
Request a new note
C
A N
S L
I M


|
ASPS
-
NASDAQ
Altisource Ptf Sltns Sa
REAL ESTATE - Property Management/Developmen
|
$73.16
|
-1.20
-1.61% |
$74.97
|
111,946
85.07% of 50 DAV
50 DAV is 131,600
|
$76.20
-3.99%
|
6/5/2012
|
$60.01
|
PP = $63.00
|
|
MB = $66.15
|
Most Recent Note - 7/9/2012 4:44:22 PM
G - Still stubbornly holding its ground near its 52-week high, extended from its prior base. Prior highs in the $65 area define support to watch on pullbacks.
>>> The latest Featured Stock Update with an annotated graph appeared on 7/3/2012. Click here.
View all notes |
Alert me of new notes |
CANSLIM.net Company Profile |
SEC |
Zacks Reports |
StockTalk |
News |
Chart |
Request a new note
C
A N
S L
I M
|
CERN
-
NASDAQ
Cerner Corp
COMPUTER SOFTWARE and SERVICES - Healthcare Information Service
|
$81.82
|
-0.99
-1.20% |
$83.97
|
830,797
53.75% of 50 DAV
50 DAV is 1,545,600
|
$88.32
-7.36%
|
6/7/2012
|
$78.36
|
PP = $84.20
|
|
MB = $88.41
|
Most Recent Note - 7/9/2012 7:00:02 PM
G - Holding its ground since rebounding back above its 50 DMA line helping its technical stance. It has not formed a proper base since negating its prior breakout. See the latest FSU analysis for more details and a new annotated daily graph.
>>> The latest Featured Stock Update with an annotated graph appeared on 7/9/2012. Click here.
View all notes |
Alert me of new notes |
CANSLIM.net Company Profile |
SEC |
Zacks Reports |
StockTalk |
News |
Chart |
Request a new note
C
A N
S L
I M
|
CMCSA
-
NASDAQ
Comcast Corp Cl A
MEDIA - CATV Systems
|
$31.35
|
+0.08
0.26% |
$31.96
|
12,800,244
91.81% of 50 DAV
50 DAV is 13,941,900
|
$32.50
-3.54%
|
6/11/2012
|
$29.94
|
PP = $30.98
|
|
MB = $32.53
|
Most Recent Note - 7/10/2012 5:02:53 PM
Y - Still consolidating in a tight range near its 52-week high, holding ground above its pivot point. No overhead supply remains to act as resistance and it is still trading below its "max buy" level.
>>> The latest Featured Stock Update with an annotated graph appeared on 6/11/2012. Click here.
View all notes |
Alert me of new notes |
CANSLIM.net Company Profile |
SEC |
Zacks Reports |
StockTalk |
News |
Chart |
Request a new note
C
A N
S L
I M
|
CSTR
-
NASDAQ
Coinstar Inc
DIVERSIFIED SERVICES - Personal Services
|
$67.00
|
-1.93
-2.80% |
$70.07
|
1,175,907
110.75% of 50 DAV
50 DAV is 1,061,800
|
$71.82
-6.71%
|
6/26/2012
|
$64.05
|
PP = $67.00
|
|
MB = $70.35
|
Most Recent Note - 7/10/2012 4:50:49 PM
Y - Pulled back today to its pivot point with slightly higher volume behind its 3rd consecutive loss. Disciplined investors always limit losses by selling if any stock falls more than -7% from their purchase price.
>>> The latest Featured Stock Update with an annotated graph appeared on 6/26/2012. Click here.
View all notes |
Alert me of new notes |
CANSLIM.net Company Profile |
SEC |
Zacks Reports |
StockTalk |
News |
Chart |
Request a new note
C
A N
S L
I M
|
Symbol/Exchange
Company Name
Industry Group |
PRICE |
CHANGE
(%Change) |
Day High |
Volume
(% DAV)
(% 50 day avg vol) |
52 Wk Hi
% From Hi |
Featured
Date |
Price
Featured |
Pivot Featured |
|
Max Buy |
DG
-
NYSE
Dollar General Corp
RETAIL - Discount, Variety Stores
|
$55.60
|
+0.74
1.35% |
$56.04
|
3,324,296
87.61% of 50 DAV
50 DAV is 3,794,500
|
$55.30
0.54%
|
5/7/2012
|
$48.51
|
PP = $47.69
|
|
MB = $50.07
|
Most Recent Note - 7/5/2012 4:00:34 PM
G - Posted a small gain today with average volume, hovering near its all-time high, extended from its prior base. Completed another Secondary Offering on 6/05/12, its 4th Secondary Offering since September '11.
>>> The latest Featured Stock Update with an annotated graph appeared on 6/12/2012. Click here.
View all notes |
Alert me of new notes |
CANSLIM.net Company Profile |
SEC |
Zacks Reports |
StockTalk |
News |
Chart |
Request a new note
C
A N
S L
I M
|
ECHO
-
NASDAQ
Echo Global Logistics
DIVERSIFIED SERVICES - Business/Management Services
|
$19.00
|
+0.11
0.58% |
$19.04
|
164,895
142.77% of 50 DAV
50 DAV is 115,500
|
$19.48
-2.46%
|
6/22/2012
|
$18.98
|
PP = $19.48
|
|
MB = $20.45
|
Most Recent Note - 7/10/2012 4:46:14 PM
Y - Posted a 4th consecutive gain today with higher volume and closed near the session high. Recent volume-driven gains were followed by a gap down on 7/03/12 with higher volume after not quite triggering a technical buy signal under the fact-based system.
>>> The latest Featured Stock Update with an annotated graph appeared on 6/22/2012. Click here.
View all notes |
Alert me of new notes |
CANSLIM.net Company Profile |
SEC |
Zacks Reports |
StockTalk |
News |
Chart |
Request a new note
C
A N
S L
I M
|
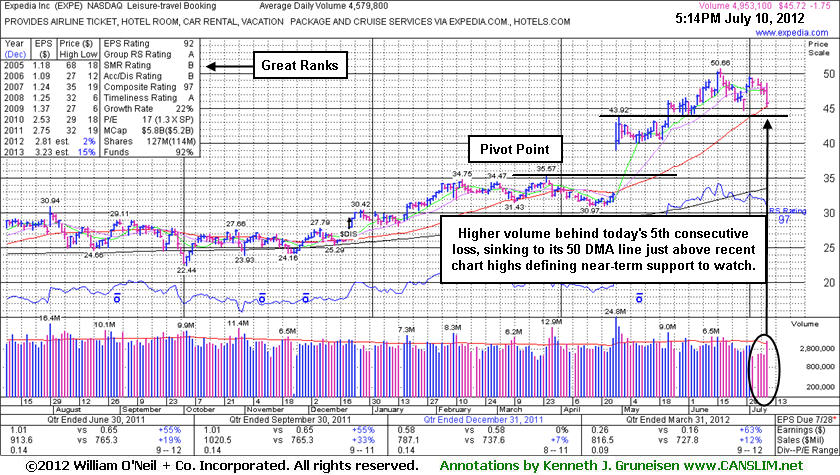
EXPE
-
NASDAQ
Expedia Inc
INTERNET - Internet Information Providers
|
$45.72
|
-1.75
-3.69% |
$48.58
|
4,956,644
108.23% of 50 DAV
50 DAV is 4,579,800
|
$50.66
-9.75%
|
4/27/2012
|
$41.80
|
PP = $35.57
|
|
MB = $37.35
|
Most Recent Note - 7/10/2012 4:44:04 PM
G - Slumped with higher volume today for its 5th consecutive loss, testing important support at its 50 DMA line. It is extended from its prior highs in the $43 area which define support below that important short-term average.
>>> The latest Featured Stock Update with an annotated graph appeared on 7/10/2012. Click here.
View all notes |
Alert me of new notes |
CANSLIM.net Company Profile |
SEC |
Zacks Reports |
StockTalk |
News |
Chart |
Request a new note
C
A N
S L
I M
|
GNC
-
NYSE
G N C Holdings Inc
RETAIL - Drug Stores
|
$39.89
|
-2.05
-4.89% |
$42.29
|
3,355,836
142.14% of 50 DAV
50 DAV is 2,361,000
|
$42.70
-6.58%
|
6/29/2012
|
$39.20
|
PP = $40.00
|
|
MB = $42.00
|
Most Recent Note - 7/10/2012 4:40:50 PM
Y - Color code is changed to yellow after today's loss with higher volume led to a pullback just under its pivot point. Disciplined investors always limit losses if any stock falls more than -7% from their purchase price.
>>> The latest Featured Stock Update with an annotated graph appeared on 7/5/2012. Click here.
View all notes |
Alert me of new notes |
CANSLIM.net Company Profile |
SEC |
Zacks Reports |
StockTalk |
News |
Chart |
Request a new note
C
A N
S L
I M
|
GPX
-
NYSE
G P Strategies Corp
DIVERSIFIED SERVICES - Education and Training Services
|
$17.84
|
+0.05
0.28% |
$18.31
|
36,447
63.28% of 50 DAV
50 DAV is 57,600
|
$18.99
-6.06%
|
6/29/2012
|
$18.01
|
PP = $18.15
|
|
MB = $19.06
|
Most Recent Note - 7/9/2012 4:54:04 PM
Y - Today's 3rd consecutive loss on lighter volume undercut prior highs and led to a finish back below its old high close. The damaging loss completely negated the recent breakout and raised concerns while closing near the session low.
>>> The latest Featured Stock Update with an annotated graph appeared on 7/6/2012. Click here.
View all notes |
Alert me of new notes |
CANSLIM.net Company Profile |
SEC |
Zacks Reports |
StockTalk |
News |
Chart |
Request a new note
C
A N
S L
I M
|
Symbol/Exchange
Company Name
Industry Group |
PRICE |
CHANGE
(%Change) |
Day High |
Volume
(% DAV)
(% 50 day avg vol) |
52 Wk Hi
% From Hi |
Featured
Date |
Price
Featured |
Pivot Featured |
|
Max Buy |
MLNX
-
NASDAQ
Mellanox Technologies
ELECTRONICS - Semiconductor - Broad Line
|
$69.03
|
-4.37
-5.95% |
$74.92
|
1,395,664
238.58% of 50 DAV
50 DAV is 585,000
|
$77.69
-11.15%
|
6/18/2012
|
$70.90
|
PP = $67.30
|
|
MB = $70.67
|
Most Recent Note - 7/10/2012 12:30:05 PM
G - Pulling back for a 3rd consecutive loss today, retreating from its all-time high after getting extended from its prior base with a spurt of volume-driven gains. Recent chart lows define important support to watch nearly coinciding with its 50 DMA line.
>>> The latest Featured Stock Update with an annotated graph appeared on 6/25/2012. Click here.
View all notes |
Alert me of new notes |
CANSLIM.net Company Profile |
SEC |
Zacks Reports |
StockTalk |
News |
Chart |
Request a new note
C
A N
S L
I M
|
N
-
NYSE
Netsuite Inc
DIVERSIFIED SERVICES - Business/Management Services
|
$50.08
|
-1.08
-2.11% |
$52.11
|
765,844
136.59% of 50 DAV
50 DAV is 560,700
|
$56.06
-10.67%
|
6/20/2012
|
$51.83
|
PP = $51.88
|
|
MB = $54.47
|
Most Recent Note - 7/10/2012 4:52:56 PM
Y - Above average volume was behind today's 4th consecutive damaging loss. It undercut its pivot point and negated its recent breakout raising concerns. Disciplined investors always limit losses by selling if any stock falls more than -7% from their purchase price.
>>> The latest Featured Stock Update with an annotated graph appeared on 6/20/2012. Click here.
View all notes |
Alert me of new notes |
CANSLIM.net Company Profile |
SEC |
Zacks Reports |
StockTalk |
News |
Chart |
Request a new note
C
A N
S L
I M
|
NSM
-
NYSE
Nationstar Mtg Hldgs Inc
FINANCIAL SERVICES - Credit Services
|
$24.30
|
-0.30
-1.22% |
$24.78
|
486,985
62.13% of 50 DAV
50 DAV is 783,800
|
$24.72
-1.70%
|
6/27/2012
|
$20.29
|
PP = $20.46
|
|
MB = $21.48
|
Most Recent Note - 7/9/2012 4:57:51 PM
G - Hit yet another new 52-week high today with lighter volume behind an 8th consecutive gain, getting more extended from its prior base. Prior highs in the $20 area define important support to watch on pullbacks.
>>> The latest Featured Stock Update with an annotated graph appeared on 6/27/2012. Click here.
View all notes |
Alert me of new notes |
CANSLIM.net Company Profile |
SEC |
Zacks Reports |
StockTalk |
News |
Chart |
Request a new note
C
A N
S L
I M
|
NTES
-
NASDAQ
Netease Inc Adr
INTERNET - Internet Information Providers
|
$57.91
|
-0.78
-1.33% |
$59.02
|
819,424
111.88% of 50 DAV
50 DAV is 732,400
|
$65.54
-11.64%
|
3/19/2012
|
$56.18
|
PP = $55.10
|
|
MB = $57.86
|
Most Recent Note - 7/9/2012 4:59:39 PM
G - Sank below its 50 DMA line with today's loss on lighter volume again hurting its technical stance. Chart support to watch is near prior lows in the $55 area.
>>> The latest Featured Stock Update with an annotated graph appeared on 6/19/2012. Click here.
View all notes |
Alert me of new notes |
CANSLIM.net Company Profile |
SEC |
Zacks Reports |
StockTalk |
News |
Chart |
Request a new note
C
A N
S L
I M
|
SXCI
-
NASDAQ
S X C Health Solutions
COMPUTER SOFTWARE and SERVICES - Healthcare Information Service
|
$93.02
|
-1.96
-2.06% |
$96.81
|
1,441,628
121.27% of 50 DAV
50 DAV is 1,188,800
|
$104.79
-11.23%
|
6/14/2012
|
$94.71
|
PP = $100.60
|
|
MB = $105.63
|
Most Recent Note - 7/10/2012 4:57:32 PM
Y - Ended near the session low today, testing its 50 DMA line with its 6th consecutive small loss. Churning above average volume recently while not making headway above its pivot point. Reversed and closed in the red after trading up on a few prior sessions, and the "negative reversals" were noted as signs of distributional pressure.
>>> The latest Featured Stock Update with an annotated graph appeared on 6/14/2012. Click here.
View all notes |
Alert me of new notes |
CANSLIM.net Company Profile |
SEC |
Zacks Reports |
StockTalk |
News |
Chart |
Request a new note
C
A N
S L
I M
|
Symbol/Exchange
Company Name
Industry Group |
PRICE |
CHANGE
(%Change) |
Day High |
Volume
(% DAV)
(% 50 day avg vol) |
52 Wk Hi
% From Hi |
Featured
Date |
Price
Featured |
Pivot Featured |
|
Max Buy |
TDG
-
NYSE
Transdigm Group Inc
AEROSPACE/DEFENSE - Aerospace/Defense Products and; Services
|
$130.03
|
-0.93
-0.71% |
$133.89
|
216,573
39.60% of 50 DAV
50 DAV is 546,900
|
$136.34
-4.63%
|
6/18/2012
|
$127.00
|
PP = $132.79
|
|
MB = $139.43
|
Most Recent Note - 7/10/2012 4:59:03 PM
Y - Reversed early gains today and closed near the session low with a loss on light volume. It has held its ground since recently noted when its 6/29/12 gain above its pivot point was backed by only +32% above average volume, below the minimum threshold need to trigger a proper new (or add-on) technical buy signal. Its 50 DMA line defines important support to watch.
>>> The latest Featured Stock Update with an annotated graph appeared on 6/18/2012. Click here.
View all notes |
Alert me of new notes |
CANSLIM.net Company Profile |
SEC |
Zacks Reports |
StockTalk |
News |
Chart |
Request a new note
C
A N
S L
I M
|
TNGO
-
NASDAQ
Tangoe Inc
COMPUTER SOFTWARE and SERVICES - Technical and System Software
|
$20.84
|
-0.12
-0.57% |
$21.61
|
365,304
67.94% of 50 DAV
50 DAV is 537,700
|
$23.05
-9.59%
|
6/27/2012
|
$21.70
|
PP = $23.15
|
|
MB = $24.31
|
Most Recent Note - 7/10/2012 5:00:40 PM
Y - Sputtering near its 50 DMA line with a 4th consecutive loss today on light volume. Gains above the pivot point backed by +40% above average volume or greater could trigger a new technical buy signal.
>>> The latest Featured Stock Update with an annotated graph appeared on 6/28/2012. Click here.
View all notes |
Alert me of new notes |
CANSLIM.net Company Profile |
SEC |
Zacks Reports |
StockTalk |
News |
Chart |
Request a new note
C
A N
S L
I M
|
VSI
-
NYSE
Vitamin Shoppe Inc
SPECIALTY RETAIL - Specialty Retail, Other
|
$57.14
|
+0.40
0.70% |
$58.22
|
560,274
109.36% of 50 DAV
50 DAV is 512,300
|
$57.52
-0.65%
|
6/29/2012
|
$54.93
|
PP = $55.03
|
|
MB = $57.78
|
Most Recent Note - 7/9/2012 4:49:33 PM
Y - Gain today with near average volume led to a finish near its 52-week high. Recent gains helped it trade above the new pivot point based on its 6/22/12 high after forming an 8-week cup-with-handle base, but the gains have lacked the volume required to trigger a proper new (or add-on) technical buy signal.
>>> The latest Featured Stock Update with an annotated graph appeared on 7/2/2012. Click here.
View all notes |
Alert me of new notes |
CANSLIM.net Company Profile |
SEC |
Zacks Reports |
StockTalk |
News |
Chart |
Request a new note
C
A N
S L
I M
|
WFM
-
NASDAQ
Whole Foods Market Inc
RETAIL - Grocery Stores
|
$95.12
|
+1.00
1.06% |
$95.75
|
1,828,474
90.90% of 50 DAV
50 DAV is 2,011,500
|
$97.25
-2.19%
|
6/13/2012
|
$89.90
|
PP = $91.60
|
|
MB = $96.18
|
Most Recent Note - 7/5/2012 1:12:05 PM
G - Color code is changed to green after inching above its "max buy" level. Recently hovering near its 52-week high with no resistance remaining due to overhead supply. Its prior highs in the $91.50 area define initial support to watch on pullbacks.
>>> The latest Featured Stock Update with an annotated graph appeared on 6/13/2012. Click here.
View all notes |
Alert me of new notes |
CANSLIM.net Company Profile |
SEC |
Zacks Reports |
StockTalk |
News |
Chart |
Request a new note
C
A N
S L
I M
|