You are not logged in.
This means you
CAN ONLY VIEW reports that were published prior to Monday, April 14, 2025.
You
MUST UPGRADE YOUR MEMBERSHIP if you want to see any current reports.
AFTER MARKET UPDATE - FRIDAY, JULY 10TH, 2009
Previous After Market Report Next After Market Report >>>
|
|
|
|
DOW |
-36.65 |
8,146.52 |
-0.45% |
|
Volume |
922,106,060 |
-8% |
|
Volume |
1,694,953,320 |
-12% |
|
NASDAQ |
+3.48 |
1,756.03 |
+0.20% |
|
Advancers |
1,441 |
47% |
|
Advancers |
1,409 |
51% |
|
S&P 500 |
-3.55 |
879.13 |
-0.40% |
|
Decliners |
1,531 |
50% |
|
Decliners |
1,223 |
44% |
|
Russell 2000 |
+1.71 |
480.98 |
+0.36% |
|
52 Wk Highs |
17 |
|
|
52 Wk Highs |
4 |
|
|
S&P 600 |
+0.74 |
256.36 |
+0.29% |
|
52 Wk Lows |
19 |
|
|
52 Wk Lows |
33 |
|
|
 |
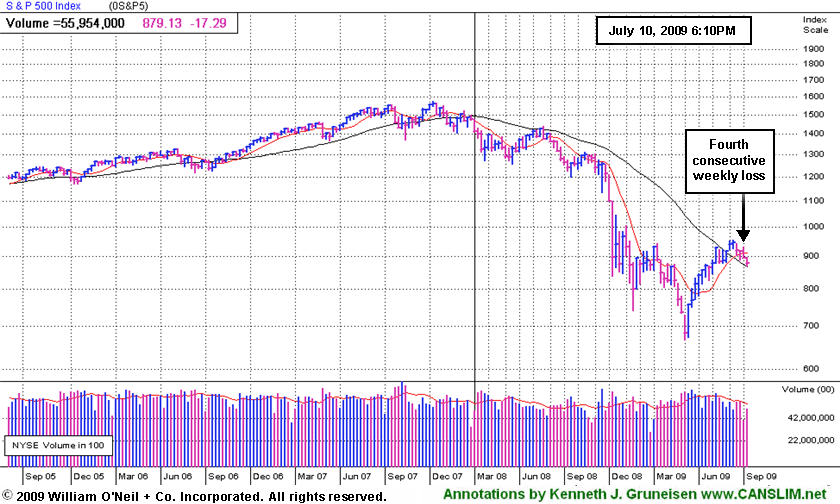
S&P 500 and Dow Industrials Post 4th Consecutive Weekly Losses
Adam Sarhan, Contributing Writer,
The market averages closed the session mixed on Friday as the fourth consecutive weekly declines were tallied for the S&P 500 Index and the Dow Jones Industrial Average. Volume totals were lighter in comparison to the prior session totals on the NYSE and on the Nasdaq exchange, revealing a lack of any conviction from the institutional crowd. Decliners and advancers were evenly mixed overall, with a slightly positive bias on the Nasdaq exchange. There were 3 high-ranked companies from the CANSLIM.net Leaders List that made a new 52-week high and appeared on the CANSLIM.net BreakOuts Page, down from the 6 issues that appeared on the prior session.
On Monday, the market opened sharply lower but spent the rest of the day rallying after the Institute of Supply Management (ISM) released a stronger than expected service index. The service index, also is also known as the non- manufacturing index and makes up nearly 90% of the economy, rose to 47 from 44 in May. Even though the reading was stronger than expected it was still below the boom/bust line of 50, indicating contraction. US services shrank at the slowest pace in nine months which was also an impressive feat. Looking forward, investors will begin digesting second quarter earnings and that will likely dictate the near term action for the major averages.
On Tuesday, the major averages and several commodities fell as the US dollar rallied. Investors sold stocks and commodities and moved to the greenback as concern spread that second quarter earnings will not be strong enough to justify the robust rally (nearly +50% rally in the Nasdaq Composite) seen in the major averages since their March lows. On Wednesday, the market treaded water for most of the day as investors digested the latest economic report from the International Monetary Fund (IMF). The IMF released a report that said the global economic outlook for the latter half of 2009 will be lackluster at best. The IMF believes that the global economy will not begin to recover until 2010, which is past the Street's consensus. Earnings season officially started this week and will likely play a major role in the near term action for the major averages. Remember that the primary argument that propelled stocks higher from the March lows was the notion that the economy was turning around and that a strong rebound would occur in the latter half of 2009. Since that notion has been questioned in recent weeks, it will be very interesting to see what catalyst the bulls can use to send stocks higher in the latter half of the year.
Stocks closed modestly higher on Thursday as oil prices continued their free fall. Crude oil fell over for a 7th straight day on the New York Mercantile Exchange. A little over a week ago, crude prices stood at $73 a barrel, and falling oil prices have actually pressured markets around the world in recent days since the US dollar has rallied in tandem. On Friday, stocks slid after the consumer confidence fell. The Reuters/University of Michigan preliminary index of consumer confidence slid by a larger than expected amount to 64.6, down from 70.8 in the prior month. The Commerce Department released a separate report which showed that the trade deficit unexpectedly shrank in May to the lowest level in almost a decade.
Attention: Institutional Investors
To inquire about money management services specifically designed for your needs, please email ASarhan@sourcegrp.com.
PICTURED: The benchmark S&P 500 Index fell for a 4th consecutive week. Not much is going on in the market right now, which reiterates the importance of remaining defensive until a new batch of high-ranked stocks trigger fresh technical breakouts and the major averages start advancing.
|
|
|
 |
Gains In Tech Sector Help Nasdaq Lead Major Indices
Kenneth J. Gruneisen - Passed the CAN SLIM® Master's Exam
The slumping Bank ($BKX -1.32%), Integrated Oil ($XOI -1.30%), and Healthcare ($HMO -1.12%) indexes were the groups with the most drastic changes weighing negatively on the market Friday. Modest losses from the Retail Index ($RLX -0.63%) and the Gold & Silver Index ($XAU -0.23%) also created a drag. Small gains and a positive bias in the tech sector helped the Nasdaq Composite Index finish with a gain as the Networking ($NWX +0.09%), Biotechnology ($BTK +0.19%), Semiconductor ($SOX +0.42%), and Internet ($IIX +0.49%) indexes edged higher. The Broker/Dealer ($XBD -0.08%) and Oil Services ($OSX -0.03%) indexes were virtually unchanged for the day.
Charts courtesy www.stockcharts.com
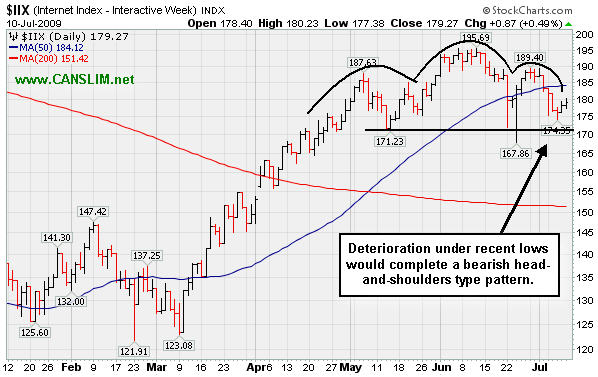
PICTURED: The Internet Index ($IIX +0.49%) rallied impressively from its March lows, but it has recently slumped below its 50-day moving average line. That is a worrisome sign that the group's strength is deteriorating. Technically, a violation of recent chart lows for the $IIX would hurt the near-term outlook for most Internet-related issues.
| Oil Services |
$OSX |
149.78 |
-0.04 |
-0.03% |
+23.39% |
| Healthcare |
$HMO |
1,066.43 |
-12.05 |
-1.12% |
+11.07% |
| Integrated Oil |
$XOI |
854.15 |
-11.24 |
-1.30% |
-12.81% |
| Semiconductor |
$SOX |
259.04 |
+1.09 |
+0.42% |
+22.09% |
| Networking |
$NWX |
173.56 |
+0.16 |
+0.09% |
+20.62% |
| Internet |
$IIX |
179.27 |
+0.87 |
+0.49% |
+34.01% |
| Broker/Dealer |
$XBD |
93.08 |
-0.07 |
-0.08% |
+20.15% |
| Retail |
$RLX |
309.62 |
-1.97 |
-0.63% |
+10.87% |
| Gold & Silver |
$XAU |
129.99 |
-0.30 |
-0.23% |
+4.96% |
| Bank |
$BKX |
34.28 |
-0.46 |
-1.32% |
-22.65% |
| Biotech |
$BTK |
646.68 |
+1.22 |
+0.19% |
-0.08% |
|
|
|
 |
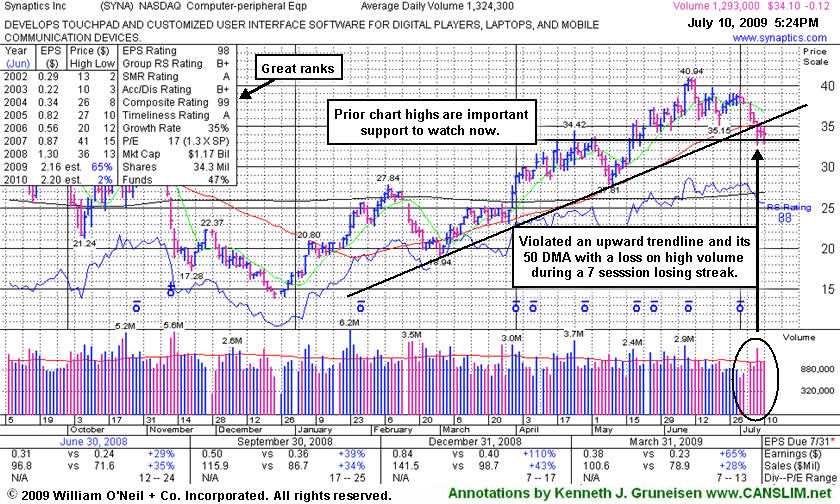
50 Day Average and Upward Trendline Violations This Week Raised Concerns
Kenneth J. Gruneisen - Passed the CAN SLIM® Master's Exam
Synaptics Inc. (SYNA -$0.12 or -0.35% to $34.10) fell of Friday for its 7th consecutive loss. During that streak, a 50-day moving average (DMA) line and upward trendline violation on 7/08/09 triggered technical sell signals. Prior chart highs define an important support level it is consolidating above now. Any deterioration leading to a close under its May 1st close of $33.33 would raise more serious concerns and fully negate its latest breakout by erasing all bullish action since May. For its outlook to improve, technically, it needs to repair the recent violation of its short-term average and show signs of institutional support. It was first featured in yellow in the May 18, 2009 Mid-Day BreakOuts Report (read here). The number of top-rated funds owning its shares rose from 123 in June '08 to 199 in March '09, which is good news concerning the I criteria. Strong earnings and sales revenues growth in the 4 latest quarterly comparisons satisfies the C criteria. Its annual earnings (the A criteria) history showed a downturn in 2006, leaving concerns, but it followed that up with strong growth the next 2 years.
|
|
|
Color Codes Explained :
Y - Better candidates highlighted by our
staff of experts.
G - Previously featured
in past reports as yellow but may no longer be buyable under the
guidelines.
***Last / Change / Volume quote data in this table corresponds with the timestamp on the note***
Symbol/Exchange
Company Name
Industry Group |
Last |
Chg. |
Vol
% DAV |
Date Featured |
Price Featured |
Latest Pivot Point
Featured |
Status |
| Latest Max Buy Price |
CPLA
- NASDAQ
Capella Education Co
DIVERSIFIED SERVICES - Education and Training Services
|
$58.75
|
N/A
|
N/A
N/A
|
7/9/2009
(Date
Featured) |
$59.69
(Price
Featured) |
PP = $62.06 |
Y |
| MB = $65.16 |
Most Recent Note - 7/10/2009
Y - It negatively reversed for a loss on the past 2 sessions after it was featured in yellow in the 7/09/09 Mid-Day BreakOuts Report (read here). It is perched within -6% of its 52-week high. The group has shown some leadership, yet currently has a D for a Relative Strength Rating. CPLA is a high-ranked leader in the Commercial Services-Schools Group. Its small supply of only 13.9 million shares in the float could contribute to greater price volatility in the event of institutional accumulation or distribution. The number of top-rated funds owning an interest rose from 91 in Sept '08, to 129 as of March '09, which is reassuring with respect to the I criteria. It has a very good earnings history that satisfies the C & A criteria, while recent quarters showed steady sales revenues increases in the +17-18% range.
>>> The latest Featured Stock Update with an annotated graph appeared on 7/9/2009. click here.
|
|
C
A
S
I |
News |
Chart |
SEC
View all notes Alert
me of new notes
Company
Profile
|
GMCR
- NASDAQ
Green Mtn Coffee Roastrs
FOOD & BEVERAGE - Processed & Packaged Goods
|
$56.42
|
N/A
|
N/A
N/A
|
1/1/2008
(Date
Featured) |
$27.13
(Price
Featured) |
PP = $28.66 |
G |
| MB = $30.09 |
Most Recent Note - 7/10/2009 4:31:14 PM
G - This week it has been quietly consolidating just above its 50 DMA line, important support to watch above its recent chart low ($51.65), where violations would raise concerns and trigger technical sell signals. On 6/09/09 it reached a new all-time high with a gain on light volume as a 3:2 stock split took effect. GMCR traded up more than +144% since appearing with an annotated graph under the headline "It May Soon Be Time To Go Green" when featured in the January 2009 CANSLIM.net News (read here).
>>> The latest Featured Stock Update with an annotated graph appeared on 7/6/2009. click here.
|
|
C
A
S
I |
News |
Chart |
SEC
View all notes Alert
me of new notes
Company
Profile
|
HMSY
- NASDAQ
H M S Holdings Corp
COMPUTER SOFTWARE & SERVICES - Healthcare Information Service
|
$39.29
|
N/A
|
N/A
N/A
|
2/20/2009
(Date
Featured) |
$34.08
(Price
Featured) |
PP = $38.38 |
G |
| MB = $40.30 |
Most Recent Note - 7/10/2009 4:50:38 PM
G - Positively reversed today after a pullback near prior highs in the $38 area which are a very important initial support level above its 50 DMA line. This week it sank under an upward trendline connecting its April-June lows. A gap up gain on 6/16/09 with heavy volume triggered a technical buy signal. No overhead supply is left to hinder the progress for this Commercial Services - Healthcare firm.
>>> The latest Featured Stock Update with an annotated graph appeared on 6/29/2009. click here.
|
|
C
A
S
I |
News |
Chart |
SEC
View all notes Alert
me of new notes
Company
Profile
|
NTES
- NASDAQ
Netease Inc Adr
INTERNET - Internet Information Providers
|
$34.33
|
N/A
|
N/A
N/A
|
5/21/2009
(Date
Featured) |
$31.19
(Price
Featured) |
PP = $32.75 |
G |
| MB = $34.39 |
Most Recent Note - 7/10/2009 4:51:50 PM
G - Closed a choppy week above its 50 DMA line after a considerable loss on 7/08/09 with above average volume triggered a technical sell signal. Recent losses were noted as a worrisome violation of a multi-month upward trendline occurred. Prior chart highs near $32 are an important technical support level to watch now. It has negated all gains since its 5/28/09 gap up and considerable gain with +79% above average volume confirmed its last sound technical buy signal. Indications of institutional (the I criteria) buying demand have been noted after earnings news on 5/20/09 a shakeout tested support near its 50 DMA line. First featured at $26.75 in the 3/31/09 CANSLIM.net Mid-Day Breakouts Report (read here). This high-ranked Chinese Internet - Content firm was also summarized in greater detail including an annotated graph in the April 2009 issue of CANSLIM.net News (read here).
>>> The latest Featured Stock Update with an annotated graph appeared on 6/30/2009. click here.
|
|
C
A
S
I |
News |
Chart |
SEC
View all notes Alert
me of new notes
Company
Profile
|
NVEC
- NASDAQ
N V E Corp
ELECTRONICS - Semiconductor - Specialized
|
$43.04
|
N/A
|
N/A
N/A
|
3/13/2009
(Date
Featured) |
$33.85
(Price
Featured) |
PP = $45.50 |
G |
| MB = $47.78 |
Most Recent Note - 7/10/2009 4:52:58 PM
G - This week it slumped under its pivot point and tested its 50 DMA line and prior highs - important support to watch. Color code was changed to green based deterioration after its 6/19/09 breakout was completely negated. Sales increases in recent comparisons have been under the +25% guideline and still rather minuscule, leaving concerns, especially in the event of any hiccups. This is a reason to be especially disciplined about proper entries and exits.
>>> The latest Featured Stock Update with an annotated graph appeared on 7/8/2009. click here.
|
|
C
A
S
I |
News |
Chart |
SEC
View all notes Alert
me of new notes
Company
Profile
|
SNDA
-
|
$51.91
|
N/A
|
N/A
N/A
|
5/31/2009
(Date
Featured) |
$57.62
(Price
Featured) |
PP = $53.95 |
G |
| MB = $56.65 |
Most Recent Note - 7/10/2009 4:54:10 PM
G - Slumped under its 50 DMA line this week, and subsequent deterioration below its recent chart low near $50 would raise more serious concerns and trigger a worrisome technical sell signal. Detailed analysis was included when recently featured in the June 2009 issue of CANSLIM.net News. Be sure to review the "What to Look Out For" section and entire detailed summary - read here).
>>> The latest Featured Stock Update with an annotated graph appeared on 7/2/2009. click here.
|
|
C
A
S
I |
News |
Chart |
SEC
View all notes Alert
me of new notes
Company
Profile
|
SYNA
- NASDAQ
Synaptics Inc
COMPUTER SOFTWARE & SERVICES - Information Technology Service
|
$34.10
|
N/A
|
N/A
N/A
|
5/18/2009
(Date
Featured) |
$32.58
(Price
Featured) |
PP = $34.52 |
G |
| MB = $36.25 |
Most Recent Note - 7/10/2009 4:55:40 PM
G - Today was its 7th consecutive loss, and a 50 DMA line violation on 7/08/09 triggered a technical sell signal. First featured in yellow in the May 18, 2009 mid-day report (read here). The number of top-rated funds owning its shares rose from 123 in June '08 to 199 in March '09, which is good news concerning the I criteria. Its annual earnings (the A criteria) history showed a dowturn in 2006, leaving concerns, but it followed that up with strong growth the next 2 years. Its small supply of shares (the S criteria) outstanding could contribute to especially great volatility in the event of institutional accumulation or distribution.
>>> The latest Featured Stock Update with an annotated graph appeared on 7/10/2009. click here.
|
|
C
A
S
I |
News |
Chart |
SEC
View all notes Alert
me of new notes
Company
Profile
|
TNDM
- NASDAQ
Tandem Diabetes Care Inc
TELECOMMUNICATIONS - Wireless Communications
|
$27.66
|
N/A
|
N/A
N/A
|
3/2/2009
(Date
Featured) |
$18.89
(Price
Featured) |
PP = $29.85 |
G |
| MB = $31.34 |
Most Recent Note - 7/10/2009 5:24:29 PM
G - Small gains on light volume leave it still trading below its 50 DMA line. Its choppy chart offers no sound base per the investment system's guidelines. It traded up as much as +72.42% since first featured at $18.89 in the 3/02/09 Mid-Day BreakOuts Report (read here).
>>> The latest Featured Stock Update with an annotated graph appeared on 7/7/2009. click here.
|
|
C
A
S
I |
News |
Chart |
SEC
View all notes Alert
me of new notes
Company
Profile
|
|
 |
| Subscriber Questions: |
July 10, 2009 |
Ken,
I noticed that Thursday's market commentary was written by you, but Adam Sarhan normally writes the daily commentaries. What's going on?
Just curious,
Frank |
| Ken's Response: |
July 10, 2009 |
Frank,
Great question! What is going on this evening is Adam Sarhan is marrying Sarah Omar. So, please feel free to wish him the best via email to ASarhan@sourcegrp.com. In the weeks ahead, you might notice me and other well-qualified guests filling in so that Adam does not end up working "too much" on his honeymoon!

Kenneth J. Gruneisen
Founder & Contributing Writer for CANSLIM.net StockNews
www.canslim.net |
|
|
|
THESE ARE NOT BUY RECOMMENDATIONS!
Comments contained in the body of this report are technical
opinions only. The material herein has been obtained
from sources believed to be reliable and accurate, however,
its accuracy and completeness cannot be guaranteed.
This site is not an investment advisor, hence it does
not endorse or recommend any securities or other investments.
Any recommendation contained in this report may not
be suitable for all investors and it is not to be deemed
an offer or solicitation on our part with respect to
the purchase or sale of any securities. All trademarks,
service marks and trade names appearing in this report
are the property of their respective owners, and are
likewise used for identification purposes only.
This report is a service available
only to active Paid Premium Members.
You may opt-out of receiving report notifications
at any time. Questions or comments may be submitted
by writing to Premium Membership Services 665 S.E. 10 Street, Suite 201 Deerfield Beach, FL 33441-5634 or by calling 1-800-965-8307
or 954-785-1121.
|
|
|


