You are not logged in.
This means you
CAN ONLY VIEW reports that were published prior to Monday, April 14, 2025.
You
MUST UPGRADE YOUR MEMBERSHIP if you want to see any current reports.
AFTER MARKET UPDATE - TUESDAY, JULY 9TH, 2013
Previous After Market Report Next After Market Report >>>
|
|
|
|
DOW |
+75.65 |
15,300.34 |
+0.50% |
|
Volume |
692,120,920 |
-24% |
|
Volume |
1,565,945,240 |
+7% |
|
NASDAQ |
+19.43 |
3,504.26 |
+0.56% |
|
Advancers |
2,245 |
72% |
|
Advancers |
1,515 |
58% |
|
S&P 500 |
+11.85 |
1,652.31 |
+0.72% |
|
Decliners |
782 |
25% |
|
Decliners |
955 |
37% |
|
Russell 2000 |
+8.79 |
1,018.04 |
+0.87% |
|
52 Wk Highs |
279 |
|
|
52 Wk Highs |
306 |
|
|
S&P 600 |
+6.05 |
576.17 |
+1.06% |
|
52 Wk Lows |
35 |
|
|
52 Wk Lows |
14 |
|
|
 |
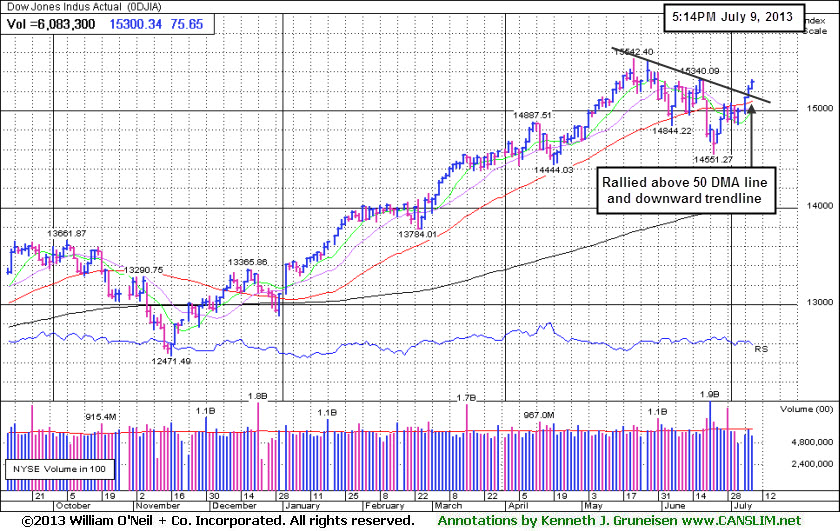
Major Averages Post Fourth Straight Day of Gains
Kenneth J. Gruneisen - Passed the CAN SLIM® Master's Exam
Tuesday's positive action helped the major indices extend their gains for a fourth straight session amid optimism surrounding second-quarter earnings. Volume totals were reported mixed, lighter than the prior session on the NYSE and yet higher on the Nasdaq exchange. Breadth was positive as advancers outnumbered decliners by nearly a 3-1 margin on the NYSE and by a 3-2 margin on the Nasdaq exchange. There were 124 high-ranked companies from the CANSLIM.net Leaders List made new 52-week highs and appeared on the CANSLIM.net BreakOuts Page, down slightly from the prior session total of 133 stocks. The list of stocks hitting new 52-week highs easily outnumbered new 52-week lows on both the NYSE and the Nasdaq exchange. There were gains for only 4 of the 10 high-ranked companies currently included on the Featured Stocks Page, again a disconcertingly weak showing versus the broader market's positive breadth.
The market remained higher even after the International Monetary Fund reduced its 2013 forecast for U.S. growth to 1.7% from its prediction of 1.9% back in April. Shares of Alcoa Inc (AA -0.13%) ended slightly lower despite posting better-than-expected profit results. The telecom group underperformed Verizon Communcations Inc (VZ -0.14%) and wireless equipment maker Crown Castle International Inc (CCI -0.86%) edging lower.
Homebuilders including DR Horton Inc (DHI +7.55%) and retailers paced an advance in consumer stocks. Barnes & Noble Inc (BKS +5.38%) rose after announcing the resignation of its CEO. Industrials and materials were also among the better performing groups. FedEx Corp (FDX +4.37%) rallied following the company's announcement it settled a lawsuit claiming it overcharged customers. Shares of Cliffs Natural Resources Inc (CLF +2.69%) rose amid gains in energy-related shares.
The Kroger Co (KR +2.65%) traded higher after the grocer agreed to acquire Harris Teeter Supermarkets Inc (HTSI +1.53%) for $2.5 billion in cash. Intuitive Surgical Inc (ISRG -16.15%) was the biggest decliner in the S&P 500, falling hard after reporting preliminary earnings results that fell short of consensus estimates.
In the financials, banks finished mixed after US regulators proposed an increase in capital requirements for large institutions. Zions Bancorp (ZION -2.25%) fell and Bank of America Corp (BAC +1.88%) rose.
Treasuries were mixed. The 10-year note was flat to yield 2.64%.
Wednesday's session marks Day 11 of the current rally attempt. Disciplined investors will note that the market (M criteria) did not produce a follow-through day within the most ideal period between days 4-7 of a new rally attempt. In spite of the recent rebound there is still a need for caution until a new rally is confirmed by a proper follow-through day (FTD) of meaningful gains (+1.4% or greater) from at least one of the major averages on higher volume coupled with an expansion in leadership (stocks hitting new 52-week highs). The rally attempt remains valid unless the Day 1 lows are violated which would clearly indicate deterioration and signal that the correction is worsening.
Upcoming CANSLIM.net reports will observe and explain any noteworthy shifts in the market direction (M criteria) while especially highlighting the characteristics and important details in the bold portion of this commentary. Regular readers are aware via prior reports since early June repeatedly reminding members - "Be protective of any gains, and limit losses! Be especially watchful for any individual issues flashing technical sell signals. It is vitally important to your success with the fact-based investment system to reduce exposure and preserve cash during market downdrafts."
Individual leaders best matching the winning models of the fact-based investment system are on the Featured Stocks Page - with our Certified experts' latest notes and links to additional resources including detailed analysis with annotated graphs. The Premium Member Homepage - includes "dynamic archives" to all prior pay reports published. Watch for an announcement via email concerning the next WEBCAST.
PICTURED: The Dow Jones Industrial Average recently repaired its 50-day moving average (DMA) line violation and the downward trendline formed in recent weeks.
|
 Kenneth J. Gruneisen started out as a licensed stockbroker in August 1987, a couple of months prior to the historic stock market crash that took the Dow Jones Industrial Average down -22.6% in a single day. He has published daily fact-based fundamental and technical analysis on high-ranked stocks online for two decades. Through FACTBASEDINVESTING.COM, Kenneth provides educational articles, news, market commentary, and other information regarding proven investment systems that work in good times and bad.
Comments contained in the body of this report are technical opinions only and are not necessarily those of Gruneisen Growth Corp. The material herein has been obtained from sources believed to be reliable and accurate, however, its accuracy and completeness cannot be guaranteed. Our firm, employees, and customers may effect transactions, including transactions contrary to any recommendation herein, or have positions in the securities mentioned herein or options with respect thereto. Any recommendation contained in this report may not be suitable for all investors and it is not to be deemed an offer or solicitation on our part with respect to the purchase or sale of any securities. |
|
 |
Financial, Retail, Tech, and Commodity-Linked Groups Ended Higher
Kenneth J. Gruneisen - Passed the CAN SLIM® Master's Exam
Gains in financial shares underpinned the major averages again as the Broker/Dealer Index ($XBD +1.34%) outpaced the Bank Index ($BKX +0.44%). The Semiconductor Index ($SOX +1.05%) and Internet Index ($IIX +0.92%) led the tech sector higher while the Biotechnology Index ($BTK +0.59%) posted a smaller gain and the Networking Index ($NWX +0.10%) inched higher. The Retail Index ($RLX +0.55%) and Healthcare Index ($HMO +0.91%) had a positive bias. Commodity-linked groups traded higher as the Gold & Silver Index ($XAU +1.19%), Oil Services Index ($OSX +1.03%) and the Integrated Oil Index ($XOI +0.51%) posted gains.
Charts courtesy www.stockcharts.com
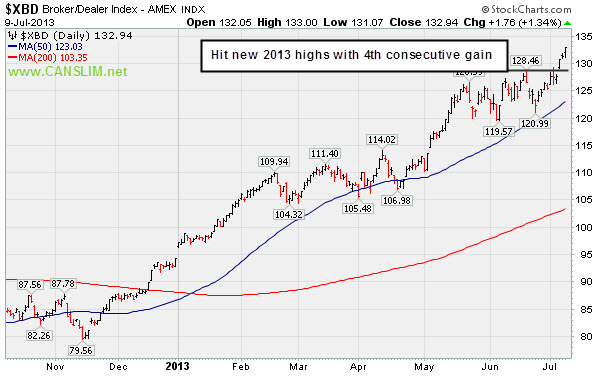
PICTURED: The Broker/Dealer Index ($XBD +1.34%) hit another new 2013 high with its 4th consecutive gain.
| Oil Services |
$OSX |
266.05 |
+2.70 |
+1.03% |
+20.84% |
| Healthcare |
$HMO |
3,313.75 |
+29.91 |
+0.91% |
+31.80% |
| Integrated Oil |
$XOI |
1,357.70 |
+6.82 |
+0.51% |
+9.33% |
| Semiconductor |
$SOX |
471.41 |
+4.91 |
+1.05% |
+22.74% |
| Networking |
$NWX |
264.06 |
+0.27 |
+0.10% |
+16.56% |
| Internet |
$IIX |
388.85 |
+3.55 |
+0.92% |
+18.91% |
| Broker/Dealer |
$XBD |
132.94 |
+1.76 |
+1.34% |
+40.93% |
| Retail |
$RLX |
826.16 |
+4.48 |
+0.55% |
+26.51% |
| Gold & Silver |
$XAU |
85.99 |
+1.01 |
+1.19% |
-48.07% |
| Bank |
$BKX |
64.57 |
+0.28 |
+0.44% |
+25.92% |
| Biotech |
$BTK |
2,040.37 |
+11.94 |
+0.59% |
+31.89% |
|
|
|
 |
Posted 10th Consecutive Gain, Getting Extended From Base
Kenneth J. Gruneisen - Passed the CAN SLIM® Master's Exam
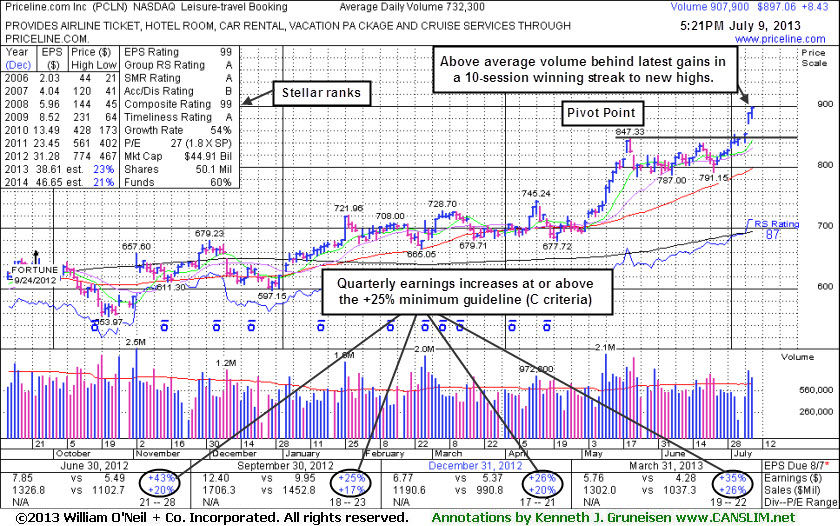
Priceline.com Inc. (PCLN +$8.43 or +0.95% to $897.06) rallied above its "max buy" level and further with above average volume behind its 10th consecutive gain while hitting new 52-week and all-time highs. On the prior session it finished strong with a gain backed by +61% above average volume triggering a technical buy signal after highlighted in yellow with pivot point cited based on its 5/21/13 high plus 10 cents in the earlier mid-day report (read here). Prior to that it wedged higher with gains lacking great volume conviction while rising from an orderly base formed after clearing its 2012 highs with a streak of volume-driven gains in May. The Leisure - Travel Booking firm has earned stellar ranks. The company reported earnings +35% on +26% sales revenues for the latest quarter ended March 31, 2013 versus the year ago period, maintaining a strong earnings history that satisfies both the C and A criteria.
PCLN had been dropped from the Featured Stocks list on 5/14/12 when an annotated graph was included under the headline, "Slump Created Overhead Supply That May Now Act As Resistance". Following that appearance it went through a long and deep consolidation below its 200-day moving average (DMA) line and subsequently rebounded to its prior highs one year later.
Keep in mind, the investment system's biggest winning models were typically held by at least a few mutual funds and attracting many others. However, once a stock is very heavily owned by a long list of mutual funds, as is now the case with PCLN, investors should be especially cautious and alert for any technical sell signals or fundamental disappointments which could prompt a rush for the exits. The number of top-rated funds owning its shares rose from 1,528 in Sep '12 to 1,615 in Mar '13, and increasing interest is an encouraging sign concerning the I criteria.
|
|
|
Color Codes Explained :
Y - Better candidates highlighted by our
staff of experts.
G - Previously featured
in past reports as yellow but may no longer be buyable under the
guidelines.
***Last / Change / Volume data in this table is the closing quote data***
Symbol/Exchange
Company Name
Industry Group |
PRICE |
CHANGE
(%Change) |
Day High |
Volume
(% DAV)
(% 50 day avg vol) |
52 Wk Hi
% From Hi |
Featured
Date |
Price
Featured |
Pivot Featured |
|
Max Buy |
AMBA
-
NASDAQ
Ambarella Inc
ELECTRONICS - Semiconductor - Specialized
|
$16.90
|
-0.08
-0.47% |
$17.17
|
451,680
38.36% of 50 DAV
50 DAV is 1,177,500
|
$18.58
-9.04%
|
5/6/2013
|
$15.31
|
PP = $16.10
|
|
MB = $16.91
|
Most Recent Note - 7/8/2013 2:03:36 PM
G - Quietly consolidating near its "max buy" level. Found support while recently consolidating above its 50 DMA line - important chart support where a violation would trigger a worrisome technical sell signal.
>>> The latest Featured Stock Update with an annotated graph appeared on 6/27/2013. Click here.
View all notes |
Alert me of new notes |
CANSLIM.net Company Profile |
SEC |
Zacks Reports |
StockTalk |
News |
Chart |
Request a new note
C
A N
S L
I M


|
EQM
-
NYSE
E Q T Midstream Partners
ENERGY - Oil and Gas Pipelines
|
$45.35
|
-2.10
-4.43% |
$47.50
|
381,217
241.43% of 50 DAV
50 DAV is 157,900
|
$51.72
-12.32%
|
4/25/2013
|
$40.16
|
PP = $40.84
|
|
MB = $42.88
|
 Most Recent Note - 7/9/2013 5:47:10 PM
G - Slid further below its 50 DMA line with today's loss on above average volume raising concerns. Finished near the session low and below the closing price on the day of its significant prior low ($44.83 on 6/05/13) previously noted as important support.
>>> The latest Featured Stock Update with an annotated graph appeared on 7/1/2013. Click here.
View all notes |
Alert me of new notes |
CANSLIM.net Company Profile |
SEC |
Zacks Reports |
StockTalk |
News |
Chart |
Request a new note
C
A N
S L
I M
|
FLT
-
NYSE
Fleetcor Technologies
DIVERSIFIED SERVICES - Business/Management Services
|
$85.80
|
+1.54
1.83% |
$85.85
|
765,176
85.75% of 50 DAV
50 DAV is 892,300
|
$89.75
-4.40%
|
5/29/2013
|
$86.02
|
PP = $85.66
|
|
MB = $89.94
|
Most Recent Note - 7/9/2013 5:50:14 PM
G- Rose from its 50 DMA line and finished near the session high with below average volume behind its gain. The recent low ($80.28 on 6/21/13) defines important near-term support where a violation would raise more serious concerns.
>>> The latest Featured Stock Update with an annotated graph appeared on 6/28/2013. Click here.
View all notes |
Alert me of new notes |
CANSLIM.net Company Profile |
SEC |
Zacks Reports |
StockTalk |
News |
Chart |
Request a new note
C
A N
S L
I M
|
LOPE
-
NASDAQ
Grand Canyon Education
DIVERSIFIED SERVICES - Education and; Training Services
|
$34.84
|
+0.33
0.96% |
$35.16
|
549,369
130.24% of 50 DAV
50 DAV is 421,800
|
$35.17
-0.94%
|
6/19/2013
|
$31.47
|
PP = $34.17
|
|
MB = $35.88
|
Most Recent Note - 7/5/2013 6:36:54 PM
Y - Touched a new 52-week high but reversed into the red at the close. Subsequent volume driven gains above its pivot point may trigger a new technical buy signal. Its 50 DMA line and recent lows define support in the $30-31 area.
>>> The latest Featured Stock Update with an annotated graph appeared on 7/2/2013. Click here.
View all notes |
Alert me of new notes |
CANSLIM.net Company Profile |
SEC |
Zacks Reports |
StockTalk |
News |
Chart |
Request a new note
C
A N
S L
I M
|
PCLN
-
NASDAQ
Priceline.Com Inc
INTERNET - Internet Software and Services
|
$897.06
|
+8.43
0.95% |
$900.40
|
904,070
123.46% of 50 DAV
50 DAV is 732,300
|
$889.40
0.86%
|
7/8/2013
|
$878.28
|
PP = $847.43
|
|
MB = $889.80
|
Most Recent Note - 7/9/2013 6:27:28 PM
G - Rallied above its "max buy" level with today's 10th consecutive gain and its color code is changed to green while getting extended from its base. Prior highs in the $847 area define initial support to watch on pullbacks. See the latest FSU analysis for more details and a new annotated graph.
>>> The latest Featured Stock Update with an annotated graph appeared on 7/9/2013. Click here.
View all notes |
Alert me of new notes |
CANSLIM.net Company Profile |
SEC |
Zacks Reports |
StockTalk |
News |
Chart |
Request a new note
C
A N
S L
I M
|
Symbol/Exchange
Company Name
Industry Group |
PRICE |
CHANGE
(%Change) |
Day High |
Volume
(% DAV)
(% 50 day avg vol) |
52 Wk Hi
% From Hi |
Featured
Date |
Price
Featured |
Pivot Featured |
|
Max Buy |
PRAA
-
NASDAQ
Portfolio Recovery Assoc
DIVERSIFIED SERVICES - Business/Management Services
|
$146.51
|
-2.85
-1.91% |
$151.83
|
202,468
222.49% of 50 DAV
50 DAV is 91,000
|
$163.87
-10.59%
|
5/1/2013
|
$130.77
|
PP = $127.88
|
|
MB = $134.27
|
Most Recent Note - 7/9/2013 6:29:39 PM
G - Violated important support at its 50 DMA line today with a 2nd consecutive damaging loss with above average volume raising greater concerns and triggering a technical sell signal.
>>> The latest Featured Stock Update with an annotated graph appeared on 6/25/2013. Click here.
View all notes |
Alert me of new notes |
CANSLIM.net Company Profile |
SEC |
Zacks Reports |
StockTalk |
News |
Chart |
Request a new note
C
A N
S L
I M
|
PRLB
-
NYSE
Proto Labs Inc
MANUFACTURING - Small Tools and Accessories
|
$63.38
|
-0.76
-1.18% |
$64.97
|
405,722
86.84% of 50 DAV
50 DAV is 467,200
|
$67.40
-5.96%
|
6/17/2013
|
$59.37
|
PP = $59.94
|
|
MB = $62.94
|
Most Recent Note - 7/8/2013 2:08:25 PM
G- Still holding its ground stubbornly near its 52-week high with volume totals cooling following a "negative reversal" on 6/28/13 with heavy volume. Prior highs near $59 define important near-term support above its 50 DMA line.
>>> The latest Featured Stock Update with an annotated graph appeared on 6/26/2013. Click here.
View all notes |
Alert me of new notes |
CANSLIM.net Company Profile |
SEC |
Zacks Reports |
StockTalk |
News |
Chart |
Request a new note
C
A N
S L
I M
|
RRTS
-
NYSE
Roadrunner Trans Systems
TRANSPORTATION - Air Delivery and Freight Service
|
$29.54
|
+1.18
4.16% |
$29.55
|
129,966
63.06% of 50 DAV
50 DAV is 206,100
|
$29.52
0.07%
|
4/3/2013
|
$22.77
|
PP = $23.75
|
|
MB = $24.94
|
Most Recent Note - 7/5/2013 6:32:20 PM
G - Finished at the session high and 2 cents off its best-ever close with a gain on below average volume. Wedged higher without great volume conviction after finding support above its 50 DMA line. Perched within close striking distance of its 52-week high.
>>> The latest Featured Stock Update with an annotated graph appeared on 7/3/2013. Click here.
View all notes |
Alert me of new notes |
CANSLIM.net Company Profile |
SEC |
Zacks Reports |
StockTalk |
News |
Chart |
Request a new note
C
A N
S L
I M
|
SSYS
-
NASDAQ
Stratasys Ltd
COMPUTER HARDWARE - Computer Peripherals
|
$87.73
|
-2.62
-2.90% |
$91.00
|
1,206,110
152.50% of 50 DAV
50 DAV is 790,900
|
$94.90
-7.55%
|
7/8/2013
|
$91.44
|
PP = $95.00
|
|
MB = $99.75
|
Most Recent Note - 7/9/2013 1:00:53 PM
Y - Pulling back today following a "negative reversal" on the prior session with above average volume. The pivot point cited is based on its 5/14/13 high plus 10 cents, and very little resistance remains due to overhead supply. Earnings history above the +25% minimum guideline satisfies the C criteria. The 7/05/13 mid-day report noted - "Reported earnings +54% on +116% sales revenues for the Mar '13 quarter versus the year ago period." See the latest FSU analysis for more details and a new annotated graph.
>>> The latest Featured Stock Update with an annotated graph appeared on 7/8/2013. Click here.
View all notes |
Alert me of new notes |
CANSLIM.net Company Profile |
SEC |
Zacks Reports |
StockTalk |
News |
Chart |
Request a new note
C
A N
S L
I M
|
VRX
-
NYSE
Valeant Pharmaceuticals
DRUGS - Drug Manufacturers - Other
|
$89.96
|
-0.07
-0.08% |
$90.96
|
1,506,724
72.10% of 50 DAV
50 DAV is 2,089,900
|
$96.25
-6.54%
|
4/30/2013
|
$60.24
|
PP = $76.66
|
|
MB = $80.49
|
Most Recent Note - 7/5/2013 6:33:02 PM
G- Holding its ground since completing a new Public Offering on 6/18/13 following recent M&A news. Concerns were raised by its sub par Mar '13 earnings report. See the latest FSU analysis for more details and a new annotated graph.
>>> The latest Featured Stock Update with an annotated graph appeared on 7/5/2013. Click here.
View all notes |
Alert me of new notes |
CANSLIM.net Company Profile |
SEC |
Zacks Reports |
StockTalk |
News |
Chart |
Request a new note
C
A N
S L
I M
|
Symbol/Exchange
Company Name
Industry Group |
PRICE |
CHANGE
(%Change) |
Day High |
Volume
(% DAV)
(% 50 day avg vol) |
52 Wk Hi
% From Hi |
Featured
Date |
Price
Featured |
Pivot Featured |
|
Max Buy |
|
|
|
THESE ARE NOT BUY RECOMMENDATIONS!
Comments contained in the body of this report are technical
opinions only. The material herein has been obtained
from sources believed to be reliable and accurate, however,
its accuracy and completeness cannot be guaranteed.
This site is not an investment advisor, hence it does
not endorse or recommend any securities or other investments.
Any recommendation contained in this report may not
be suitable for all investors and it is not to be deemed
an offer or solicitation on our part with respect to
the purchase or sale of any securities. All trademarks,
service marks and trade names appearing in this report
are the property of their respective owners, and are
likewise used for identification purposes only.
This report is a service available
only to active Paid Premium Members.
You may opt-out of receiving report notifications
at any time. Questions or comments may be submitted
by writing to Premium Membership Services 665 S.E. 10 Street, Suite 201 Deerfield Beach, FL 33441-5634 or by calling 1-800-965-8307
or 954-785-1121.
|
|
|

