Symbol/Exchange
Company Name
Industry Group |
PRICE |
CHANGE
(%Change) |
Day High |
Volume
(% DAV)
(% 50 day avg vol) |
52 Wk Hi
% From Hi |
Featured
Date |
Price
Featured |
Pivot Featured |
|
Max Buy |
ALXN
-
NASDAQ
Alexion Pharmaceuticals
DRUGS - Drug Manufacturers - Other
|
$100.43
|
-0.82
-0.81% |
$102.17
|
1,269,653
58.05% of 50 DAV
50 DAV is 2,187,100
|
$104.38
-3.78%
|
5/1/2012
|
$91.73
|
PP = $95.11
|
|
MB = $99.87
|
 Most Recent Note - 7/9/2012 4:32:43 PM
G - Quietly consolidating just above its "max buy" level. Prior highs in the $95 area define support to watch on pullbacks.
>>> The latest Featured Stock Update with an annotated graph appeared on 6/29/2012. Click here.
View all notes |
Alert me of new notes |
CANSLIM.net Company Profile |
SEC |
Zacks Reports |
StockTalk |
News |
Chart |
Request a new note
C
A N
S L
I M


|
ASPS
-
NASDAQ
Altisource Ptf Sltns Sa
REAL ESTATE - Property Management/Developmen
|
$74.36
|
-0.08
-0.11% |
$74.44
|
113,594
84.96% of 50 DAV
50 DAV is 133,700
|
$76.20
-2.41%
|
6/5/2012
|
$60.01
|
PP = $63.00
|
|
MB = $66.15
|
Most Recent Note - 7/9/2012 4:44:22 PM
G - Still stubbornly holding its ground near its 52-week high, extended from its prior base. Prior highs in the $65 area define support to watch on pullbacks.
>>> The latest Featured Stock Update with an annotated graph appeared on 7/3/2012. Click here.
View all notes |
Alert me of new notes |
CANSLIM.net Company Profile |
SEC |
Zacks Reports |
StockTalk |
News |
Chart |
Request a new note
C
A N
S L
I M
|
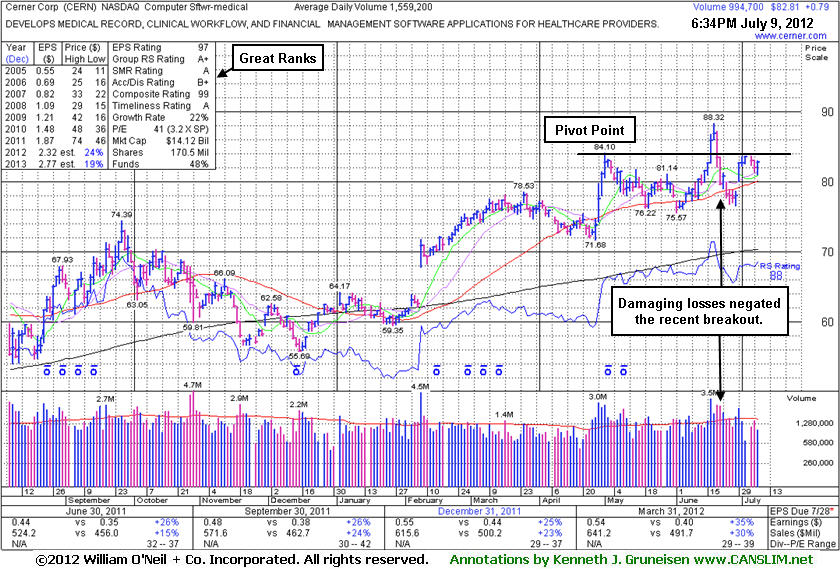
CERN
-
NASDAQ
Cerner Corp
COMPUTER SOFTWARE and SERVICES - Healthcare Information Service
|
$82.81
|
+0.79
0.96% |
$83.00
|
996,401
63.90% of 50 DAV
50 DAV is 1,559,200
|
$88.32
-6.24%
|
6/7/2012
|
$78.36
|
PP = $84.20
|
|
MB = $88.41
|
Most Recent Note - 7/9/2012 7:00:02 PM
G - Holding its ground since rebounding back above its 50 DMA line helping its technical stance. It has not formed a proper base since negating its prior breakout. See the latest FSU analysis for more details and a new annotated daily graph.
>>> The latest Featured Stock Update with an annotated graph appeared on 7/9/2012. Click here.
View all notes |
Alert me of new notes |
CANSLIM.net Company Profile |
SEC |
Zacks Reports |
StockTalk |
News |
Chart |
Request a new note
C
A N
S L
I M
|
CMCSA
-
NASDAQ
Comcast Corp Cl A
MEDIA - CATV Systems
|
$31.27
|
-0.09
-0.29% |
$31.52
|
10,656,272
75.61% of 50 DAV
50 DAV is 14,094,600
|
$32.50
-3.78%
|
6/11/2012
|
$29.94
|
PP = $30.98
|
|
MB = $32.53
|
Most Recent Note - 7/5/2012 1:06:14 PM
Y - Quietly consolidating near its 52-week high today. No overhead supply remains to act as resistance and it is still trading below its "max buy" level.
>>> The latest Featured Stock Update with an annotated graph appeared on 6/11/2012. Click here.
View all notes |
Alert me of new notes |
CANSLIM.net Company Profile |
SEC |
Zacks Reports |
StockTalk |
News |
Chart |
Request a new note
C
A N
S L
I M
|
CSTR
-
NASDAQ
Coinstar Inc
DIVERSIFIED SERVICES - Personal Services
|
$68.93
|
-2.00
-2.82% |
$71.66
|
952,452
87.49% of 50 DAV
50 DAV is 1,088,700
|
$71.82
-4.02%
|
6/26/2012
|
$64.05
|
PP = $67.00
|
|
MB = $70.35
|
Most Recent Note - 7/9/2012 4:35:31 PM
Y - Pulled back below its "max buy" level today with a loss on below average volume, and its color code is changed to yellow. Disciplined investors always limit losses by selling if any stock falls more than -7% from their purchase price.
>>> The latest Featured Stock Update with an annotated graph appeared on 6/26/2012. Click here.
View all notes |
Alert me of new notes |
CANSLIM.net Company Profile |
SEC |
Zacks Reports |
StockTalk |
News |
Chart |
Request a new note
C
A N
S L
I M
|
Symbol/Exchange
Company Name
Industry Group |
PRICE |
CHANGE
(%Change) |
Day High |
Volume
(% DAV)
(% 50 day avg vol) |
52 Wk Hi
% From Hi |
Featured
Date |
Price
Featured |
Pivot Featured |
|
Max Buy |
DG
-
NYSE
Dollar General Corp
RETAIL - Discount, Variety Stores
|
$54.86
|
+0.27
0.49% |
$55.07
|
1,496,525
38.85% of 50 DAV
50 DAV is 3,852,100
|
$55.30
-0.80%
|
5/7/2012
|
$48.51
|
PP = $47.69
|
|
MB = $50.07
|
Most Recent Note - 7/5/2012 4:00:34 PM
G - Posted a small gain today with average volume, hovering near its all-time high, extended from its prior base. Completed another Secondary Offering on 6/05/12, its 4th Secondary Offering since September '11.
>>> The latest Featured Stock Update with an annotated graph appeared on 6/12/2012. Click here.
View all notes |
Alert me of new notes |
CANSLIM.net Company Profile |
SEC |
Zacks Reports |
StockTalk |
News |
Chart |
Request a new note
C
A N
S L
I M
|
ECHO
-
NASDAQ
Echo Global Logistics
DIVERSIFIED SERVICES - Business/Management Services
|
$18.89
|
+0.32
1.72% |
$18.91
|
106,360
92.57% of 50 DAV
50 DAV is 114,900
|
$19.48
-3.03%
|
6/22/2012
|
$18.98
|
PP = $19.48
|
|
MB = $20.45
|
Most Recent Note - 7/9/2012 4:39:45 PM
Y - Posted a gain and closed near the session high today. Last week's volume-driven gains were followed by a gap down on 7/03/12 with higher volume after not quite triggering a technical buy signal under the fact-based system.
>>> The latest Featured Stock Update with an annotated graph appeared on 6/22/2012. Click here.
View all notes |
Alert me of new notes |
CANSLIM.net Company Profile |
SEC |
Zacks Reports |
StockTalk |
News |
Chart |
Request a new note
C
A N
S L
I M
|
EXPE
-
NASDAQ
Expedia Inc
INTERNET - Internet Information Providers
|
$47.47
|
-0.25
-0.52% |
$47.86
|
1,832,978
39.32% of 50 DAV
50 DAV is 4,661,300
|
$50.66
-6.30%
|
4/27/2012
|
$41.80
|
PP = $35.57
|
|
MB = $37.35
|
Most Recent Note - 7/9/2012 4:41:37 PM
G - Consolidating above its 50 DMA line and it finished -6.3% off its 52-week high with a 4th consecutive loss today on light volume. It is extended from its prior highs in the $43 area and its 50 DMA line which define support.
>>> The latest Featured Stock Update with an annotated graph appeared on 6/8/2012. Click here.
View all notes |
Alert me of new notes |
CANSLIM.net Company Profile |
SEC |
Zacks Reports |
StockTalk |
News |
Chart |
Request a new note
C
A N
S L
I M
|
GNC
-
NYSE
G N C Holdings Inc
RETAIL - Drug Stores
|
$41.94
|
-0.20
-0.47% |
$42.60
|
1,079,088
45.45% of 50 DAV
50 DAV is 2,374,200
|
$42.70
-1.78%
|
6/29/2012
|
$39.20
|
PP = $40.00
|
|
MB = $42.00
|
Most Recent Note - 7/5/2012 4:40:06 PM
G - Color code is changed to green after today's 7th consecutive gain lifted it above the "max buy" level. Its 7/02/12 gain above the pivot point triggered a new (or add-on) technical buy signal. See the latest FSU analysis for more details and a new annotated graph.
>>> The latest Featured Stock Update with an annotated graph appeared on 7/5/2012. Click here.
View all notes |
Alert me of new notes |
CANSLIM.net Company Profile |
SEC |
Zacks Reports |
StockTalk |
News |
Chart |
Request a new note
C
A N
S L
I M
|
GPX
-
NYSE
G P Strategies Corp
DIVERSIFIED SERVICES - Education and Training Services
|
$17.79
|
-0.59
-3.21% |
$18.34
|
49,599
86.11% of 50 DAV
50 DAV is 57,600
|
$18.99
-6.32%
|
6/29/2012
|
$18.01
|
PP = $18.15
|
|
MB = $19.06
|
Most Recent Note - 7/9/2012 4:54:04 PM
Y - Today's 3rd consecutive loss on lighter volume undercut prior highs and led to a finish back below its old high close. The damaging loss completely negated the recent breakout and raised concerns while closing near the session low.
>>> The latest Featured Stock Update with an annotated graph appeared on 7/6/2012. Click here.
View all notes |
Alert me of new notes |
CANSLIM.net Company Profile |
SEC |
Zacks Reports |
StockTalk |
News |
Chart |
Request a new note
C
A N
S L
I M
|
Symbol/Exchange
Company Name
Industry Group |
PRICE |
CHANGE
(%Change) |
Day High |
Volume
(% DAV)
(% 50 day avg vol) |
52 Wk Hi
% From Hi |
Featured
Date |
Price
Featured |
Pivot Featured |
|
Max Buy |
MLNX
-
NASDAQ
Mellanox Technologies
ELECTRONICS - Semiconductor - Broad Line
|
$73.40
|
-0.32
-0.43% |
$75.45
|
634,428
109.21% of 50 DAV
50 DAV is 580,900
|
$77.69
-5.52%
|
6/18/2012
|
$70.90
|
PP = $67.30
|
|
MB = $70.67
|
Most Recent Note - 7/6/2012 6:27:40 PM
G - Pulled back today on average volume from its all-time high after getting extended from its prior base with a spurt of volume-driven gains. Recent chart lows define near-term support to watch above its 50 DMA line.
>>> The latest Featured Stock Update with an annotated graph appeared on 6/25/2012. Click here.
View all notes |
Alert me of new notes |
CANSLIM.net Company Profile |
SEC |
Zacks Reports |
StockTalk |
News |
Chart |
Request a new note
C
A N
S L
I M
|
N
-
NYSE
Netsuite Inc
DIVERSIFIED SERVICES - Business/Management Services
|
$51.16
|
-2.56
-4.77% |
$54.03
|
956,626
172.65% of 50 DAV
50 DAV is 554,100
|
$56.06
-8.74%
|
6/20/2012
|
$51.83
|
PP = $51.88
|
|
MB = $54.47
|
Most Recent Note - 7/9/2012 4:56:55 PM
Y - Damaging loss on above average volume today undercut its pivot point and negated its recent breakout raising concerns. Disciplined investors always limit losses by selling if any stock falls more than -7% from their purchase price.
>>> The latest Featured Stock Update with an annotated graph appeared on 6/20/2012. Click here.
View all notes |
Alert me of new notes |
CANSLIM.net Company Profile |
SEC |
Zacks Reports |
StockTalk |
News |
Chart |
Request a new note
C
A N
S L
I M
|
NSM
-
NYSE
Nationstar Mtg Hldgs Inc
FINANCIAL SERVICES - Credit Services
|
$24.60
|
+0.36
1.49% |
$24.72
|
489,809
62.84% of 50 DAV
50 DAV is 779,500
|
$24.55
0.20%
|
6/27/2012
|
$20.29
|
PP = $20.46
|
|
MB = $21.48
|
Most Recent Note - 7/9/2012 4:57:51 PM
G - Hit yet another new 52-week high today with lighter volume behind an 8th consecutive gain, getting more extended from its prior base. Prior highs in the $20 area define important support to watch on pullbacks.
>>> The latest Featured Stock Update with an annotated graph appeared on 6/27/2012. Click here.
View all notes |
Alert me of new notes |
CANSLIM.net Company Profile |
SEC |
Zacks Reports |
StockTalk |
News |
Chart |
Request a new note
C
A N
S L
I M
|
NTES
-
NASDAQ
Netease Inc Adr
INTERNET - Internet Information Providers
|
$58.69
|
-1.37
-2.28% |
$60.31
|
415,411
56.37% of 50 DAV
50 DAV is 736,900
|
$65.54
-10.45%
|
3/19/2012
|
$56.18
|
PP = $55.10
|
|
MB = $57.86
|
Most Recent Note - 7/9/2012 4:59:39 PM
G - Sank below its 50 DMA line with today's loss on lighter volume again hurting its technical stance. Chart support to watch is near prior lows in the $55 area.
>>> The latest Featured Stock Update with an annotated graph appeared on 6/19/2012. Click here.
View all notes |
Alert me of new notes |
CANSLIM.net Company Profile |
SEC |
Zacks Reports |
StockTalk |
News |
Chart |
Request a new note
C
A N
S L
I M
|
SWI
-
NYSE
Solarwinds Inc
COMPUTER SOFTWARE and SERVICES - Application Software
|
$40.50
|
-2.11
-4.95% |
$41.52
|
3,224,574
297.85% of 50 DAV
50 DAV is 1,082,600
|
$48.64
-16.74%
|
4/26/2012
|
$45.15
|
PP = $42.32
|
|
MB = $44.44
|
Most Recent Note - 7/9/2012 11:24:55 AM
Gapped down today for another damaging loss following an analyst downgrade, violating the previously noted 6/04/11 low ($41.24) and triggering a more worrisome technical sell signal. Faces resistance due to overhead supply up through the $48 level, and it will be dropped from the Featured Stocks list tonight.
>>> The latest Featured Stock Update with an annotated graph appeared on 6/15/2012. Click here.
View all notes |
Alert me of new notes |
CANSLIM.net Company Profile |
SEC |
Zacks Reports |
StockTalk |
News |
Chart |
Request a new note
C
A N
S L
I M
|
Symbol/Exchange
Company Name
Industry Group |
PRICE |
CHANGE
(%Change) |
Day High |
Volume
(% DAV)
(% 50 day avg vol) |
52 Wk Hi
% From Hi |
Featured
Date |
Price
Featured |
Pivot Featured |
|
Max Buy |
SXCI
-
NASDAQ
S X C Health Solutions
COMPUTER SOFTWARE and SERVICES - Healthcare Information Service
|
$94.98
|
-0.43
-0.45% |
$98.55
|
1,627,518
137.67% of 50 DAV
50 DAV is 1,182,200
|
$104.79
-9.36%
|
6/14/2012
|
$94.71
|
PP = $100.60
|
|
MB = $105.63
|
Most Recent Note - 7/9/2012 12:27:46 PM
Y - Churning above average volume recently while not making headway above its pivot point. Reversed and closed in the red after trading up on a few prior sessions, and the "negative reversals" were noted as signs of distributional pressure.
>>> The latest Featured Stock Update with an annotated graph appeared on 6/14/2012. Click here.
View all notes |
Alert me of new notes |
CANSLIM.net Company Profile |
SEC |
Zacks Reports |
StockTalk |
News |
Chart |
Request a new note
C
A N
S L
I M
|
TDG
-
NYSE
Transdigm Group Inc
AEROSPACE/DEFENSE - Aerospace/Defense Products and; Services
|
$130.96
|
+0.08
0.06% |
$132.06
|
173,185
31.33% of 50 DAV
50 DAV is 552,800
|
$136.34
-3.94%
|
6/18/2012
|
$127.00
|
PP = $132.79
|
|
MB = $139.43
|
Most Recent Note - 7/5/2012 1:08:51 PM
Y - Holding its ground since last noted when its 6/29/12 gain above its pivot point was backed by only +32% above average volume, below the minimum threshold need to trigger a proper new (or add-on) technical buy signal. Its 50 DMA line defines important support to watch.
>>> The latest Featured Stock Update with an annotated graph appeared on 6/18/2012. Click here.
View all notes |
Alert me of new notes |
CANSLIM.net Company Profile |
SEC |
Zacks Reports |
StockTalk |
News |
Chart |
Request a new note
C
A N
S L
I M
|
TNGO
-
NASDAQ
Tangoe Inc
COMPUTER SOFTWARE and SERVICES - Technical and System Software
|
$20.96
|
-0.47
-2.19% |
$21.54
|
284,543
53.01% of 50 DAV
50 DAV is 536,800
|
$23.05
-9.07%
|
6/27/2012
|
$21.70
|
PP = $23.15
|
|
MB = $24.31
|
Most Recent Note - 7/6/2012 6:21:45 PM
Y - Pulled back near its 50 DMA line with a loss on light volume today. Gains above the pivot point backed by +40% above average volume or greater could trigger a new technical buy signal.
>>> The latest Featured Stock Update with an annotated graph appeared on 6/28/2012. Click here.
View all notes |
Alert me of new notes |
CANSLIM.net Company Profile |
SEC |
Zacks Reports |
StockTalk |
News |
Chart |
Request a new note
C
A N
S L
I M
|
VSI
-
NYSE
Vitamin Shoppe Inc
SPECIALTY RETAIL - Specialty Retail, Other
|
$56.74
|
+0.80
1.43% |
$57.22
|
478,301
94.25% of 50 DAV
50 DAV is 507,500
|
$57.52
-1.35%
|
6/29/2012
|
$54.93
|
PP = $55.03
|
|
MB = $57.78
|
Most Recent Note - 7/9/2012 4:49:33 PM
Y - Gain today with near average volume led to a finish near its 52-week high. Recent gains helped it trade above the new pivot point based on its 6/22/12 high after forming an 8-week cup-with-handle base, but the gains have lacked the volume required to trigger a proper new (or add-on) technical buy signal.
>>> The latest Featured Stock Update with an annotated graph appeared on 7/2/2012. Click here.
View all notes |
Alert me of new notes |
CANSLIM.net Company Profile |
SEC |
Zacks Reports |
StockTalk |
News |
Chart |
Request a new note
C
A N
S L
I M
|
WFM
-
NASDAQ
Whole Foods Market Inc
RETAIL - Grocery Stores
|
$94.12
|
-0.96
-1.01% |
$95.52
|
856,535
42.43% of 50 DAV
50 DAV is 2,018,800
|
$97.25
-3.22%
|
6/13/2012
|
$89.90
|
PP = $91.60
|
|
MB = $96.18
|
Most Recent Note - 7/5/2012 1:12:05 PM
G - Color code is changed to green after inching above its "max buy" level. Recently hovering near its 52-week high with no resistance remaining due to overhead supply. Its prior highs in the $91.50 area define initial support to watch on pullbacks.
>>> The latest Featured Stock Update with an annotated graph appeared on 6/13/2012. Click here.
View all notes |
Alert me of new notes |
CANSLIM.net Company Profile |
SEC |
Zacks Reports |
StockTalk |
News |
Chart |
Request a new note
C
A N
S L
I M
|
Symbol/Exchange
Company Name
Industry Group |
PRICE |
CHANGE
(%Change) |
Day High |
Volume
(% DAV)
(% 50 day avg vol) |
52 Wk Hi
% From Hi |
Featured
Date |
Price
Featured |
Pivot Featured |
|
Max Buy |