You are not logged in.
This means you
CAN ONLY VIEW reports that were published prior to Monday, April 14, 2025.
You
MUST UPGRADE YOUR MEMBERSHIP if you want to see any current reports.
AFTER MARKET UPDATE - FRIDAY, JULY 9TH, 2010
Previous After Market Report Next After Market Report >>>
|
|
|
|
DOW |
+59.04 |
10,198.03 |
+0.58% |
|
Volume |
882,450,160 |
-24% |
|
Volume |
1,556,162,790 |
-22% |
|
NASDAQ |
+21.05 |
2,196.45 |
+0.97% |
|
Advancers |
2,395 |
77% |
|
Advancers |
1,988 |
72% |
|
S&P 500 |
+7.71 |
1,077.96 |
+0.72% |
|
Decliners |
635 |
20% |
|
Decliners |
654 |
24% |
|
Russell 2000 |
+9.16 |
629.43 |
+1.48% |
|
52 Wk Highs |
87 |
|
|
52 Wk Highs |
23 |
|
|
S&P 600 |
+4.55 |
338.56 |
+1.36% |
|
52 Wk Lows |
9 |
|
|
52 Wk Lows |
42 |
|
|
 |
Stock Bounce Back With Best Weekly Gains Of 2010
Adam Sarhan, Contributing Writer,
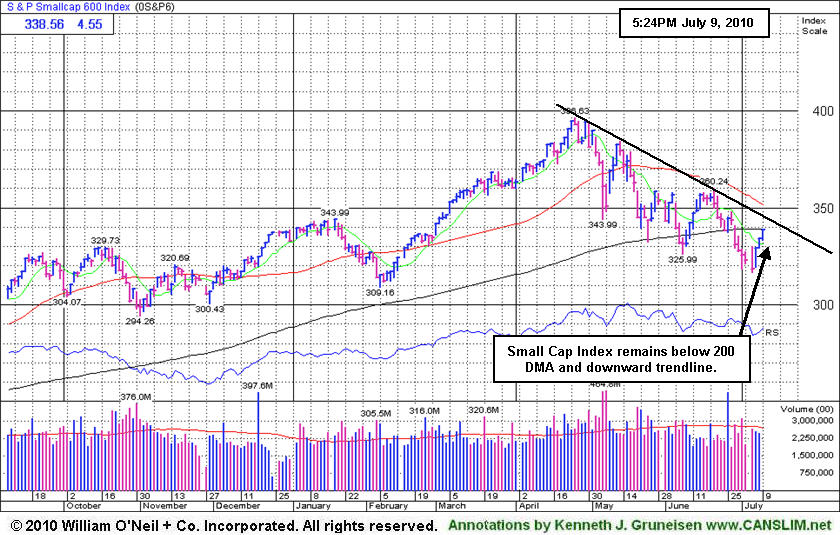
It was an impressive week on Wall Street: stocks confirmed their latest rally attempt on Wednesday, enjoyed their best weekly gain of the year, snapped a 2-week losing streak, and bounced from fresh 2010 lows. On Friday, volume, a critical component of institutional sponsorship, fell short of Thursday's levels on the NYSE and Nasdaq exchange. There were 16 high-ranked companies from the CANSLIM.net Leaders List that made a new 52-week high and appeared on the CANSLIM.net BreakOuts Page, higher than the 9 issues that appeared on the prior session. Advancers trumped decliners by more than 3-to-1 on the NYSE and on the Nasdaq exchange. New 52-week highs outnumbered new 52-week lows on the NYSE but trailed on the Nasdaq exchange. It remains critically important for leadership (new highs) to expand if the new rally effort will prove to be a sustained market advance. If not, Wednesday's strong move may turn out to be the latest in a string of failed rallies confirmed with follow-through days.
The stock market was closed on Monday in observance of Independence Day. Stocks edged higher on Tuesday after strong gains from Asia and Europe sparked optimism that an oversold technical bounce may occur. Economic news was less than stellar, the ISM service index grew at a slower than expected rate in June which led many to question the health of the ongoing global economic recovery.
On Wednesday, stocks scored a follow-through day (FTD) on the fourth day of their latest rally attempt. Further clarifying the day count as we see it, on Thursday, July 1, all of the major averages marked Day 1 of a new rally attempt. Although they closed that session with losses, strong finishes in the upper part of their intra-day ranges suggested that support was being found which, arguably, satisfied the essence of a new rally attempt. Since then, the Dow Jones Industrial Average and small-cap Russell 2000 index both undercut Thursday's lows which reset the day count for each, however, they both rallied on Tuesday which marked Day 1 for those two indexes. Meanwhile, the tech-heavy Nasdaq Composite and the benchmark S&P 500 Index avoided undercutting Thursday's lows, so Wednesday's session marked Day 4 and opened the window for a new FTD to emerge. Remember that there are three important characteristics that must occur in order for a sound FTD to emerge: One or more of the major averages must rally at least +1.7% (anytime after Day 3 of a new rally attempt), volume on the exchange(s) must be higher than the prior session, and a new batch of high-ranked leaders must hit new 52-week highs and trigger fresh technical buy signals.
On Thursday, stocks rallied after two positive economic data points eased concern that the economic recovery is getting worse: jobless claims fell and same store sales rose at several key retailers. The Labor Department said initial jobless claims fell by -21,000 to 454,000 last week. This was lower than the Street's forecast for a decline to 460,000 from an initially reported 472,000 during the prior week. The report showed that the number of people receiving unemployment insurance plunged to the lowest point since 2008, while those getting emergency benefits also fell after Congress failed to pass legislation extending the assistance. Elsewhere, a flurry of high profile retailers also reported stronger than expected same store sales for June. Stocks edged higher on Friday as investors await earnings season which is slated to begin next week.
Looking forward, the window is now open for disciplined investors to begin carefully buying high-ranked stocks again. The major indices' 200-day moving average (DMA) lines may act as near term resistance. Remember to remain very selective because all of the major averages are still trading below their downward sloping 50 and 200 DMA lines. It was also somewhat disconcerting to see volume remain light (below average) behind the confirming gains. It is important to note that approximately 75% of FTDs lead to new sustained rallies, while 25% fail. In addition, every major rally in market history has begun with a FTD, but not every FTD leads to a new rally. Trade accordingly.
Q2 Webcast Rewind: The Q2 2010 CANSLIM.net Webcast aired at 8PM on Wednesday, June 30, 2010. A link to the webcast has been added near the top on the Premium Membership Homepage which will allow all who have UPGRADED with a currently active premium (paid) membership to view the webcast ON DEMAND at any time. To UPGRADE now for access to the webcast and all premium reports CLICK HERE.
PICTURED: The S&P 600 Small Cap Index remains below its 200-day moving average (DMA) line and below a downward trendline. Subsequent improvement above those levels, technically, would be reassuring signs for the latest rally.
|
|
|
 |
Bank Index Flashing Signs Offering Hope Ahead Of Earnings Season
Kenneth J. Gruneisen - Passed the CAN SLIM® Master's Exam
Financial shares continued to help influence the major averages in a positive way as the Broker/Dealer Index ($XBD +1.52%) and Bank Index ($BKX +2.38%) both posted their 4th consecutive gains. The Gold & Silver Index ($XAU +2.46%) was also among Friday's big gainers, yet its gain still left it below its 50-day moving average (DMA) line after it fought back from below its 200 DMA line this week. The Biotechnology Index ($BTK +1.74%) and Semiconductor Index ($SOX +1.08%) outpaced the Networking Index ($NWX +0.72%) and Internet Index ($IIX +0.97%) while the tech indexes unanimously rose. There were modest gains from the Healthcare Index ($HMO +0.49%) and Retail Index ($RLX +0.60%), and small gains in energy-related shares helped the Integrated Oil Index ($XOI +0.53%) and Oil Services Index ($OSX +0.16%) also edge higher.
Charts courtesy www.stockcharts.com
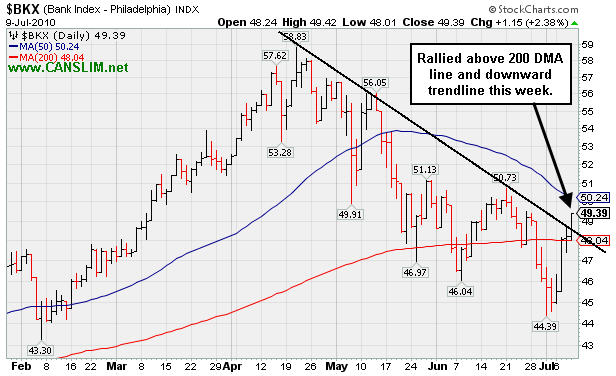
PICTURED: The Bank Index ($BKX +2.38%) rallied above 200 DMA line and a downward trendline. Considering financial group's importance as a leading indicator for the broader market averages, that technical improvement was an encouraging way to close out the week, especially as a nascent rally tries to get in gear ahead of earnings season.
| Oil Services |
$OSX |
177.49 |
+0.28 |
+0.16% |
-8.94% |
| Healthcare |
$HMO |
1,420.40 |
+6.86 |
+0.49% |
-3.57% |
| Integrated Oil |
$XOI |
946.07 |
+5.03 |
+0.53% |
-11.43% |
| Semiconductor |
$SOX |
351.36 |
+3.74 |
+1.08% |
-2.38% |
| Networking |
$NWX |
229.01 |
+1.64 |
+0.72% |
-0.89% |
| Internet |
$IIX |
232.97 |
+2.23 |
+0.97% |
-0.38% |
| Broker/Dealer |
$XBD |
100.97 |
+1.52 |
+1.52% |
-12.24% |
| Retail |
$RLX |
395.34 |
+2.37 |
+0.60% |
-3.84% |
| Gold & Silver |
$XAU |
175.09 |
+4.21 |
+2.46% |
+4.07% |
| Bank |
$BKX |
49.39 |
+1.15 |
+2.38% |
+15.64% |
| Biotech |
$BTK |
1,037.69 |
+17.78 |
+1.74% |
+10.14% |
|
|
|
 |
Gap Up Gain Quietly Helped Leader Hit All-Time High
Kenneth J. Gruneisen - Passed the CAN SLIM® Master's Exam
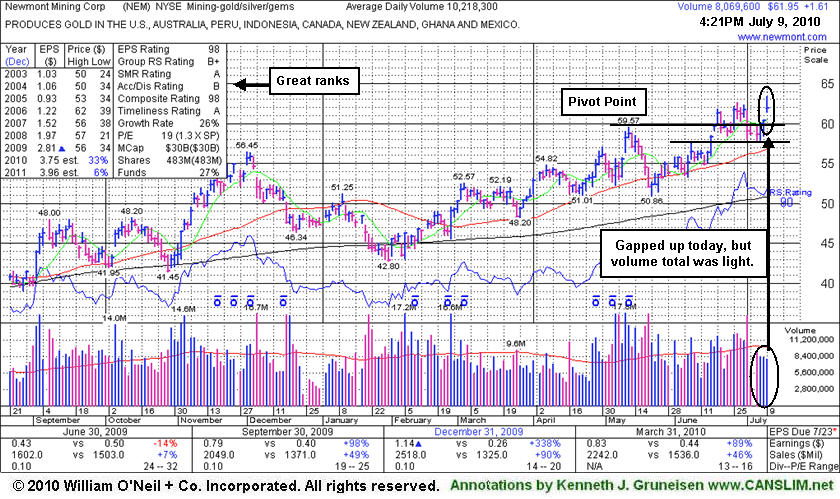
Newmont Mining Corporation (NEM +$1.61 or +2.64% to $61.95) gapped up today, but volume behind its gain was light again. It still marked a new high close, and no overhead supply remains to act as resistance. It briefly topped its January 2006 all-time high ($62.72), but closed in the lower half of its intra-day range. Volume behind recent gains has been below the minimum guidelines (since its mid-May breakout faltered). The America-based mining firm has very reassuring leadership (L criteria) from other Mining - Gold/Silver/Gems industry firms as a favorable backdrop. Many other gold mining interests are headquartered overseas which increases their potential pitfalls due to geopolitical shifts. The C and A criteria are satisfied as the company has demonstrated solid quarterly sales revenues and earnings increases (above the +25% minimum guideline) in recent comparisons and it has a good annual earnings history.
In a 6/22/10 Stock Bulletin (read here) members were told - "Look for an opportunity to properly pyramid buying efforts with chasing the stock more than 5% above its Pivot Point or 'Max Buy' level." Confirming gains on heavy volume in the coming days and weeks might come after it is too extended from an ideal buy point. Buyable breakouts require that the stock rise above its pivot point with considerable gains and those gains must be backed by a minimum of at least +40%-50% above average volume, ideally much more. Pyramiding into a position may be the most prudent way to let the market action dictate investors' entries. As always, it is of the utmost importance to sell a stock if it drops 7-8% below your purchase price.
|
|
|
Color Codes Explained :
Y - Better candidates highlighted by our
staff of experts.
G - Previously featured
in past reports as yellow but may no longer be buyable under the
guidelines.
***Last / Change / Volume data in this table is the closing quote data***
Symbol/Exchange
Company Name
Industry Group |
PRICE |
CHANGE
(%Change) |
Day High |
Volume
(% DAV)
(% 50 day avg vol) |
52 Wk Hi
% From Hi |
Featured
Date |
Price
Featured |
Pivot Featured |
|
Max Buy |
AAPL
-
NASDAQ
Apple Inc
COMPUTER HARDWARE - Personal Computers
|
$259.62
|
+1.53
0.59% |
$259.90
|
15,465,716
53.97% of 50 DAV
50 DAV is 28,656,000
|
$279.01
-6.95%
|
6/17/2010
|
$270.95
|
PP = $272.56
|
|
MB = $286.19
|
 Most Recent Note - 7/9/2010 3:17:45 PM
G - Gains with below average volume this week helped it rebound above its 50 DMA line after encountering heavy distribution the week before. Recent lows in the $242-243 area define important support to watch.
>>> The latest Featured Stock Update with an annotated graph appeared on 6/17/2010. Click here.
View all notes |
Alert me of new notes |
CANSLIM.net Company Profile |
SEC |
Zacks Reports |
StockTalk |
News |
Chart |
Request a new note
C
A N
S L
I M


|
ABV
-
NYSE
Comp De Bebidas Adr
FOOD and BEVERAGE - Beverages - Brewers
|
$106.80
|
+1.23
1.17% |
$107.00
|
451,917
60.86% of 50 DAV
50 DAV is 742,600
|
$109.33
-2.31%
|
6/29/2010
|
$104.74
|
PP = $109.33
|
|
MB = $114.80
|
Most Recent Note - 7/9/2010 3:21:47 PM
Y - Today marks the 6th consecutive gain for this Brazil-based beverage firm. It found support near its 50 DMA line recently and has not yet traded above its pivot point since featured in the 6/29/10 mid-day report (read here).
>>> The latest Featured Stock Update with an annotated graph appeared on 6/29/2010. Click here.
View all notes |
Alert me of new notes |
CANSLIM.net Company Profile |
SEC |
Zacks Reports |
StockTalk |
News |
Chart |
Request a new note
C
A N
S L
I M
|
APEI
-
NASDAQ
American Public Educ Inc
DIVERSIFIED SERVICES - Education and Training Services
|
$43.15
|
-0.09
-0.21% |
$43.30
|
110,874
62.93% of 50 DAV
50 DAV is 176,200
|
$48.95
-11.85%
|
6/7/2010
|
$46.60
|
PP = $46.29
|
|
MB = $48.60
|
Most Recent Note - 7/9/2010 3:25:46 PM
G - Based on weakness and its waning Relative Strength (now ranked 74) it will be dropped from the Featured Stocks list tonight. Trading below its 50 DMA line now, it would need to clear it and stubborn resistance in the $47-48 area for its outlook to turn bullish, technically.
>>> The latest Featured Stock Update with an annotated graph appeared on 7/2/2010. Click here.
View all notes |
Alert me of new notes |
CANSLIM.net Company Profile |
SEC |
Zacks Reports |
StockTalk |
News |
Chart |
Request a new note
C
A N
S L
I M
|
BIDU
-
NASDAQ
Baidu Inc Ads
INTERNET - Internet Information Providers
|
$71.20
|
-1.23
-1.70% |
$71.84
|
14,940,741
99.18% of 50 DAV
50 DAV is 15,063,900
|
$82.29
-13.48%
|
1/13/2010
|
$43.13
|
PP = $42.68
|
|
MB = $44.81
|
Most Recent Note - 7/9/2010 3:28:11 PM
G - Consolidating quietly near its 50 DMA line (now $71.71) while its prior lows in the $66 area define important chart support.
>>> The latest Featured Stock Update with an annotated graph appeared on 6/21/2010. Click here.
View all notes |
Alert me of new notes |
CANSLIM.net Company Profile |
SEC |
Zacks Reports |
StockTalk |
News |
Chart |
Request a new note
C
A N
S L
I M
|
CISG
-
NASDAQ
Cninsure Inc Ads
INSURANCE - Insurance Brokers
|
$24.73
|
-0.82
-3.21% |
$26.09
|
4,054,975
1,295.93% of 50 DAV
50 DAV is 312,900
|
$28.62
-13.59%
|
6/16/2010
|
$27.20
|
PP = $27.75
|
|
MB = $29.14
|
Most Recent Note - 7/9/2010 3:48:24 PM
G - Down today on higher volume after pricing offering of 4.6 million at $25 per share. In response to news it has plans for a new Stock Offering it gapped down on 7/08/10 and violated its 50 DMA line, raising concerns. Color code was changed to green based on the weak technical action and news immediately impacting fundamentals.
>>> The latest Featured Stock Update with an annotated graph appeared on 6/18/2010. Click here.
View all notes |
Alert me of new notes |
CANSLIM.net Company Profile |
SEC |
Zacks Reports |
StockTalk |
News |
Chart |
Request a new note
C
A N
S L
I M
|
Symbol/Exchange
Company Name
Industry Group |
PRICE |
CHANGE
(%Change) |
Day High |
Volume
(% DAV)
(% 50 day avg vol) |
52 Wk Hi
% From Hi |
Featured
Date |
Price
Featured |
Pivot Featured |
|
Max Buy |
CRM
-
NYSE
Salesforce.Com Inc
INTERNET - Internet Software and Services
|
$91.78
|
+0.21
0.23% |
$92.37
|
1,108,632
38.23% of 50 DAV
50 DAV is 2,899,900
|
$97.94
-6.29%
|
6/2/2010
|
$88.44
|
PP = $89.60
|
|
MB = $94.08
|
Most Recent Note - 7/9/2010 3:52:05 PM
Y - Rising further above its 50 DMA line today while posting a 7th consecutive gain on ever-decreasing volume. Recent low ($83.61 on 7/01/10) defines an important chart support level to watch now.
>>> The latest Featured Stock Update with an annotated graph appeared on 6/22/2010. Click here.
View all notes |
Alert me of new notes |
CANSLIM.net Company Profile |
SEC |
Zacks Reports |
StockTalk |
News |
Chart |
Request a new note
C
A N
S L
I M
|
CVLT
-
NASDAQ
Commvault Systems Inc
COMPUTER SOFTWARE and SERVICES - Business Software and Services
|
$23.39
|
+0.30
1.30% |
$23.40
|
293,550
50.97% of 50 DAV
50 DAV is 575,900
|
$24.51
-4.57%
|
7/6/2010
|
$23.16
|
PP = $24.45
|
|
MB = $25.67
|
Most Recent Note - 7/9/2010 3:55:48 PM
Y - Consolidating above its 50 and 200 DMA lines just -5% off its high, still building on the right side of a 6-month flat base. Featured in the 7/06/10 mid-day report (read here).
>>> The latest Featured Stock Update with an annotated graph appeared on 7/6/2010. Click here.
View all notes |
Alert me of new notes |
CANSLIM.net Company Profile |
SEC |
Zacks Reports |
StockTalk |
News |
Chart |
Request a new note
C
A N
S L
I M
|
DECK
-
NASDAQ
Deckers Outdoor Corp
CONSUMER NON-DURABLES - Textile - Apparel Footwear
|
$47.16
|
+0.16
0.34% |
$47.65
|
579,339
37.09% of 50 DAV
50 DAV is 1,561,800
|
$56.12
-15.96%
|
6/11/2010
|
$157.34
|
PP = $158.57
|
|
MB = $166.50
|
Most Recent Note - 7/9/2010 4:00:00 PM
G - Struggling below its 50 DMA line which may now act as resistance, while a rally above that short-term average would help its outlook, technically. Do not be confused, as the most recent Featured Price, Pivot Point and Max Buy levels have been adjusted to account for a stock split 3:1 effective as of 7/06/10.
>>> The latest Featured Stock Update with an annotated graph appeared on 7/1/2010. Click here.
View all notes |
Alert me of new notes |
CANSLIM.net Company Profile |
SEC |
Zacks Reports |
StockTalk |
News |
Chart |
Request a new note
C
A N
S L
I M
|
FFIV
-
NASDAQ
F 5 Networks Inc
INTERNET - Internet Software and Services
|
$75.23
|
-0.30
-0.40% |
$75.90
|
799,753
47.92% of 50 DAV
50 DAV is 1,668,900
|
$77.10
-2.43%
|
6/16/2010
|
$74.50
|
PP = $74.10
|
|
MB = $77.81
|
Most Recent Note - 7/9/2010 4:04:43 PM
Y - Perched only -2.5% off its 52-week high after rallying up from support at its 50 DMA line this week. Recent low ($66.79 on 7/01/10) now defines a near-term chart support level to watch.
>>> The latest Featured Stock Update with an annotated graph appeared on 7/7/2010. Click here.
View all notes |
Alert me of new notes |
CANSLIM.net Company Profile |
SEC |
Zacks Reports |
StockTalk |
News |
Chart |
Request a new note
C
A N
S L
I M
|
MELI
-
NASDAQ
Mercadolibre Inc
INTERNET - Internet Software and; Services
|
$59.12
|
+1.33
2.30% |
$59.40
|
701,901
76.94% of 50 DAV
50 DAV is 912,300
|
$62.14
-4.86%
|
5/13/2010
|
$54.21
|
PP = $55.85
|
|
MB = $58.64
|
Most Recent Note - 7/9/2010 4:06:27 PM
Y - Posted gains 4 days in a row after finding support near its 50 DMA line. Color code was changed to yellow based on its recent resilience. Its recent low ($49.55 on 7/01/10) now defines near-term chart support.
>>> The latest Featured Stock Update with an annotated graph appeared on 6/30/2010. Click here.
View all notes |
Alert me of new notes |
CANSLIM.net Company Profile |
SEC |
Zacks Reports |
StockTalk |
News |
Chart |
Request a new note
C
A N
S L
I M
|
Symbol/Exchange
Company Name
Industry Group |
PRICE |
CHANGE
(%Change) |
Day High |
Volume
(% DAV)
(% 50 day avg vol) |
52 Wk Hi
% From Hi |
Featured
Date |
Price
Featured |
Pivot Featured |
|
Max Buy |
NEM
-
NYSE
Newmont Mining Corp
METALS and MINING - Gold
|
$61.93
|
+1.59
2.64% |
$63.38
|
8,325,556
81.74% of 50 DAV
50 DAV is 10,185,100
|
$62.62
-1.10%
|
6/22/2010
|
$59.60
|
PP = $59.67
|
|
MB = $62.65
|
Most Recent Note - 7/9/2010 4:10:00 PM
Y - Gapped up today and rallied for a new high close with below average volume behind its 3rd consecutive gain.
>>> The latest Featured Stock Update with an annotated graph appeared on 7/9/2010. Click here.
View all notes |
Alert me of new notes |
CANSLIM.net Company Profile |
SEC |
Zacks Reports |
StockTalk |
News |
Chart |
Request a new note
C
A N
S L
I M
|
ROVI
-
NASDAQ
Rovi Corp
COMPUTER SOFTWARE andamp; SERVICES - Security Software andamp; Services
|
$42.58
|
+0.59
1.41% |
$42.59
|
1,351,173
95.51% of 50 DAV
50 DAV is 1,414,700
|
$42.66
-0.19%
|
6/3/2010
|
$38.70
|
PP = $40.16
|
|
MB = $42.17
|
Most Recent Note - 7/9/2010 4:12:52 PM
G - Perched at a new 52-week high after 4 consecutive gains. Color code is changed to green after it closed above its "max buy" level.
>>> The latest Featured Stock Update with an annotated graph appeared on 6/28/2010. Click here.
View all notes |
Alert me of new notes |
CANSLIM.net Company Profile |
SEC |
Zacks Reports |
StockTalk |
News |
Chart |
Request a new note
C
A N
S L
I M
|
SUMR
-
NASDAQ
Summer Infant Inc
CONSUMER NON-DURABLES - Personal Products
|
$6.82
|
+0.10
1.49% |
$6.84
|
62,491
57.81% of 50 DAV
50 DAV is 108,100
|
$8.42
-19.00%
|
5/4/2010
|
$6.85
|
PP = $7.09
|
|
MB = $7.44
|
Most Recent Note - 7/9/2010 4:16:59 PM
G - It ended the week -19.4% off its 52 week high, and its 50 DMA line has recently acted as resistance. Based on sluggish performance it will be dropped from the Featured Stocks list tonight.
>>> The latest Featured Stock Update with an annotated graph appeared on 6/24/2010. Click here.
View all notes |
Alert me of new notes |
CANSLIM.net Company Profile |
SEC |
Zacks Reports |
StockTalk |
News |
Chart |
Request a new note
C
A N
S L
I M
|
THOR
-
NASDAQ
Thoratec Corp
HEALTH SERVICES - Medical Instruments and Supplies
|
$44.86
|
+0.12
0.27% |
$45.01
|
545,738
46.26% of 50 DAV
50 DAV is 1,179,600
|
$47.93
-6.41%
|
6/3/2010
|
$44.38
|
PP = $45.35
|
|
MB = $47.62
|
Most Recent Note - 7/9/2010 4:18:15 PM
Y - Posted a 5th consecutive gain today with below average volume. Found support near its a 50 DMA line, an important support level.
>>> The latest Featured Stock Update with an annotated graph appeared on 6/23/2010. Click here.
View all notes |
Alert me of new notes |
CANSLIM.net Company Profile |
SEC |
Zacks Reports |
StockTalk |
News |
Chart |
Request a new note
C
A N
S L
I M
|
ULTA
-
NASDAQ
Ulta Salon Cosm & Frag
SPECIALTY RETAIL - Specialty Retail, Other
|
$23.51
|
+0.54
2.35% |
$23.54
|
281,367
40.24% of 50 DAV
50 DAV is 699,200
|
$26.75
-12.11%
|
5/28/2010
|
$25.58
|
PP = $25.86
|
|
MB = $27.15
|
Most Recent Note - 7/9/2010 4:19:24 PM
G - Gain today with light volume, remaining below its 50 DMA line which may now act as resistance. Its May - June chart lows in the $21 area define the next support level just above its 200 DMA line.
>>> The latest Featured Stock Update with an annotated graph appeared on 6/25/2010. Click here.
View all notes |
Alert me of new notes |
CANSLIM.net Company Profile |
SEC |
Zacks Reports |
StockTalk |
News |
Chart |
Request a new note
C
A N
S L
I M
|
Symbol/Exchange
Company Name
Industry Group |
PRICE |
CHANGE
(%Change) |
Day High |
Volume
(% DAV)
(% 50 day avg vol) |
52 Wk Hi
% From Hi |
Featured
Date |
Price
Featured |
Pivot Featured |
|
Max Buy |
VIT
-
NYSE
Vanceinfo Tech Inc Ads
COMPUTER SOFTWARE and SERVICES - Business Software and Services
|
$25.68
|
-0.44
-1.68% |
$26.50
|
812,376
122.66% of 50 DAV
50 DAV is 662,300
|
$26.48
-3.02%
|
7/8/2010
|
$25.20
|
PP = $26.58
|
|
MB = $27.91
|
Most Recent Note - 7/9/2010 4:20:24 PM
Y - Pulled back today after, technically, it did not trigger a buy signal with respect to the pivot point cited. Gapped up on 7/08/10, briefly matched its all-time high, and appeared in the mid-day report (read here). Pivot point is based upon its 4/26/10 all-time high plus ten cents, and a powerful breakout above that level may signal the beginning of another significant advance. Volume should be +50% above average or greater to confirm any technical buy signal. This China-based Computer - Tech Services firm found impressive support near its 200 DMA line and it has rebounded toward its prior highs with gains in recent weeks that lacked great volume conviction. Another concern is that its weekly chart is marked by several down weeks with above average volume, but not a single up week marked by above average volume since April. Based on weak action it was dropped from the Featured Stocks list on 5/19/10.
>>> The latest Featured Stock Update with an annotated graph appeared on 7/8/2010. Click here.
View all notes |
Alert me of new notes |
CANSLIM.net Company Profile |
SEC |
Zacks Reports |
StockTalk |
News |
Chart |
Request a new note
C
A N
S L
I M
|
|
|
|
THESE ARE NOT BUY RECOMMENDATIONS!
Comments contained in the body of this report are technical
opinions only. The material herein has been obtained
from sources believed to be reliable and accurate, however,
its accuracy and completeness cannot be guaranteed.
This site is not an investment advisor, hence it does
not endorse or recommend any securities or other investments.
Any recommendation contained in this report may not
be suitable for all investors and it is not to be deemed
an offer or solicitation on our part with respect to
the purchase or sale of any securities. All trademarks,
service marks and trade names appearing in this report
are the property of their respective owners, and are
likewise used for identification purposes only.
This report is a service available
only to active Paid Premium Members.
You may opt-out of receiving report notifications
at any time. Questions or comments may be submitted
by writing to Premium Membership Services 665 S.E. 10 Street, Suite 201 Deerfield Beach, FL 33441-5634 or by calling 1-800-965-8307
or 954-785-1121.
|
|
|


