You are not logged in.
This means you
CAN ONLY VIEW reports that were published prior to Monday, April 14, 2025.
You
MUST UPGRADE YOUR MEMBERSHIP if you want to see any current reports.
AFTER MARKET UPDATE - THURSDAY, JULY 9TH, 2009
Previous After Market Report Next After Market Report >>>
|
|
|
|
DOW |
+4.76 |
8,183.17 |
+0.06% |
|
Volume |
1,006,090,440 |
-30% |
|
Volume |
1,928,303,920 |
-24% |
|
NASDAQ |
+5.38 |
1,752.55 |
+0.31% |
|
Advancers |
1,811 |
59% |
|
Advancers |
1,346 |
48% |
|
S&P 500 |
+3.12 |
882.68 |
+0.35% |
|
Decliners |
1,178 |
38% |
|
Decliners |
1,319 |
47% |
|
Russell 2000 |
-0.41 |
479.27 |
-0.09% |
|
52 Wk Highs |
6 |
|
|
52 Wk Highs |
11 |
|
|
S&P 600 |
+0.11 |
255.62 |
+0.04% |
|
52 Wk Lows |
11 |
|
|
52 Wk Lows |
24 |
|
|
 |
Major Averages Rise On Much Quieter Volume
Kenneth J. Gruneisen - Passed the CAN SLIM® Master's Exam
The major averages rose on Thursday, but much lighter volume totals were reported in comparison to the prior session totals on the NYSE and on the Nasdaq exchange, revealing a lack of serious buying demand from the institutional crowd. Advancers led decliners by about a 3-to-2 ratio on the NYSE while the mix was nearly even on the Nasdaq exchange. There were 6 high-ranked companies from the CANSLIM.net Leaders List that made a new 52-week high and appeared on the CANSLIM.net BreakOuts Page, up from the 2 issues that appeared on the prior session.
Oil prices fell for a 7th straight day as crude fell 22 cents to $60.36 a barrel on the New York Mercantile Exchange. A little over a week ago, crude prices stood at $73 a barrel, and falling oil prices have actually pressured markets around the world in recent days.
Thursday's light volume totals were typical of the "Summer doldrums", and trading activity ordinarily does not show any great expansion until after Labor Day. Over the next few weeks it is imperative to watch how companies performed in the latest quarter, and just as importantly or more, see how the stock prices react to the numbers. The market remains highly skeptical amid plenty of evidence, including weak retail sales and record high unemployment, which suggest that any rebound in growth could be feeble and take longer than investors originally thought.
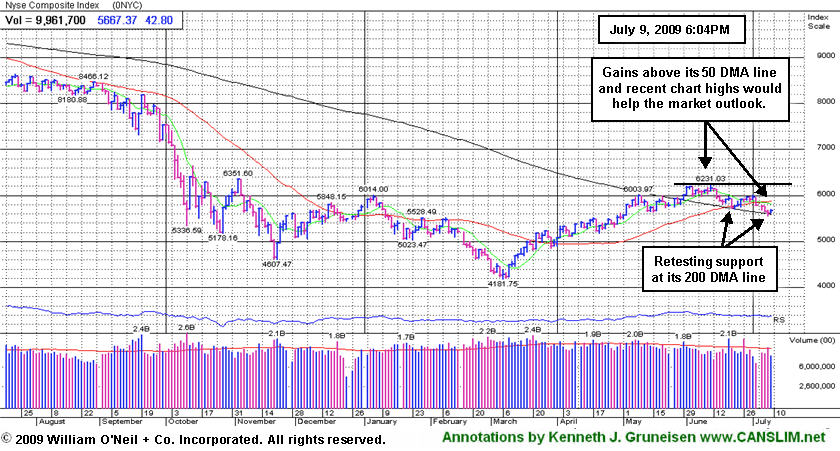
PICTURED: The NYSE Composite Index halted a 4-day slide with a small gain on lighter volume. In recent weeks it has found support at its 200-day moving average (DMA) line -which is still sinking. Technically, even though its 50 DMA line rallied above its 200 DMA line a couple of weeks ago, it now needs to reclaim its 50 DMA line and rally above its recent chart highs for the market outlook to really improve meaningfully.
|
 Kenneth J. Gruneisen started out as a licensed stockbroker in August 1987, a couple of months prior to the historic stock market crash that took the Dow Jones Industrial Average down -22.6% in a single day. He has published daily fact-based fundamental and technical analysis on high-ranked stocks online for two decades. Through FACTBASEDINVESTING.COM, Kenneth provides educational articles, news, market commentary, and other information regarding proven investment systems that work in good times and bad.
Comments contained in the body of this report are technical opinions only and are not necessarily those of Gruneisen Growth Corp. The material herein has been obtained from sources believed to be reliable and accurate, however, its accuracy and completeness cannot be guaranteed. Our firm, employees, and customers may effect transactions, including transactions contrary to any recommendation herein, or have positions in the securities mentioned herein or options with respect thereto. Any recommendation contained in this report may not be suitable for all investors and it is not to be deemed an offer or solicitation on our part with respect to the purchase or sale of any securities. |
|
 |
SOX Remains Under 50 DMA After Low-Ranked Chip Stocks Bounced
Kenneth J. Gruneisen - Passed the CAN SLIM® Master's Exam
The financial group provided a positive influence on Thursday as the Broker/Dealer ($XBD +1.64%) and Bank ($BKX +1.91%) indexes rose. The Retail Index ($RLX +0.40%) ended modestly higher despite disappointing June same-store sales reports and some negative results. The Internet ($IIX +1.15%), Networking ($NWX +0.65%) indexes outpaced the Biotechnology ($BTK +0.24%), and Healthcare ($HMO +0.04%) indexes' small gains. Commodity linked areas rose while the dollar weakened, helping the Gold & Silver ($XAU +0.77%), Integrated Oil ($XOI +1.12%), and Oil Services ($OSX +1.68%) indexes post gains.
Charts courtesy www.stockcharts.com
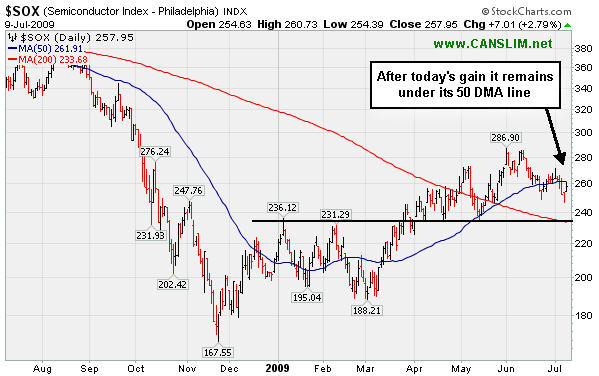
PICTURED: The Semiconductor ($SOX +2.79%) was a standout gainer, helped by big gains from Micron Technology Inc. (MU +6.78%), SanDisk Corp. (SNDK +5.18%), KLA-Tencor Corporation (KLAC +4.89%). None of those companies listed has a strong history of sales revenues and earnings growth, so they are low-ranked and they do not make good buy candidates based upon the investment system's guidelines.
| Oil Services |
$OSX |
149.82 |
+2.48 |
+1.68% |
+23.42% |
| Healthcare |
$HMO |
1,078.48 |
+0.44 |
+0.04% |
+12.32% |
| Integrated Oil |
$XOI |
865.39 |
+9.59 |
+1.12% |
-11.67% |
| Semiconductor |
$SOX |
257.95 |
+7.01 |
+2.79% |
+21.58% |
| Networking |
$NWX |
173.38 |
+1.12 |
+0.65% |
+20.49% |
| Internet |
$IIX |
178.41 |
+2.03 |
+1.15% |
+33.37% |
| Broker/Dealer |
$XBD |
93.16 |
+1.50 |
+1.64% |
+20.25% |
| Retail |
$RLX |
311.59 |
+1.25 |
+0.40% |
+11.58% |
| Gold & Silver |
$XAU |
130.29 |
+0.99 |
+0.77% |
+5.20% |
| Bank |
$BKX |
34.74 |
+0.65 |
+1.91% |
-21.62% |
| Biotech |
$BTK |
645.55 |
+1.55 |
+0.24% |
-0.25% |
|
|
|
 |
Education Group Leader Near 52-Week High
Kenneth J. Gruneisen - Passed the CAN SLIM® Master's Exam
A classic example of the success enjoyed by many CANSLIM.net readers usually starts when an investor reads a CANSLIM.net report and buys a featured stock before it has risen above the pivot point by greater than 5%. After a stock breaks out above its pivot point, there is only a +5% window that investors have to purchase the stock under the proper guidelines. Once a stock rises above the "maximum buy price" the risk of a shake out balloons, meaning that even a normal retracement in the stock might force you to employ the 7-8% loss cutting rule. Much can be told by the stock's daily action in the weeks and months that follow a breakout. Typically, a light volume and orderly pullback suggests that the bulls remain in control. However, high volume pullbacks that violate support paint a totally different picture.
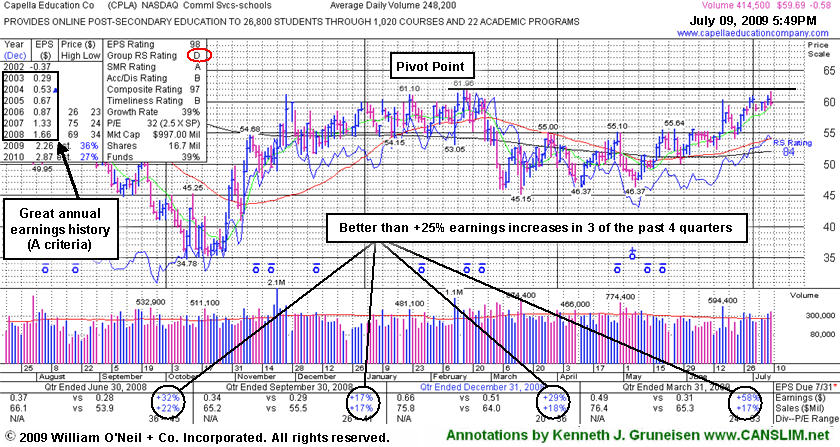
Capella Education Co. (CPLA -$0.58 or -0.96% to $59.69) negatively reversed for a loss with above average volume after it was featured in yellow in today's mid-day report (read here). It has quietly been rallying in recent weeks, and is now perched within -5% of its 52-week high. The group has shown some leadership, yet currently has a D for a Relative Strength Rating (see red circle). CPLA is a high-ranked leader in the Commercial Services-Schools Group. Its small supply of only 13.9 million shares in the float could contribute to greater price volatility in the event of institutional accumulation or distribution. The number of top-rated funds owning an interest rose from 91 in Sept '08, to 129 as of March '09, which is reassuring with respect to the I criteria. It has a very good earnings history that satisfies the C & A criteria, while recent quarters showed steady sales revenues increases in the +17-18% range.
|
|
|
Color Codes Explained :
Y - Better candidates highlighted by our
staff of experts.
G - Previously featured
in past reports as yellow but may no longer be buyable under the
guidelines.
***Last / Change / Volume quote data in this table corresponds with the timestamp on the note***
Symbol/Exchange
Company Name
Industry Group |
Last |
Chg. |
Vol
% DAV |
Date Featured |
Price Featured |
Latest Pivot Point
Featured |
Status |
| Latest Max Buy Price |
CPLA
- NASDAQ
Capella Education Co
DIVERSIFIED SERVICES - Education and Training Services
|
$59.69
|
N/A
|
N/A
N/A
|
7/9/2009
(Date
Featured) |
$59.69
(Price
Featured) |
PP = $62.06 |
Y |
| MB = $65.16 |
Most Recent Note - 7/9/2009 5:18:17 PM
Y - It negatively reversed for a loss with above average volume after it was featured in yellow in today's mid-day report (read here). Quietly rallying in recent weeks, and now perched within -5% of its 52-week high. The group has shown some leadership, yet currently has a D for a Relative Strength Rating. CPLA is a high-ranked leader in the Commercial Services-Schools Group. Its small supply of only 13.9 million shares in the float could contribute to greater price volatility in the event of institutional accumulation or distribution. The number of top-rated funds owning an interest rose from 91 in Sept '08, to 129 as of March '09, which is reassuring with respect to the I criteria. It has a very good earnings history that satisfies the C & A criteria, while recent quarters showed steady sales revenues increases in the +17-18% range.
>>> The latest Featured Stock Update with an annotated graph appeared on 7/9/2009. click here.
|
|
C
A
S
I |
News |
Chart |
SEC
View all notes Alert
me of new notes
Company
Profile
|
GMCR
- NASDAQ
Green Mtn Coffee Roastrs
FOOD & BEVERAGE - Processed & Packaged Goods
|
$56.52
|
N/A
|
N/A
N/A
|
1/1/2008
(Date
Featured) |
$27.13
(Price
Featured) |
PP = $28.66 |
G |
| MB = $30.09 |
Most Recent Note - 7/9/2009 5:19:07 PM
G - Quietly consolidating just above its 50 DMA line, important support to watch above its recent chart low ($51.65), where violations would raise concerns and trigger technical sell signals. On 6/09/09 it reached a new all-time high with a gain on light volume as a 3:2 stock split took effect. GMCR traded up more than +144% since appearing with an annotated graph under the headline "It May Soon Be Time To Go Green" when featured in the January 2009 CANSLIM.net News (read here).
>>> The latest Featured Stock Update with an annotated graph appeared on 7/6/2009. click here.
|
|
C
A
S
I |
News |
Chart |
SEC
View all notes Alert
me of new notes
Company
Profile
|
HMSY
- NASDAQ
H M S Holdings Corp
COMPUTER SOFTWARE & SERVICES - Healthcare Information Service
|
$38.72
|
N/A
|
N/A
N/A
|
2/20/2009
(Date
Featured) |
$34.08
(Price
Featured) |
PP = $38.38 |
G |
| MB = $40.30 |
Most Recent Note - 7/9/2009 5:31:39 PM
G - Lower on average volume today, closing near an upward trendline connecting its April-June lows. Prior highs near $38 are a very important initial support level above its 50 DMA line. Gap up gain on 6/16/09 with heavy volume triggered a technical buy signal. No overhead supply is left to hinder the progress for this Commercial Services - Healthcare firm.
>>> The latest Featured Stock Update with an annotated graph appeared on 6/29/2009. click here.
|
|
C
A
S
I |
News |
Chart |
SEC
View all notes Alert
me of new notes
Company
Profile
|
NTES
- NASDAQ
Netease Inc Adr
INTERNET - Internet Information Providers
|
$34.25
|
N/A
|
N/A
N/A
|
5/21/2009
(Date
Featured) |
$31.19
(Price
Featured) |
PP = $32.75 |
G |
| MB = $34.39 |
Most Recent Note - 7/9/2009 5:34:15 PM
G - Gain today on lighter volume helped it rebound to a close back above its 50 DMA line after a considerable loss on 7/08/09 with above average volume triggered a technical sell signal. Recent losses were noted as a worrisome violation of a multi-month upward trendline occurred. Prior chart highs near $32 are an important technical support level to watch now. It has negated all gains since its 5/28/09 gap up and considerable gain with +79% above average volume confirmed its last sound technical buy signal. Indications of institutional (the I criteria) buying demand have been noted after earnings news on 5/20/09 a shakeout tested support near its 50 DMA line. First featured at $26.75 in the 3/31/09 CANSLIM.net Mid-Day Breakouts Report (read here). This high-ranked Chinese Internet - Content firm was also summarized in greater detail including an annotated graph in the April 2009 issue of CANSLIM.net News (read here).
>>> The latest Featured Stock Update with an annotated graph appeared on 6/30/2009. click here.
|
|
C
A
S
I |
News |
Chart |
SEC
View all notes Alert
me of new notes
Company
Profile
|
NVEC
- NASDAQ
N V E Corp
ELECTRONICS - Semiconductor - Specialized
|
$43.09
|
N/A
|
N/A
N/A
|
3/13/2009
(Date
Featured) |
$33.85
(Price
Featured) |
PP = $45.50 |
G |
| MB = $47.78 |
Most Recent Note - 7/9/2009 5:36:27 PM
G - Small gain with light volume today halted a streak of four consecutive losses on higher volume that pressured it under its pivot point and tested its 50 DMA line and prior highs - important support to watch. Color code was changed to green based deterioration after its 6/19/09 breakout was completely negated. Sales increases in recent comparisons have been under the +25% guideline and still rather minuscule, leaving concerns, especially in the event of any hiccups. This is a reason to be especially disciplined about proper entries and exits.
>>> The latest Featured Stock Update with an annotated graph appeared on 7/8/2009. click here.
|
|
C
A
S
I |
News |
Chart |
SEC
View all notes Alert
me of new notes
Company
Profile
|
SNDA
-
|
$52.09
|
N/A
|
N/A
N/A
|
5/31/2009
(Date
Featured) |
$57.62
(Price
Featured) |
PP = $53.95 |
G |
| MB = $56.65 |
Most Recent Note - 7/9/2009 5:37:21 PM
G - Loss today on ligher volume, closing further under its 50 DMA line. Subsequent deterioration below its recent chart low near $50 would raise more serious concerns and trigger a worrisome technical sell signal. Detailed analysis was included when recently featured in the June 2009 issue of CANSLIM.net News. Be sure to review the "What to Look Out For" section and entire detailed summary - read here).
>>> The latest Featured Stock Update with an annotated graph appeared on 7/2/2009. click here.
|
|
C
A
S
I |
News |
Chart |
SEC
View all notes Alert
me of new notes
Company
Profile
|
SYNA
- NASDAQ
Synaptics Inc
COMPUTER SOFTWARE & SERVICES - Information Technology Service
|
$34.22
|
N/A
|
N/A
N/A
|
5/18/2009
(Date
Featured) |
$32.58
(Price
Featured) |
PP = $34.52 |
G |
| MB = $36.25 |
Most Recent Note - 7/9/2009 5:39:04 PM
G - Loss today was its 6th consecutive loss, and a 50 DMA line violation on 7/08/09 triggered a technical sell signal. First featured in yellow in the May 18, 2009 mid-day report (read here). The number of top-rated funds owning its shares rose from 123 in June '08 to 199 in March '09, which is good news concerning the I criteria. Its annual earnings (the A criteria) history showed a dowturn in 2006, leaving concerns, but it followed that up with strong growth the next 2 years. Its small supply of shares (the S criteria) outstanding could contribute to especially great volatility in the event of institutional accumulation or distribution.
>>> The latest Featured Stock Update with an annotated graph appeared on 6/26/2009. click here.
|
|
C
A
S
I |
News |
Chart |
SEC
View all notes Alert
me of new notes
Company
Profile
|
TNDM
- NASDAQ
Tandem Diabetes Care Inc
TELECOMMUNICATIONS - Wireless Communications
|
$27.03
|
N/A
|
N/A
N/A
|
3/2/2009
(Date
Featured) |
$18.89
(Price
Featured) |
PP = $29.85 |
G |
| MB = $31.34 |
Most Recent Note - 7/9/2009 5:41:20 PM
G - Small gain today on very light volume halted a 4 session losing streak. Its outlook becomes more questionable the longer it stays below its 50 DMA line. Its choppy chart offers no sound base per the investment system's guidelines. It traded up as much as +72.42% since first featured at $18.89 in the 3/02/09 Mid-Day BreakOuts Report (read here).
>>> The latest Featured Stock Update with an annotated graph appeared on 7/7/2009. click here.
|
|
C
A
S
I |
News |
Chart |
SEC
View all notes Alert
me of new notes
Company
Profile
|
|
|
|
THESE ARE NOT BUY RECOMMENDATIONS!
Comments contained in the body of this report are technical
opinions only. The material herein has been obtained
from sources believed to be reliable and accurate, however,
its accuracy and completeness cannot be guaranteed.
This site is not an investment advisor, hence it does
not endorse or recommend any securities or other investments.
Any recommendation contained in this report may not
be suitable for all investors and it is not to be deemed
an offer or solicitation on our part with respect to
the purchase or sale of any securities. All trademarks,
service marks and trade names appearing in this report
are the property of their respective owners, and are
likewise used for identification purposes only.
This report is a service available
only to active Paid Premium Members.
You may opt-out of receiving report notifications
at any time. Questions or comments may be submitted
by writing to Premium Membership Services 665 S.E. 10 Street, Suite 201 Deerfield Beach, FL 33441-5634 or by calling 1-800-965-8307
or 954-785-1121.
|
|
|

