You are not logged in.
This means you
CAN ONLY VIEW reports that were published prior to Monday, April 14, 2025.
You
MUST UPGRADE YOUR MEMBERSHIP if you want to see any current reports.
AFTER MARKET UPDATE - THURSDAY, JULY 8TH, 2010
Previous After Market Report Next After Market Report >>>
|
|
|
|
DOW |
+120.71 |
10,138.99 |
+1.20% |
|
Volume |
1,166,423,230 |
-13% |
|
Volume |
2,006,580,350 |
-4% |
|
NASDAQ |
+15.93 |
2,175.40 |
+0.74% |
|
Advancers |
2,313 |
74% |
|
Advancers |
1,837 |
67% |
|
S&P 500 |
+9.98 |
1,070.25 |
+0.94% |
|
Decliners |
725 |
23% |
|
Decliners |
792 |
29% |
|
Russell 2000 |
+8.61 |
620.27 |
+1.41% |
|
52 Wk Highs |
72 |
|
|
52 Wk Highs |
20 |
|
|
S&P 600 |
+4.81 |
334.01 |
+1.46% |
|
52 Wk Lows |
17 |
|
|
52 Wk Lows |
44 |
|
|
 |
Breadth Positive As Indices Rise On Lighter Volume Totals
Adam Sarhan, Contributing Writer,
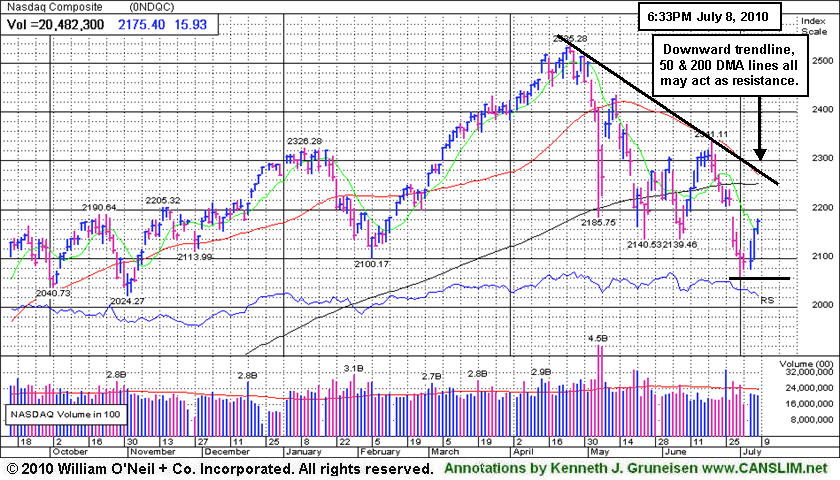
The major averages rallied one day after posting a new follow-through day (FTD). Volume, a critical component of institutional sponsorship, fell short of Wednesday's levels on the NYSE and Nasdaq exchange. There were 9 high-ranked companies from the CANSLIM.net Leaders List that made a new 52-week high and appeared on the CANSLIM.net BreakOuts Page, higher than the 7 issues that appeared on the prior session. Advancers trumped decliners by more than 3-to-1 on the NYSE and by more than 2-to-1 on the Nasdaq exchange. New 52-week highs outnumbered new 52-week lows on the NYSE but trailed on the Nasdaq exchange. It remains critically important for leadership (new highs) to expand if the new rally effort will prove to be a sustained market advance. If not, Wednesday's strong move may turn out to be the latest in a string of failed rallies confirmed with follow-through days.
There were two positive economic data points which helped send stocks higher on Thursday: jobless claims fell and same store sales rose at several key retailers. The Labor Department said initial jobless claims fell by -21,000 to 454,000 last week. This was lower than the Street's forecast for a decline to 460,000 from an initially reported 472,000 during the prior week. The report showed that the number of people receiving unemployment insurance plunged to the lowest point since 2008, while those getting emergency benefits also fell after Congress failed to pass legislation extending the assistance. Elsewhere, a flurry of high profile retailers also reported stronger than expected same store sales for June. This helped allay concern that the US consumer was spending less due to the economic uncertainty.
Looking forward, the window is now open for disciplined investors to begin carefully buying high-ranked stocks again. The major indices' 200-day moving average (DMA) lines may act as near term resistance. Remember to remain very selective because all of the major averages are still trading below their downward sloping 50 and 200 DMA lines. It was also somewhat disconcerting to see volume remain light (below average) behind the confirming gains. It is important to note that approximately 75% of FTDs lead to new sustained rallies, while 25% fail. In addition, every major rally in market history has begun with a FTD, but not every FTD leads to a new rally. Trade accordingly.
Q2 Webcast Rewind: The Q2 2010 CANSLIM.net Webcast aired at 8PM on Wednesday, June 30, 2010. A link to the webcast has been added near the top on the Premium Membership Homepage which will allow all who have UPGRADED with a currently active premium (paid) membership to view the webcast ON DEMAND at any time. To UPGRADE now for access to the webcast and all premium reports CLICK HERE.
PICTURED: The tech-heavy Nasdaq Composite Index's downward trendline, 50 & 200 DMA lines all may act as resistance.
|
|
|
 |
Energy And Medical Groups Among Day's Leading Gainers
Kenneth J. Gruneisen - Passed the CAN SLIM® Master's Exam
Energy-related shares rose and the Oil Services Index ($OSX +1.83%) and Integrated Oil Index ($XOI +1.90%) tallied large gains on Thursday. The Healthcare Index ($HMO +1.23%) and Biotechnology Index ($BTK +1.48%) each posted a decent gain, and the Internet Index ($IIX +0.78%) and Networking Index ($NWX +0.90%) were also on the rise. The Semiconductor Index ($SOX -0.07%) and Retail Index ($RLX -0.02%) basically held their ground. Financial shares showed a slightly positive bias as the Bank Index ($BKX +0.35%) and Broker/Dealer Index ($XBD +0.69%) posted small gains. Meanwhile, the Gold & Silver Index's ($XAU -1.28%) loss left "safe haven" investors among the laggards.
Charts courtesy www.stockcharts.com
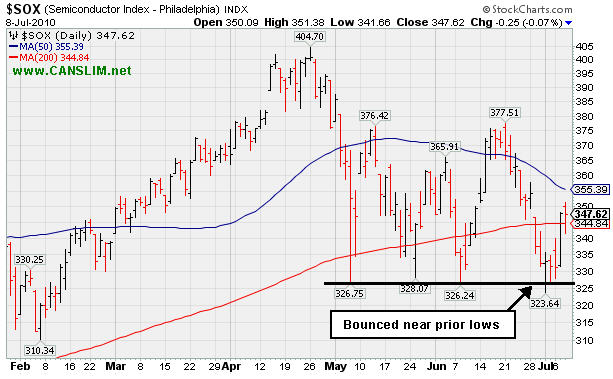
PICTURED: The Semiconductor Index ($SOX -0.07%) recently bounced near prior chart lows. Tech leadership is often a crucial part of sustained bull markets. Additional deterioration would therefore be a worrisome sign.
| Oil Services |
$OSX |
177.21 |
+3.19 |
+1.83% |
-9.09% |
| Healthcare |
$HMO |
1,413.54 |
+17.20 |
+1.23% |
-4.03% |
| Integrated Oil |
$XOI |
941.03 |
+17.59 |
+1.90% |
-11.91% |
| Semiconductor |
$SOX |
347.62 |
-0.25 |
-0.07% |
-3.41% |
| Networking |
$NWX |
227.37 |
+2.03 |
+0.90% |
-1.60% |
| Internet |
$IIX |
230.74 |
+1.79 |
+0.78% |
-1.33% |
| Broker/Dealer |
$XBD |
99.45 |
+0.69 |
+0.69% |
-13.56% |
| Retail |
$RLX |
392.97 |
-0.08 |
-0.02% |
-4.41% |
| Gold & Silver |
$XAU |
170.88 |
-2.21 |
-1.28% |
+1.56% |
| Bank |
$BKX |
48.24 |
+0.17 |
+0.35% |
+12.95% |
| Biotech |
$BTK |
1,019.91 |
+14.83 |
+1.48% |
+8.26% |
|
|
|
 |
Gap Up Gain Worth Noting As Sign Of Accumulation
Kenneth J. Gruneisen - Passed the CAN SLIM® Master's Exam
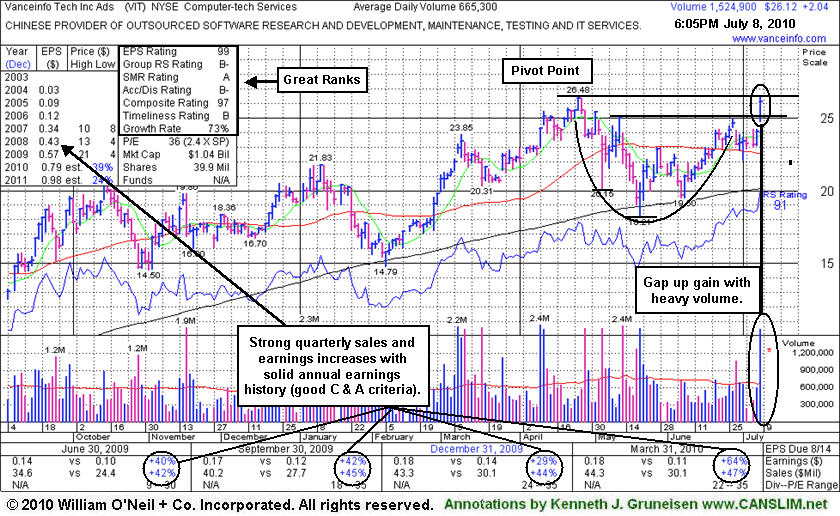
Considerable price gaps with heavy volume are often reliable indications of institutional activity. The I criteria is a very important part of the fact-based investment system, and gaps can be very crucial indicators. Keep in mind that if a stock is going to rally substantially it will often be showing multiple signs in its price/volume chart that it is under accumulation from the institutional crowd. That is why a big gap up gain on heavy volume is worth noting.
Vanceinfo Tech Inc Ads (VIT +$2.04 or +8.47% to $26.12) gapped up today and briefly matched its all-time high, and its color code was changed to yellow while it was noted when meeting the mid-day report screen parameters (read here). It also drew some headlines and mention in the newspaper. Some may consider it a "cup-with-handle" or a "double bottom" pattern with a sightly lower pivot point, however the new pivot point now being cited is based upon its 4/26/10 all-time high (which it matched earlier today to the penny) plus ten cents. A powerful breakout to a new high would be a very reassuring technical buy signal, meanwhile one may consider it a high-ranked leader that is currently challenging a previous resistance level where heavy distributional pressure was encountered not long ago. Volume should be +50% above average or greater with a gain above its pivot point to confirm any technical buy signal.
This China-based Computer - Tech Services firm found impressive support near its 200 DMA line and it has rebounded toward its prior highs with gains in recent weeks that lacked great volume conviction. Another concern is that its weekly chart is marked by several down weeks with above average volume, but not a single up week marked by above average volume since April. Based on weak action it was dropped from the Featured Stocks list on 5/19/10.
 |
|
|
Color Codes Explained :
Y - Better candidates highlighted by our
staff of experts.
G - Previously featured
in past reports as yellow but may no longer be buyable under the
guidelines.
***Last / Change / Volume data in this table is the closing quote data***
Symbol/Exchange
Company Name
Industry Group |
PRICE |
CHANGE
(%Change) |
Day High |
Volume
(% DAV)
(% 50 day avg vol) |
52 Wk Hi
% From Hi |
Featured
Date |
Price
Featured |
Pivot Featured |
|
Max Buy |
AAPL
-
NASDAQ
Apple Inc
COMPUTER HARDWARE - Personal Computers
|
$258.09
|
-0.58
-0.22% |
$262.90
|
26,327,972
91.88% of 50 DAV
50 DAV is 28,656,000
|
$279.01
-7.50%
|
6/17/2010
|
$270.95
|
PP = $272.56
|
|
MB = $286.19
|
Most Recent Note - 7/7/2010 6:58:41 PM
G - Gain with below average volume today helped it rebound above its 50 DMA line. It struggled in a challenging market (M criteria) environment since featured in the 6/17/10 mid-day report (read here).
>>> The latest Featured Stock Update with an annotated graph appeared on 6/17/2010. Click here.
View all notes |
Alert me of new notes |
CANSLIM.net Company Profile |
SEC |
Zacks Reports |
StockTalk |
News |
Chart |
Request a new note
C
A N
S L
I M


|
ABV
-
NYSE
Comp De Bebidas Adr
FOOD and BEVERAGE - Beverages - Brewers
|
$105.57
|
+0.41
0.39% |
$105.97
|
731,649
98.53% of 50 DAV
50 DAV is 742,600
|
$109.33
-3.44%
|
6/29/2010
|
$104.74
|
PP = $109.33
|
|
MB = $114.80
|
Most Recent Note - 7/7/2010 7:02:22 PM
Y - Brazil-based beverage firm found support near its 50 DMA line last week. Today's gain helped it rebound and close above the price when first featured in yellow in the 6/29/10 mid-day report (read here) with a note while - "perched near all-time highs after building an orderly base pattern and finding impressive support near its 200 DMA line in recent months. It has a great annual earnings (A criteria) history and its recent quarterly earnings and sales revenues increases have shown acceleration. A gain above its pivot point with heavy volume still needed to confirm a proper new technical buy signal."
>>> The latest Featured Stock Update with an annotated graph appeared on 6/29/2010. Click here.
View all notes |
Alert me of new notes |
CANSLIM.net Company Profile |
SEC |
Zacks Reports |
StockTalk |
News |
Chart |
Request a new note
C
A N
S L
I M
|
APEI
-
NASDAQ
American Public Educ Inc
DIVERSIFIED SERVICES - Education and Training Services
|
$43.24
|
+0.26
0.60% |
$43.29
|
116,266
65.99% of 50 DAV
50 DAV is 176,200
|
$48.95
-11.66%
|
6/7/2010
|
$46.60
|
PP = $46.29
|
|
MB = $48.60
|
Most Recent Note - 7/7/2010 7:04:49 PM
G - Gain today with above average volume helped it rally toward its 50 DMA line, breaking a streak of 7 consecutive losses.
>>> The latest Featured Stock Update with an annotated graph appeared on 7/2/2010. Click here.
View all notes |
Alert me of new notes |
CANSLIM.net Company Profile |
SEC |
Zacks Reports |
StockTalk |
News |
Chart |
Request a new note
C
A N
S L
I M
|
BIDU
-
NASDAQ
Baidu Inc Ads
INTERNET - Internet Information Providers
|
$72.43
|
+0.06
0.08% |
$73.75
|
11,394,395
75.64% of 50 DAV
50 DAV is 15,063,900
|
$82.29
-11.98%
|
1/13/2010
|
$43.13
|
PP = $42.68
|
|
MB = $44.81
|
Most Recent Note - 7/7/2010 7:07:17 PM
G - Considerable gain today with below average volume for a close back above its 50 DMA line (now at $71.32) for the first time since its damaging 6/29/10 gap down. Prior chart lows in the $66 area define important chart support.
>>> The latest Featured Stock Update with an annotated graph appeared on 6/21/2010. Click here.
View all notes |
Alert me of new notes |
CANSLIM.net Company Profile |
SEC |
Zacks Reports |
StockTalk |
News |
Chart |
Request a new note
C
A N
S L
I M
|
CISG
-
NASDAQ
Cninsure Inc Ads
INSURANCE - Insurance Brokers
|
$25.55
|
-1.80
-6.58% |
$26.36
|
595,181
190.21% of 50 DAV
50 DAV is 312,900
|
$28.62
-10.73%
|
6/16/2010
|
$27.20
|
PP = $27.75
|
|
MB = $29.14
|
 Most Recent Note - 7/8/2010 1:28:25 PM
G - In response to news it has plans for a new Stock Offering it gapped down today and violated its 50 DMA line, raising concerns. Color code is changed to green based on the weak technical action and news immediately impacting fundamentals. Featured in the 6/16/10 mid-day report (read here).
>>> The latest Featured Stock Update with an annotated graph appeared on 6/18/2010. Click here.
View all notes |
Alert me of new notes |
CANSLIM.net Company Profile |
SEC |
Zacks Reports |
StockTalk |
News |
Chart |
Request a new note
C
A N
S L
I M
|
Symbol/Exchange
Company Name
Industry Group |
PRICE |
CHANGE
(%Change) |
Day High |
Volume
(% DAV)
(% 50 day avg vol) |
52 Wk Hi
% From Hi |
Featured
Date |
Price
Featured |
Pivot Featured |
|
Max Buy |
CRM
-
NYSE
Salesforce.Com Inc
INTERNET - Internet Software and Services
|
$91.57
|
+0.19
0.21% |
$93.08
|
1,977,667
68.20% of 50 DAV
50 DAV is 2,899,900
|
$97.94
-6.50%
|
6/2/2010
|
$88.44
|
PP = $89.60
|
|
MB = $94.08
|
Most Recent Note - 7/7/2010 7:25:12 PM
Y - Rising further above its 50 DMA line, today it closed near the session high with its 5th consecutive gain. Color code is changed to yellow based on its recent resilience. An upward trendline connecting its February - May lows now defines an important support level.
>>> The latest Featured Stock Update with an annotated graph appeared on 6/22/2010. Click here.
View all notes |
Alert me of new notes |
CANSLIM.net Company Profile |
SEC |
Zacks Reports |
StockTalk |
News |
Chart |
Request a new note
C
A N
S L
I M
|
CVLT
-
NASDAQ
Commvault Systems Inc
COMPUTER SOFTWARE and SERVICES - Business Software and Services
|
$23.09
|
+0.22
0.96% |
$23.18
|
494,096
85.80% of 50 DAV
50 DAV is 575,900
|
$24.51
-5.79%
|
7/6/2010
|
$23.16
|
PP = $24.45
|
|
MB = $25.67
|
Most Recent Note - 7/7/2010 7:30:44 PM
Y - Posted a solid gain with well above average volume in 3 of the past 4 sessions. Building on the right side of a 6-month flat base within close striking distance of its 52-week high and all-time high, it was featured in the 7/06/10 mid-day report (read here). Color code was changed to yellow with its pivot point based on its 5/18/10 high plus ten cents. Its annual earnings (A criteria) history includes a slight downward turn in FY '09, yet it has an impressive history and recent quarters showed accelerating sales revenues and earnings increases with +25% earnings increases or greater in 3 out of the past 4 comparisons versus the year ago period. On 1/31/07 it was removed from the CANSLIM.net Featured Stocks list.
>>> The latest Featured Stock Update with an annotated graph appeared on 7/6/2010. Click here.
View all notes |
Alert me of new notes |
CANSLIM.net Company Profile |
SEC |
Zacks Reports |
StockTalk |
News |
Chart |
Request a new note
C
A N
S L
I M
|
DECK
-
NASDAQ
Deckers Outdoor Corp
CONSUMER NON-DURABLES - Textile - Apparel Footwear
|
$47.00
|
+0.28
0.60% |
$48.17
|
852,275
54.57% of 50 DAV
50 DAV is 1,561,800
|
$56.12
-16.25%
|
6/11/2010
|
$157.34
|
PP = $158.57
|
|
MB = $166.50
|
Most Recent Note - 7/7/2010 7:37:01 PM
G - Gain today ended a streak of 6 consecutive losses. It remains below its 50 DMA line which may now act as resistance. Do not be confused, as the most recent Featured Price, Pivot Point and Max Buy levels have been adjusted to account for a stock split 3:1 effective as of 7/06/10.
>>> The latest Featured Stock Update with an annotated graph appeared on 7/1/2010. Click here.
View all notes |
Alert me of new notes |
CANSLIM.net Company Profile |
SEC |
Zacks Reports |
StockTalk |
News |
Chart |
Request a new note
C
A N
S L
I M
|
FFIV
-
NASDAQ
F 5 Networks Inc
INTERNET - Internet Software and Services
|
$75.53
|
+0.41
0.55% |
$76.16
|
1,768,654
105.98% of 50 DAV
50 DAV is 1,668,900
|
$77.10
-2.04%
|
6/16/2010
|
$74.50
|
PP = $74.10
|
|
MB = $77.81
|
Most Recent Note - 7/7/2010 7:42:43 PM
Y - Considerable gain today with +28% above average volume helped it rally above its previously cited pivot point for a new high close. Its color code was changed to yellow based on its recent resilience. Recent chart low ($66.79 on 7/01/10) now defines a near-term support level to watch.
>>> The latest Featured Stock Update with an annotated graph appeared on 7/7/2010. Click here.
View all notes |
Alert me of new notes |
CANSLIM.net Company Profile |
SEC |
Zacks Reports |
StockTalk |
News |
Chart |
Request a new note
C
A N
S L
I M
|
MELI
-
NASDAQ
Mercadolibre Inc
INTERNET - Internet Software and; Services
|
$57.79
|
+2.37
4.28% |
$58.27
|
1,345,764
147.51% of 50 DAV
50 DAV is 912,300
|
$62.14
-7.00%
|
5/13/2010
|
$54.21
|
PP = $55.85
|
|
MB = $58.64
|
Most Recent Note - 7/8/2010 5:48:20 PM
Y - Gapped up today and posted a solid gain with above average volume, rallying for a 3rd day in a row after finding support near its 50 DMA line. Color code is changed to yellow based on its recent resilience. Its recent low ($49.55 on 7/01/10) now defines near-term chart support.
>>> The latest Featured Stock Update with an annotated graph appeared on 6/30/2010. Click here.
View all notes |
Alert me of new notes |
CANSLIM.net Company Profile |
SEC |
Zacks Reports |
StockTalk |
News |
Chart |
Request a new note
C
A N
S L
I M
|
Symbol/Exchange
Company Name
Industry Group |
PRICE |
CHANGE
(%Change) |
Day High |
Volume
(% DAV)
(% 50 day avg vol) |
52 Wk Hi
% From Hi |
Featured
Date |
Price
Featured |
Pivot Featured |
|
Max Buy |
NEM
-
NYSE
Newmont Mining Corp
METALS and MINING - Gold
|
$60.34
|
+0.35
0.58% |
$60.48
|
8,243,320
80.94% of 50 DAV
50 DAV is 10,185,100
|
$62.62
-3.64%
|
6/22/2010
|
$59.60
|
PP = $59.67
|
|
MB = $62.65
|
Most Recent Note - 7/7/2010 7:55:32 PM
Y - Gain today with below average volume helped it rebound and close above its pivot point, ending a streak of 3 consecutive losses. Featured in a 6/22/10 Stock Bulletin with annotated graph (read here).
>>> The latest Featured Stock Update with an annotated graph appeared on 6/22/2010. Click here.
View all notes |
Alert me of new notes |
CANSLIM.net Company Profile |
SEC |
Zacks Reports |
StockTalk |
News |
Chart |
Request a new note
C
A N
S L
I M
|
ROVI
-
NASDAQ
Rovi Corp
COMPUTER SOFTWARE andamp; SERVICES - Security Software andamp; Services
|
$41.99
|
+0.68
1.65% |
$42.66
|
2,069,380
146.28% of 50 DAV
50 DAV is 1,414,700
|
$41.50
1.18%
|
6/3/2010
|
$38.70
|
PP = $40.16
|
|
MB = $42.17
|
Most Recent Note - 7/8/2010 12:50:54 PM
Y - Hit another new 52-week high today with its 3rd consecutive gain backed by above average volume. A solid gain above its pivot point backed by +67% above average volume triggered a new technical buy signal on 7/07/10, and no overhead supply remains to act as resistance.
>>> The latest Featured Stock Update with an annotated graph appeared on 6/28/2010. Click here.
View all notes |
Alert me of new notes |
CANSLIM.net Company Profile |
SEC |
Zacks Reports |
StockTalk |
News |
Chart |
Request a new note
C
A N
S L
I M
|
SUMR
-
NASDAQ
Summer Infant Inc
CONSUMER NON-DURABLES - Personal Products
|
$6.72
|
+0.08
1.20% |
$6.94
|
82,688
76.49% of 50 DAV
50 DAV is 108,100
|
$8.42
-20.19%
|
5/4/2010
|
$6.85
|
PP = $7.09
|
|
MB = $7.44
|
Most Recent Note - 7/7/2010 8:03:47 PM
G - Its 50 DMA line has recently acted as resistance. Gains above it and recent chart highs near $7.40 would be an encouraging technical improvement. Meanwhile, prior chart lows in the $6.25 area define important support to watch.
>>> The latest Featured Stock Update with an annotated graph appeared on 6/24/2010. Click here.
View all notes |
Alert me of new notes |
CANSLIM.net Company Profile |
SEC |
Zacks Reports |
StockTalk |
News |
Chart |
Request a new note
C
A N
S L
I M
|
THOR
-
NASDAQ
Thoratec Corp
HEALTH SERVICES - Medical Instruments and Supplies
|
$44.74
|
+0.28
0.63% |
$45.20
|
511,055
43.32% of 50 DAV
50 DAV is 1,179,600
|
$47.93
-6.66%
|
6/3/2010
|
$44.38
|
PP = $45.35
|
|
MB = $47.62
|
Most Recent Note - 7/7/2010 8:05:16 PM
Y - Found support near its a 50 DMA line, an important support level. Color code is changed to yellow based on its resilience
>>> The latest Featured Stock Update with an annotated graph appeared on 6/23/2010. Click here.
View all notes |
Alert me of new notes |
CANSLIM.net Company Profile |
SEC |
Zacks Reports |
StockTalk |
News |
Chart |
Request a new note
C
A N
S L
I M
|
ULTA
-
NASDAQ
Ulta Salon Cosm & Frag
SPECIALTY RETAIL - Specialty Retail, Other
|
$22.97
|
-0.38
-1.63% |
$23.73
|
538,984
77.09% of 50 DAV
50 DAV is 699,200
|
$26.75
-14.13%
|
5/28/2010
|
$25.58
|
PP = $25.86
|
|
MB = $27.15
|
Most Recent Note - 7/7/2010 3:15:41 PM
G - Gain today has it rallying back toward its 50 DMA line which may now act as resistance. Its May - June chart lows in the $21 area define the next support level just above its 200 DMA line.
>>> The latest Featured Stock Update with an annotated graph appeared on 6/25/2010. Click here.
View all notes |
Alert me of new notes |
CANSLIM.net Company Profile |
SEC |
Zacks Reports |
StockTalk |
News |
Chart |
Request a new note
C
A N
S L
I M
|
Symbol/Exchange
Company Name
Industry Group |
PRICE |
CHANGE
(%Change) |
Day High |
Volume
(% DAV)
(% 50 day avg vol) |
52 Wk Hi
% From Hi |
Featured
Date |
Price
Featured |
Pivot Featured |
|
Max Buy |
VIT
-
NYSE
Vanceinfo Tech Inc Ads
COMPUTER SOFTWARE and SERVICES - Business Software and Services
|
$26.12
|
+2.04
8.47% |
$26.48
|
1,532,126
231.33% of 50 DAV
50 DAV is 662,300
|
$26.48
-1.36%
|
7/8/2010
|
$25.20
|
PP = $26.58
|
|
MB = $27.91
|
Most Recent Note - 7/8/2010 6:01:30 PM
Y - Gapped up today and briefly matched its all-time high, and its color code was changed to yellow while it was noted when meeting the mid-day report screen parameters (read here). Some may consider it a cup-with-handle or a double bottom pattern with a sightly lower pivot point, however the new pivot point now being cited is based upon its 4/26/10 all-time high (which it matched earlier) plus ten cents. Volume should be +50% above average or greater to confirm any technical buy signal. This China-based Computer - Tech Services firm found impressive support near its 200 DMA line and it has rebounded toward its prior highs with gains in recent weeks that lacked great volume conviction. Another concern is that its weekly chart is marked by several down weeks with above average volume, but not a single up week marked by above average volume since April. Based on weak action it was dropped from the Featured Stocks list on 5/19/10.
>>> The latest Featured Stock Update with an annotated graph appeared on 7/8/2010. Click here.
View all notes |
Alert me of new notes |
CANSLIM.net Company Profile |
SEC |
Zacks Reports |
StockTalk |
News |
Chart |
Request a new note
C
A N
S L
I M
|
|
|
|
THESE ARE NOT BUY RECOMMENDATIONS!
Comments contained in the body of this report are technical
opinions only. The material herein has been obtained
from sources believed to be reliable and accurate, however,
its accuracy and completeness cannot be guaranteed.
This site is not an investment advisor, hence it does
not endorse or recommend any securities or other investments.
Any recommendation contained in this report may not
be suitable for all investors and it is not to be deemed
an offer or solicitation on our part with respect to
the purchase or sale of any securities. All trademarks,
service marks and trade names appearing in this report
are the property of their respective owners, and are
likewise used for identification purposes only.
This report is a service available
only to active Paid Premium Members.
You may opt-out of receiving report notifications
at any time. Questions or comments may be submitted
by writing to Premium Membership Services 665 S.E. 10 Street, Suite 201 Deerfield Beach, FL 33441-5634 or by calling 1-800-965-8307
or 954-785-1121.
|
|
|


