You are not logged in.
This means you
CAN ONLY VIEW reports that were published prior to Monday, April 14, 2025.
You
MUST UPGRADE YOUR MEMBERSHIP if you want to see any current reports.
AFTER MARKET UPDATE - WEDNESDAY, JULY 8TH, 2009
Previous After Market Report Next After Market Report >>>
|
|
|
|
DOW |
+14.81 |
8,178.41 |
+0.18% |
|
Volume |
1,438,139,970 |
+30% |
|
Volume |
2,549,642,360 |
+21% |
|
NASDAQ |
+1.00 |
1,747.17 |
+0.06% |
|
Advancers |
1,020 |
33% |
|
Advancers |
888 |
32% |
|
S&P 500 |
-1.47 |
879.56 |
-0.17% |
|
Decliners |
1,974 |
64% |
|
Decliners |
1,802 |
64% |
|
Russell 2000 |
-4.57 |
479.68 |
-0.94% |
|
52 Wk Highs |
3 |
|
|
52 Wk Highs |
8 |
|
|
S&P 600 |
-1.73 |
255.51 |
-0.67% |
|
52 Wk Lows |
8 |
|
|
52 Wk Lows |
36 |
|
|
 |
IMF Report Casts Doubt on Recovery in Second Half of 2009
Adam Sarhan, Contributing Writer,
The major averages ended mixed as investors began accepting the notion that the economy will not expand sharply in the latter half of 2009. Volume totals were reported higher than the prior session totals on the NYSE and on the Nasdaq exchange. Decliners trumped advancers by about a 2-to-1 ratio on the NYSE and on the Nasdaq exchange. There were only 2 high-ranked companies from the CANSLIM.net Leaders List that made a new 52-week high and appeared on the CANSLIM.net BreakOuts Page, less than the 4 issues that appeared on the prior session.
The market averages treaded water for most of the day as investors digested the latest economic report from the International Monetary Fund (IMF). The IMF released a report that said the global economic outlook for the latter half of 2009 will be lackluster at best. The IMF believes that the global economy will not begin to recover until 2010, which is past the Street's consensus. This sent the US dollar higher and a slew of commodities (and equities) lower. Over the past few months, we have discussed this delicate relationship between the US dollar and other asset classes (mainly stocks and commodities). At this point, the one clear trend is that the US dollar is inversely related to both stocks and commodities. So carefully following the greenback is important as the world gets smaller. Another tumble in oil prices dragged energy shares lower and reflected concerns that demand for energy would remain weak as the economy struggles to emerge from a recession that began nearly two years ago.
Fundamentally, the primary argument that propelled stocks higher from the March lows was the notion that the economy was turning around and that a strong rebound would occur in the latter half of 2009. That notion negated, it will be very interesting to see what catalyst the bulls can use to send stocks higher.
That brings us to second quarter results, which many economists believe will be weak. After Wednesday's bell, Alcoa Inc. (AA +0.53%) was the first Dow component to report their second quarter results. The aluminum giant reported a third straight quarterly loss, yet it topped the Street's average forecast. Over the next few weeks it is imperative to watch how companies performed in the latest quarter, and just as importantly or more, see how the stock prices react to the numbers.
PICTURED: The S&P 500 Index closed below its 200-day moving average (DMA) line for the second session, ending down on lighter than average volume again.
|
|
|
 |
Recent Weakness Hurts Outlook, Yet Retail Index Bucked Negative Action Today
Kenneth J. Gruneisen - Passed the CAN SLIM® Master's Exam
Typically good defensive areas were the worst laggards on Wednesday as the Gold & Silver Index ($XAU -3.15%) and the Healthcare ($HMO -2.76%) group suffered large losses. Financial shares also had a negative influence on the major averages as the Bank ($BKX -2.07%) and Broker/Dealer ($XBD -1.41%) indexes sank. The Networking Index ($NWX -1.43%) led the tech sector lower while the Semiconductor ($SOX -0.71%), Biotechnology ($BTK -0.33%), and Internet ($IIX -0.27%) indexes ended with smaller losses. The Oil Services Index ($OSX +1.17%) was one of the standout gainers, however the Integrated Oil Index ($XOI -0.38%) ended lower on the session.
Charts courtesy www.stockcharts.com
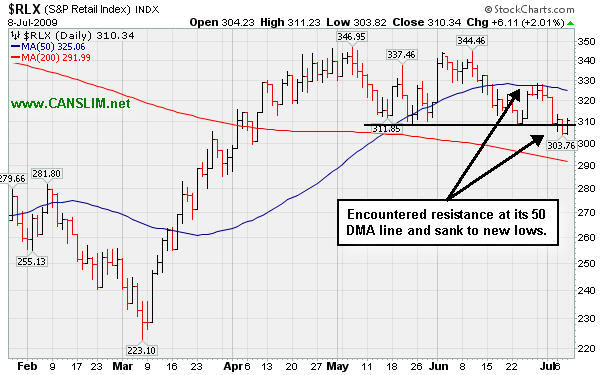
PICTURED: The Retail Index ($RLX +2.01%) bucked the mostly negative action in the broader market and posted a gain. It recently encountered resistance at its 50-day moving average line and slumped under its May-June chart lows. The weak action generally bodes poorly for retail issues, however each individual issue should be judged based upon its own merit.
| Oil Services |
$OSX |
147.34 |
+1.70 |
+1.17% |
+21.38% |
| Healthcare |
$HMO |
1,078.04 |
-30.61 |
-2.76% |
+12.27% |
| Integrated Oil |
$XOI |
855.80 |
-3.26 |
-0.38% |
-12.64% |
| Semiconductor |
$SOX |
250.94 |
-1.79 |
-0.71% |
+18.27% |
| Networking |
$NWX |
172.26 |
-2.50 |
-1.43% |
+19.72% |
| Internet |
$IIX |
176.37 |
-0.47 |
-0.27% |
+31.85% |
| Broker/Dealer |
$XBD |
91.66 |
-1.31 |
-1.41% |
+18.32% |
| Retail |
$RLX |
310.34 |
+6.11 |
+2.01% |
+11.13% |
| Gold & Silver |
$XAU |
129.30 |
-4.21 |
-3.15% |
+4.40% |
| Bank |
$BKX |
34.09 |
-0.72 |
-2.07% |
-23.08% |
| Biotech |
$BTK |
644.02 |
-2.11 |
-0.33% |
-0.49% |
|
|
|
 |
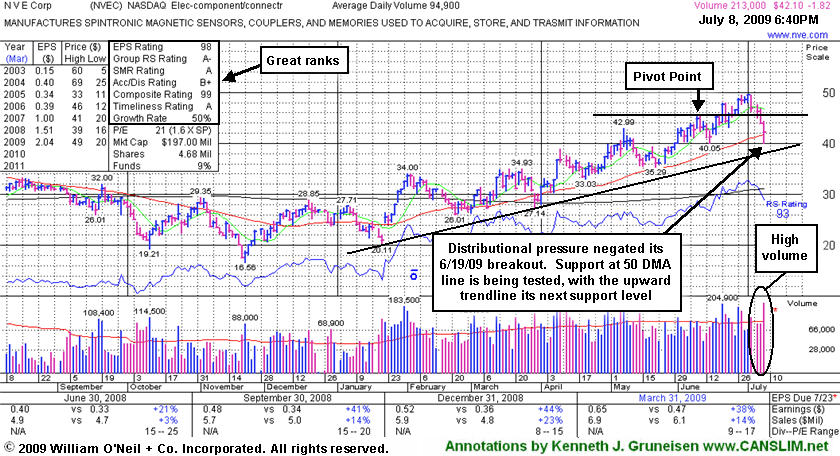
Distributional Pressure Leaves Stock Near Important Support
Kenneth J. Gruneisen - Passed the CAN SLIM® Master's Exam
NVE Corp (NVEC -$1.82 or -4.14% to $42.10) suffered a large loss today with above average volume, indicating distributional pressure as its fourth consecutive loss pressured it under its pivot point. It is testing its 50-day moving average (DMA) line, an important area to watch above a multi-month upward trendline that is the next important support level. Its color code was changed to green based deterioration, as its latest breakout has been completely negated. Its 6/19/09 gain with volume more than 2 times average had helped it rise from an "ascending base" type pattern to a new 52-week high and multi-year high, triggering its latest technical buy signal. It has a very small supply of only 4.67 million shares outstanding. A small supply is generally considered a good sign with respect to the S criteria, yet could contribute to great volatility in the event of institutional accumulation or distribution. NVEC has traded up as much as +41.51% since it was first featured in yellow at $33.85 in the Friday, March 13, 2009 Mid-Day Breakouts Report (read here).
Earnings per share rose +38% in the period ended March 31, 2009 versus the year ago quarter, yet sales were up just +14% and, as previously noted, the company's sales revenues thus far have been rather minuscule. At less than $7 million per quarter in each of the past 8 quarters, sales have growing at a mostly lackluster pace percentage-wise. Companies reporting more substantial sales revenues generally make more reliable buy candidates, while companies with little "meat on the bone" can be particularly vulnerable to bad stumbles, fundamentally and technically. Nonetheless, this high-ranked Electronics - Components leader has a good quarterly and annual earnings growth history (C & A criteria).
|
|
|
Color Codes Explained :
Y - Better candidates highlighted by our
staff of experts.
G - Previously featured
in past reports as yellow but may no longer be buyable under the
guidelines.
***Last / Change / Volume quote data in this table corresponds with the timestamp on the note***
Symbol/Exchange
Company Name
Industry Group |
Last |
Chg. |
Vol
% DAV |
Date Featured |
Price Featured |
Latest Pivot Point
Featured |
Status |
| Latest Max Buy Price |
GMCR
- NASDAQ
Green Mtn Coffee Roastrs
FOOD & BEVERAGE - Processed & Packaged Goods
|
$55.64
|
N/A
|
N/A
N/A
|
1/1/2008
(Date
Featured) |
$27.13
(Price
Featured) |
PP = $28.66 |
G |
| MB = $30.09 |
Most Recent Note - 7/8/2009 6:29:30 PM
G - Quietly consolidating near its 50 DMA line, important support to watch above its recent chart low ($51.65), where violations would raise concerns and trigger technical sell signals. On 6/09/09 it reached a new all-time high with a gain on light volume as a 3:2 stock split took effect. GMCR traded up more than +144% since appearing with an annotated graph under the headline "It May Soon Be Time To Go Green" when featured in the January 2009 CANSLIM.net News (read here).
>>> The latest Featured Stock Update with an annotated graph appeared on 7/6/2009. click here.
|
|
C
A
S
I |
News |
Chart |
SEC
View all notes Alert
me of new notes
Company
Profile
|
HMSY
- NASDAQ
H M S Holdings Corp
COMPUTER SOFTWARE & SERVICES - Healthcare Information Service
|
$40.45
|
N/A
|
N/A
N/A
|
2/20/2009
(Date
Featured) |
$34.08
(Price
Featured) |
PP = $38.38 |
G |
| MB = $40.30 |
Most Recent Note - 7/7/2009 7:15:47 PM
G - Quietly consolidating near all-time highs. Prior chart highs and an upward trendline connecting its April-June lows come into play near $38, making that a very important initial support level above its 50 DMA line to watch. Gap up gain on 6/16/09 with heavy volume triggered a technical buy signal. No overhead supply is left to hinder the progress for this Commercial Services - Healthcare firm.
>>> The latest Featured Stock Update with an annotated graph appeared on 6/29/2009. click here.
|
|
C
A
S
I |
News |
Chart |
SEC
View all notes Alert
me of new notes
Company
Profile
|
NTES
- NASDAQ
Netease Inc Adr
INTERNET - Internet Information Providers
|
$32.62
|
N/A
|
N/A
N/A
|
5/21/2009
(Date
Featured) |
$31.19
(Price
Featured) |
PP = $32.75 |
G |
| MB = $34.39 |
Most Recent Note - 7/8/2009 6:39:06 PM
G - Violated its 50 DMA line today with a considerable loss on above average volume, triggering a technical sell signal. Recent losses were noted as a worrisome violation of a multi-month upward trendline occurred. Trading near prior chart highs in the $32 area - an important technical support level to watch now. It has negated all gains since its 5/28/09 gap up and considerable gain with +79% above average volume confirmed its last sound technical buy signal. Indications of institutional (the I criteria) buying demand have been noted after earnings news on 5/20/09 a shakeout tested support near its 50 DMA line. First featured at $26.75 in the 3/31/09 CANSLIM.net Mid-Day Breakouts Report (read here). This high-ranked Chinese Internet - Content firm was also summarized in greater detail including an annotated graph in the April 2009 issue of CANSLIM.net News (read here).
>>> The latest Featured Stock Update with an annotated graph appeared on 6/30/2009. click here.
|
|
C
A
S
I |
News |
Chart |
SEC
View all notes Alert
me of new notes
Company
Profile
|
NVEC
- NASDAQ
N V E Corp
ELECTRONICS - Semiconductor - Specialized
|
$42.10
|
N/A
|
N/A
N/A
|
3/13/2009
(Date
Featured) |
$33.85
(Price
Featured) |
PP = $45.50 |
G |
| MB = $47.78 |
Most Recent Note - 7/8/2009 7:00:27 PM
G - Loss today with above average volume indicated distributional pressure as its fourth consecutive loss pressured it under its pivot point. Testing its 50 DMA line and prior highs - important support to watch. Color code is changed to green based deterioration, as its 6/19/09 breakout has been completely negated. Sales increases in recent comparisons have been under the +25% guideline and still rather minuscule, leaving concerns, especially in the event of any hiccups. This is a reason to be especially disciplined about proper entries and exits.
>>> The latest Featured Stock Update with an annotated graph appeared on 7/8/2009. click here.
|
|
C
A
S
I |
News |
Chart |
SEC
View all notes Alert
me of new notes
Company
Profile
|
SNDA
-
|
$53.25
|
N/A
|
N/A
N/A
|
5/31/2009
(Date
Featured) |
$57.62
(Price
Featured) |
PP = $53.95 |
G |
| MB = $56.65 |
Most Recent Note - 7/8/2009 7:06:51 PM
G - Loss today on above average volume, closing under its 50 DMA line. Subsequent deterioration below its recent chart low near $50 would raise more serious concerns and trigger a worrisome technical sell signal. Detailed analysis was included when recently featured in the June 2009 issue of CANSLIM.net News. Be sure to review the "What to Look Out For" section and entire detailed summary - read here).
>>> The latest Featured Stock Update with an annotated graph appeared on 7/2/2009. click here.
|
|
C
A
S
I |
News |
Chart |
SEC
View all notes Alert
me of new notes
Company
Profile
|
SYNA
- NASDAQ
Synaptics Inc
COMPUTER SOFTWARE & SERVICES - Information Technology Service
|
$34.40
|
N/A
|
N/A
N/A
|
5/18/2009
(Date
Featured) |
$32.58
(Price
Featured) |
PP = $34.52 |
G |
| MB = $36.25 |
Most Recent Note - 7/8/2009 7:08:54 PM
G - Considerable loss today with twice average volume led to a 50 DMA line violation and triggered a technical sell signal. First featured in yellow in the May 18, 2009 mid-day report (read here). The number of top-rated funds owning its shares rose from 123 in June '08 to 199 in March '09, which is good news concerning the I criteria. Its annual earnings (the A criteria) history showed a dowturn in 2006, leaving concerns, but it followed that up with strong growth the next 2 years. Its small supply of shares (the S criteria) outstanding could contribute to especially great volatility in the event of institutional accumulation or distribution.
>>> The latest Featured Stock Update with an annotated graph appeared on 6/26/2009. click here.
|
|
C
A
S
I |
News |
Chart |
SEC
View all notes Alert
me of new notes
Company
Profile
|
TNDM
- NASDAQ
Tandem Diabetes Care Inc
TELECOMMUNICATIONS - Wireless Communications
|
$26.80
|
N/A
|
N/A
N/A
|
3/2/2009
(Date
Featured) |
$18.89
(Price
Featured) |
PP = $29.85 |
G |
| MB = $31.34 |
Most Recent Note - 7/8/2009 7:10:15 PM
G - Loss today on near average volume, sinking further below its 50 DMA line, raising concerns. Its choppy chart offers no sound base per the investment system's guidelines. It traded up as much as +72.42% since first featured at $18.89 in the 3/02/09 Mid-Day BreakOuts Report (read here).
>>> The latest Featured Stock Update with an annotated graph appeared on 7/7/2009. click here.
|
|
C
A
S
I |
News |
Chart |
SEC
View all notes Alert
me of new notes
Company
Profile
|
|
|
|
THESE ARE NOT BUY RECOMMENDATIONS!
Comments contained in the body of this report are technical
opinions only. The material herein has been obtained
from sources believed to be reliable and accurate, however,
its accuracy and completeness cannot be guaranteed.
This site is not an investment advisor, hence it does
not endorse or recommend any securities or other investments.
Any recommendation contained in this report may not
be suitable for all investors and it is not to be deemed
an offer or solicitation on our part with respect to
the purchase or sale of any securities. All trademarks,
service marks and trade names appearing in this report
are the property of their respective owners, and are
likewise used for identification purposes only.
This report is a service available
only to active Paid Premium Members.
You may opt-out of receiving report notifications
at any time. Questions or comments may be submitted
by writing to Premium Membership Services 665 S.E. 10 Street, Suite 201 Deerfield Beach, FL 33441-5634 or by calling 1-800-965-8307
or 954-785-1121.
|
|
|


