You are not logged in.
This means you
CAN ONLY VIEW reports that were published prior to Monday, April 14, 2025.
You
MUST UPGRADE YOUR MEMBERSHIP if you want to see any current reports.
AFTER MARKET UPDATE - WEDNESDAY, JULY 7TH, 2010
Previous After Market Report Next After Market Report >>>
|
|
|
|
DOW |
+274.66 |
10,018.28 |
+2.82% |
|
Volume |
1,338,930,820 |
+2% |
|
Volume |
2,098,434,270 |
+1% |
|
NASDAQ |
+65.59 |
2,159.47 |
+3.13% |
|
Advancers |
2,650 |
84% |
|
Advancers |
2,094 |
75% |
|
S&P 500 |
+32.21 |
1,060.27 |
+3.13% |
|
Decliners |
448 |
14% |
|
Decliners |
604 |
22% |
|
Russell 2000 |
+21.63 |
611.66 |
+3.67% |
|
52 Wk Highs |
51 |
|
|
52 Wk Highs |
15 |
|
|
S&P 600 |
+11.03 |
329.20 |
+3.47% |
|
52 Wk Lows |
63 |
|
|
52 Wk Lows |
132 |
|
|
 |
Indices Post Solid Gains Confirming Renewed Rally Effort
Adam Sarhan, Contributing Writer,
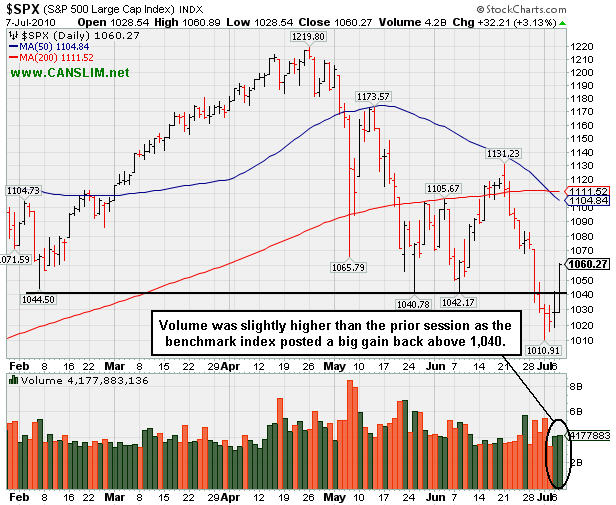
Stocks scored a follow-through day (FTD) on the fourth day of their latest rally attempt as volume, a critical component of institutional sponsorship, topped Tuesday's levels while advancers trumped decliners by more than a 3-to-1 ratio on the Nasdaq exchange and by nearly a 6-to-1 ratio on the NYSE. However, there were only 7 high-ranked companies from the CANSLIM.net Leaders List that made a new 52-week high and appeared on the CANSLIM.net BreakOuts Page, lower than the 8 issues that appeared on the prior session. Meanwhile, new 52-week lows outnumbered new 52-week highs on the Nasdaq and on the NYSE. It will be critically important for leadership to expand if the new rally effort will prove to be a sustained market advance. If not, Wednesday's strong move may turn out to be the latest in a string of failed rallies confirmed with follow-through days.
Rovi Corp (ROVI +$1.89 or +4.79% to $41.31) posted a solid gain with volume +67% above average as it cleared its latest pivot point. The high-ranked Computer Software firm was among a thin field of high-ranked leaders reaching a new 52-week high. It first appeared as a Featured Stock highlighted in yellow in the mid-day report on 2/25/10 at $33.45, and it stayed well above its 200-day moving average (DMA) during its latest consolidation.
Further clarifying the day count as we see it, last Thursday, July 1, all of the major averages marked Day 1 of a new rally attempt. Although they closed that session with losses, strong finishes in the upper part of their intra-day ranges suggested that support was being found which, arguably, satisfied the essence of a new rally attempt. Since then, the Dow Jones Industrial Average and small-cap Russell 2000 index both undercut Thursday's lows which reset the day count for each, however, they both rallied on Tuesday which marked Day 1 for those two indexes. Meanwhile, the tech-heavy Nasdaq Composite and the benchmark S&P 500 Index avoided undercutting Thursday's lows, so Wednesday's session marked Day 4 and opened the window for a new FTD to emerge. Remember that there are three important characteristics that must occur in order for a sound FTD to emerge: One or more of the major averages must rally at least +1.7% (anytime after Day 3 of a new rally attempt), volume on the exchange(s) must be higher than the prior session, and a new batch of high-ranked leaders must hit new 52-week highs and trigger fresh technical buy signals.
Elsewhere, the US dollar continued its 3-week slide which sent a slew of dollar denominated assets higher (mainly stocks and commodities). In addition, growth in US retail sales sparked optimism that earnings season will top weak estimates. Investors also believe that most European banks will pass their stress tests which has weighed on the market's psyche in recent months. The International Council of Shopping Centers released a report which showed that sales were growing at the fastest pace since 2006 which helped allay concerns that the slump in consumer confidence will threaten the economic recovery.
Looking forward, the window is now open for disciplined investors to begin carefully buying high-ranked stocks again. The major indices' 200-day moving average (DMA) lines may act as near term resistance. Remember to remain very selective because all of the major averages are still trading below their downward sloping 50 and 200 DMA lines. It was also somewhat disconcerting to see volume remain light (below average) behind the confirming gains. It is important to note that approximately 75% of FTDs lead to new sustained rallies, while 25% fail. In addition, every major rally in market history has begun with a FTD, but not every FTD leads to a new rally. Trade accordingly.
Q2 Webcast Rewind: The Q2 2010 CANSLIM.net Webcast aired at 8PM on Wednesday, June 30, 2010. A link to the webcast has been added near the top on the Premium Membership Homepage which will allow all who have UPGRADED with a currently active premium (paid) membership to view the webcast ON DEMAND at any time. To UPGRADE now for access to the webcast and all premium reports CLICK HERE.
PICTURED: The benchmark S&P 500 Index rallied for a solid gain to close back above the previously noted 1,040 level which had served as formidable support for most of the year.
|
|
|
 |
Bank Index Among Session's Leading Group Gainers
Kenneth J. Gruneisen - Passed the CAN SLIM® Master's Exam
The Bank Index ($BKX +5.63%) and Broker/Dealer Index ($XBD +2.37%) provided a great deal of the positive influence underpinning gains for the major averages on Wednesday. The tech sector was led higher by big gains from the Semiconductor Index ($SOX +5.05%), Networking Index ($NWX +4.46%), and Internet Index ($IIX +4.06%) while the Biotechnology Index ($BTK +1.00%) followed with a smaller gain. Energy shares posted gains that helped the Oil Services Index ($OSX +4.59%) and Integrated Oil Index ($XOI +3.61%) spurt higher. The Retail Index ($RLX +2.44%) tallied a solid gain while defensive areas produced smaller gains as the Healthcare Index ($HMO +1.53%) and Gold & Silver Index ($XAU +2.80%) also were on the rise.
Charts courtesy www.stockcharts.com
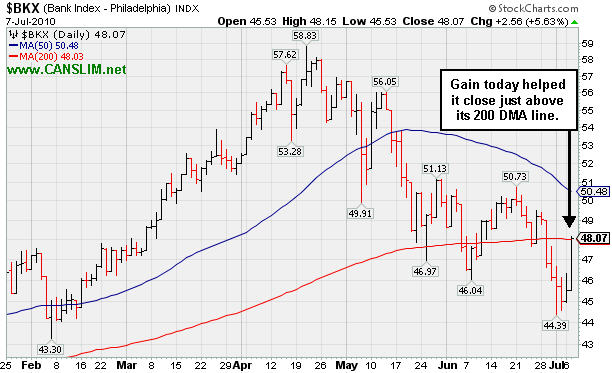
PICTURED: The Bank Index ($BKX +5.63%) was a standout gainer while Wednesday's session was widely positive. Its considerable gain helped it close just above its 200-day moving average (DMA) line. However, its worrisome downward trend since April is still marked by a series of lower highs and lower lows. Subsequent gains above its June high and 50 DMA line would be a very reassuring sign to watch for from this groups that has proven to be a very important leading indicator for the overall market.
| Oil Services |
$OSX |
174.02 |
+7.63 |
+4.59% |
-10.72% |
| Healthcare |
$HMO |
1,396.34 |
+21.05 |
+1.53% |
-5.20% |
| Integrated Oil |
$XOI |
923.45 |
+32.17 |
+3.61% |
-13.55% |
| Semiconductor |
$SOX |
347.87 |
+16.72 |
+5.05% |
-3.35% |
| Networking |
$NWX |
225.34 |
+9.62 |
+4.46% |
-2.48% |
| Internet |
$IIX |
228.95 |
+8.94 |
+4.06% |
-2.10% |
| Broker/Dealer |
$XBD |
98.77 |
+2.29 |
+2.37% |
-14.15% |
| Retail |
$RLX |
393.05 |
+9.38 |
+2.44% |
-4.40% |
| Gold & Silver |
$XAU |
173.09 |
+4.72 |
+2.80% |
+2.88% |
| Bank |
$BKX |
48.07 |
+2.56 |
+5.63% |
+12.55% |
| Biotech |
$BTK |
1,005.08 |
+9.90 |
+1.00% |
+6.68% |
|
|
|
 |
Gain Today For New High Close Bodes Well
Kenneth J. Gruneisen - Passed the CAN SLIM® Master's Exam
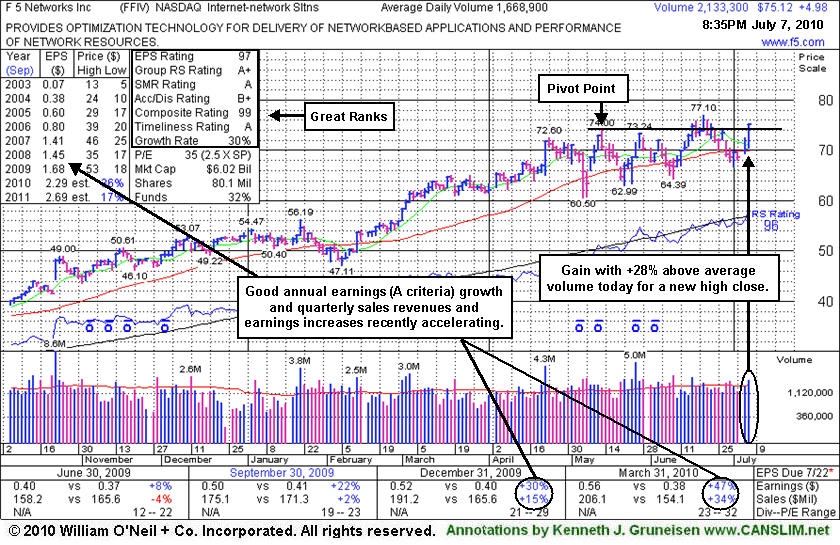
F5 Networks Inc. (FFIV +$4.98 or +7.10% to $75.12) posted a considerable gain today with +28% above average volume that helped it rally above its previously cited pivot point for a new high close. Its color code was changed to yellow based on its recent resilience. It is now clear of virtually all resistance due to overhead supply, and the path of least resistance is more likely to lead it even higher. Disciplined investors may watch for a more powerful gain backed by heavier volume as a reassurance confirming a proper technical buy signal. Meanwhile, its recent chart low ($66.79 on 7/01/10) defines a near-term support level to watch.
Its last FSU section appearance on 6/16/10 under the headline "Volume Barely Met Guideline Behind Breakout Gain" provided detailed analysis and an annotated graph after it appeared featured in yellow in that day's mid-day report (read here) with a pivot point based upon its 5/13/10 high plus ten cents.
The company currently sports a very healthy Earnings Per Share (EPS) rating of 97 and a Relative Strength (RS) rating of 96. It resides in the Internet- Networking Solutions group which is an Industry Group showing lots of leadership, satisfying the "L" criteria. In recent months FFIV made a number of appearances in the mid-day report as its quarterly sales and earnings results showed impressive acceleration in the Mar '10 and Dec '09 periods, but it was also noted that it had not formed an ideal base pattern and patience was needed. The company has maintained a good annual earnings (A criteria) history. This stock was first featured in the January 2004 edition of CANSLIM.net News (read here) with a $26.85 pivot point. During the past 6 years, FFIV has built several bases, and it has also been through some tough consolidation periods.
|
|
|
Color Codes Explained :
Y - Better candidates highlighted by our
staff of experts.
G - Previously featured
in past reports as yellow but may no longer be buyable under the
guidelines.
***Last / Change / Volume data in this table is the closing quote data***
Symbol/Exchange
Company Name
Industry Group |
PRICE |
CHANGE
(%Change) |
Day High |
Volume
(% DAV)
(% 50 day avg vol) |
52 Wk Hi
% From Hi |
Featured
Date |
Price
Featured |
Pivot Featured |
|
Max Buy |
AAPL
-
NASDAQ
Apple Inc
COMPUTER HARDWARE - Personal Computers
|
$258.67
|
+10.04
4.04% |
$258.77
|
23,316,043
81.00% of 50 DAV
50 DAV is 28,785,800
|
$279.01
-7.29%
|
6/17/2010
|
$270.95
|
PP = $272.56
|
|
MB = $286.19
|
 Most Recent Note - 7/7/2010 6:58:41 PM
G - Gain with below average volume today helped it rebound above its 50 DMA line. It struggled in a challenging market (M criteria) environment since featured in the 6/17/10 mid-day report (read here).
>>> The latest Featured Stock Update with an annotated graph appeared on 6/17/2010. Click here.
View all notes |
Alert me of new notes |
CANSLIM.net Company Profile |
SEC |
Zacks Reports |
StockTalk |
News |
Chart |
Request a new note
C
A N
S L
I M


|
ABV
-
NYSE
Comp De Bebidas Adr
FOOD and BEVERAGE - Beverages - Brewers
|
$105.16
|
+1.24
1.19% |
$105.26
|
390,784
53.28% of 50 DAV
50 DAV is 733,500
|
$109.33
-3.81%
|
6/29/2010
|
$104.74
|
PP = $109.33
|
|
MB = $114.80
|
Most Recent Note - 7/7/2010 7:02:22 PM
Y - Brazil-based beverage firm found support near its 50 DMA line last week. Today's gain helped it rebound and close above the price when first featured in yellow in the 6/29/10 mid-day report (read here) with a note while - "perched near all-time highs after building an orderly base pattern and finding impressive support near its 200 DMA line in recent months. It has a great annual earnings (A criteria) history and its recent quarterly earnings and sales revenues increases have shown acceleration. A gain above its pivot point with heavy volume still needed to confirm a proper new technical buy signal."
>>> The latest Featured Stock Update with an annotated graph appeared on 6/29/2010. Click here.
View all notes |
Alert me of new notes |
CANSLIM.net Company Profile |
SEC |
Zacks Reports |
StockTalk |
News |
Chart |
Request a new note
C
A N
S L
I M
|
APEI
-
NASDAQ
American Public Educ Inc
DIVERSIFIED SERVICES - Education and Training Services
|
$42.98
|
+1.68
4.07% |
$43.20
|
267,887
151.78% of 50 DAV
50 DAV is 176,500
|
$48.95
-12.20%
|
6/7/2010
|
$46.60
|
PP = $46.29
|
|
MB = $48.60
|
Most Recent Note - 7/7/2010 7:04:49 PM
G - Gain today with above average volume helped it rally toward its 50 DMA line, breaking a streak of 7 consecutive losses.
>>> The latest Featured Stock Update with an annotated graph appeared on 7/2/2010. Click here.
View all notes |
Alert me of new notes |
CANSLIM.net Company Profile |
SEC |
Zacks Reports |
StockTalk |
News |
Chart |
Request a new note
C
A N
S L
I M
|
BIDU
-
NASDAQ
Baidu Inc Ads
INTERNET - Internet Information Providers
|
$72.37
|
+4.92
7.29% |
$72.44
|
12,801,457
85.11% of 50 DAV
50 DAV is 15,040,600
|
$82.29
-12.05%
|
1/13/2010
|
$43.13
|
PP = $42.68
|
|
MB = $44.81
|
Most Recent Note - 7/7/2010 7:07:17 PM
G - Considerable gain today with below average volume for a close back above its 50 DMA line (now at $71.32) for the first time since its damaging 6/29/10 gap down. Prior chart lows in the $66 area define important chart support.
>>> The latest Featured Stock Update with an annotated graph appeared on 6/21/2010. Click here.
View all notes |
Alert me of new notes |
CANSLIM.net Company Profile |
SEC |
Zacks Reports |
StockTalk |
News |
Chart |
Request a new note
C
A N
S L
I M
|
CISG
-
NASDAQ
Cninsure Inc Ads
INSURANCE - Insurance Brokers
|
$27.35
|
+0.57
2.13% |
$27.36
|
131,901
42.49% of 50 DAV
50 DAV is 310,400
|
$28.62
-4.44%
|
6/16/2010
|
$27.20
|
PP = $27.75
|
|
MB = $29.14
|
Most Recent Note - 7/7/2010 7:11:44 PM
Y - Today marked its 3rd consecutive gain on below average volume as it closed -4.4% off its 52-week high. Color code is changed to yellow based on its recent resilience. Featured in the 6/16/10 mid-day report (read here).
>>> The latest Featured Stock Update with an annotated graph appeared on 6/18/2010. Click here.
View all notes |
Alert me of new notes |
CANSLIM.net Company Profile |
SEC |
Zacks Reports |
StockTalk |
News |
Chart |
Request a new note
C
A N
S L
I M
|
Symbol/Exchange
Company Name
Industry Group |
PRICE |
CHANGE
(%Change) |
Day High |
Volume
(% DAV)
(% 50 day avg vol) |
52 Wk Hi
% From Hi |
Featured
Date |
Price
Featured |
Pivot Featured |
|
Max Buy |
CRM
-
NYSE
Salesforce.Com Inc
INTERNET - Internet Software and Services
|
$91.38
|
+3.27
3.71% |
$91.47
|
2,765,358
96.13% of 50 DAV
50 DAV is 2,876,600
|
$97.94
-6.70%
|
6/2/2010
|
$88.44
|
PP = $89.60
|
|
MB = $94.08
|
Most Recent Note - 7/7/2010 7:25:12 PM
Y - Rising further above its 50 DMA line, today it closed near the session high with its 5th consecutive gain. Color code is changed to yellow based on its recent resilience. An upward trendline connecting its February - May lows now defines an important support level.
>>> The latest Featured Stock Update with an annotated graph appeared on 6/22/2010. Click here.
View all notes |
Alert me of new notes |
CANSLIM.net Company Profile |
SEC |
Zacks Reports |
StockTalk |
News |
Chart |
Request a new note
C
A N
S L
I M
|
CVLT
-
NASDAQ
Commvault Systems Inc
COMPUTER SOFTWARE and SERVICES - Business Software and Services
|
$22.87
|
+0.62
2.79% |
$23.04
|
949,812
168.83% of 50 DAV
50 DAV is 562,600
|
$24.51
-6.69%
|
7/6/2010
|
$23.16
|
PP = $24.45
|
|
MB = $25.67
|
Most Recent Note - 7/7/2010 7:30:44 PM
Y - Posted a solid gain with well above average volume in 3 of the past 4 sessions. Building on the right side of a 6-month flat base within close striking distance of its 52-week high and all-time high, it was featured in the 7/06/10 mid-day report (read here). Color code was changed to yellow with its pivot point based on its 5/18/10 high plus ten cents. Its annual earnings (A criteria) history includes a slight downward turn in FY '09, yet it has an impressive history and recent quarters showed accelerating sales revenues and earnings increases with +25% earnings increases or greater in 3 out of the past 4 comparisons versus the year ago period. On 1/31/07 it was removed from the CANSLIM.net Featured Stocks list.
>>> The latest Featured Stock Update with an annotated graph appeared on 7/6/2010. Click here.
View all notes |
Alert me of new notes |
CANSLIM.net Company Profile |
SEC |
Zacks Reports |
StockTalk |
News |
Chart |
Request a new note
C
A N
S L
I M
|
DECK
-
NASDAQ
Deckers Outdoor Corp
CONSUMER NON-DURABLES - Textile - Apparel Footwear
|
$46.72
|
+2.29
5.15% |
$46.79
|
1,337,836
246.92% of 50 DAV
50 DAV is 541,800
|
$56.17
-16.82%
|
6/11/2010
|
$157.34
|
PP = $158.57
|
|
MB = $166.50
|
Most Recent Note - 7/7/2010 7:37:01 PM
G - Gain today ended a streak of 6 consecutive losses. It remains below its 50 DMA line which may now act as resistance. Do not be confused, as the most recent Featured Price, Pivot Point and Max Buy levels have been adjusted to account for a stock split 3:1 effective as of 7/06/10.
>>> The latest Featured Stock Update with an annotated graph appeared on 7/1/2010. Click here.
View all notes |
Alert me of new notes |
CANSLIM.net Company Profile |
SEC |
Zacks Reports |
StockTalk |
News |
Chart |
Request a new note
C
A N
S L
I M
|
FFIV
-
NASDAQ
F 5 Networks Inc
INTERNET - Internet Software and Services
|
$75.12
|
+4.98
7.10% |
$75.16
|
2,138,507
127.92% of 50 DAV
50 DAV is 1,671,700
|
$77.10
-2.57%
|
6/16/2010
|
$74.50
|
PP = $74.10
|
|
MB = $77.81
|
Most Recent Note - 7/7/2010 7:42:43 PM
Y - Considerable gain today with +28% above average volume helped it rally above its previously cited pivot point for a new high close. Its color code was changed to yellow based on its recent resilience. Recent chart low ($66.79 on 7/01/10) now defines a near-term support level to watch.
>>> The latest Featured Stock Update with an annotated graph appeared on 7/7/2010. Click here.
View all notes |
Alert me of new notes |
CANSLIM.net Company Profile |
SEC |
Zacks Reports |
StockTalk |
News |
Chart |
Request a new note
C
A N
S L
I M
|
MELI
-
NASDAQ
Mercadolibre Inc
INTERNET - Internet Software and; Services
|
$55.42
|
+2.20
4.13% |
$55.52
|
626,553
68.82% of 50 DAV
50 DAV is 910,400
|
$62.14
-10.81%
|
5/13/2010
|
$54.21
|
PP = $55.85
|
|
MB = $58.64
|
Most Recent Note - 7/7/2010 7:52:51 PM
G - Rising on light volume for a second day in a row after finding support near its 50 DMA line. Its recent low ($49.55 on 7/01/10) now defines near-term chart support.
>>> The latest Featured Stock Update with an annotated graph appeared on 6/30/2010. Click here.
View all notes |
Alert me of new notes |
CANSLIM.net Company Profile |
SEC |
Zacks Reports |
StockTalk |
News |
Chart |
Request a new note
C
A N
S L
I M
|
Symbol/Exchange
Company Name
Industry Group |
PRICE |
CHANGE
(%Change) |
Day High |
Volume
(% DAV)
(% 50 day avg vol) |
52 Wk Hi
% From Hi |
Featured
Date |
Price
Featured |
Pivot Featured |
|
Max Buy |
NEM
-
NYSE
Newmont Mining Corp
METALS and MINING - Gold
|
$59.99
|
+1.37
2.34% |
$59.99
|
8,445,363
83.65% of 50 DAV
50 DAV is 10,095,600
|
$62.62
-4.20%
|
6/22/2010
|
$59.60
|
PP = $59.67
|
|
MB = $62.65
|
Most Recent Note - 7/7/2010 7:55:32 PM
Y - Gain today with below average volume helped it rebound and close above its pivot point, ending a streak of 3 consecutive losses. Featured in a 6/22/10 Stock Bulletin with annotated graph (read here).
>>> The latest Featured Stock Update with an annotated graph appeared on 6/22/2010. Click here.
View all notes |
Alert me of new notes |
CANSLIM.net Company Profile |
SEC |
Zacks Reports |
StockTalk |
News |
Chart |
Request a new note
C
A N
S L
I M
|
ROVI
-
NASDAQ
Rovi Corp
COMPUTER SOFTWARE andamp; SERVICES - Security Software andamp; Services
|
$41.31
|
+1.89
4.79% |
$41.50
|
2,339,221
167.08% of 50 DAV
50 DAV is 1,400,100
|
$40.06
3.12%
|
6/3/2010
|
$38.70
|
PP = $40.16
|
|
MB = $42.17
|
Most Recent Note - 7/7/2010 8:00:29 PM
Y - Hit a new 52-week high today with a solid gain above its pivot point backed by +67% above average volume triggering a new technical buy signal. No overhead supply remains to act as resistance.
>>> The latest Featured Stock Update with an annotated graph appeared on 6/28/2010. Click here.
View all notes |
Alert me of new notes |
CANSLIM.net Company Profile |
SEC |
Zacks Reports |
StockTalk |
News |
Chart |
Request a new note
C
A N
S L
I M
|
SUMR
-
NASDAQ
Summer Infant Inc
CONSUMER NON-DURABLES - Personal Products
|
$6.64
|
+0.03
0.45% |
$6.79
|
55,606
51.16% of 50 DAV
50 DAV is 108,700
|
$8.42
-21.14%
|
5/4/2010
|
$6.85
|
PP = $7.09
|
|
MB = $7.44
|
Most Recent Note - 7/7/2010 8:03:47 PM
G - Its 50 DMA line has recently acted as resistance. Gains above it and recent chart highs near $7.40 would be an encouraging technical improvement. Meanwhile, prior chart lows in the $6.25 area define important support to watch.
>>> The latest Featured Stock Update with an annotated graph appeared on 6/24/2010. Click here.
View all notes |
Alert me of new notes |
CANSLIM.net Company Profile |
SEC |
Zacks Reports |
StockTalk |
News |
Chart |
Request a new note
C
A N
S L
I M
|
THOR
-
NASDAQ
Thoratec Corp
HEALTH SERVICES - Medical Instruments and Supplies
|
$44.46
|
+1.10
2.54% |
$44.56
|
561,660
47.27% of 50 DAV
50 DAV is 1,188,100
|
$47.93
-7.24%
|
6/3/2010
|
$44.38
|
PP = $45.35
|
|
MB = $47.62
|
Most Recent Note - 7/7/2010 8:05:16 PM
Y - Found support near its a 50 DMA line, an important support level. Color code is changed to yellow based on its resilience
>>> The latest Featured Stock Update with an annotated graph appeared on 6/23/2010. Click here.
View all notes |
Alert me of new notes |
CANSLIM.net Company Profile |
SEC |
Zacks Reports |
StockTalk |
News |
Chart |
Request a new note
C
A N
S L
I M
|
ULTA
-
NASDAQ
Ulta Salon Cosm & Frag
SPECIALTY RETAIL - Specialty Retail, Other
|
$23.35
|
+1.14
5.13% |
$23.46
|
787,729
114.26% of 50 DAV
50 DAV is 689,400
|
$26.75
-12.71%
|
5/28/2010
|
$25.58
|
PP = $25.86
|
|
MB = $27.15
|
Most Recent Note - 7/7/2010 3:15:41 PM
G - Gain today has it rallying back toward its 50 DMA line which may now act as resistance. Its May - June chart lows in the $21 area define the next support level just above its 200 DMA line.
>>> The latest Featured Stock Update with an annotated graph appeared on 6/25/2010. Click here.
View all notes |
Alert me of new notes |
CANSLIM.net Company Profile |
SEC |
Zacks Reports |
StockTalk |
News |
Chart |
Request a new note
C
A N
S L
I M
|
Symbol/Exchange
Company Name
Industry Group |
PRICE |
CHANGE
(%Change) |
Day High |
Volume
(% DAV)
(% 50 day avg vol) |
52 Wk Hi
% From Hi |
Featured
Date |
Price
Featured |
Pivot Featured |
|
Max Buy |
|
|
|
THESE ARE NOT BUY RECOMMENDATIONS!
Comments contained in the body of this report are technical
opinions only. The material herein has been obtained
from sources believed to be reliable and accurate, however,
its accuracy and completeness cannot be guaranteed.
This site is not an investment advisor, hence it does
not endorse or recommend any securities or other investments.
Any recommendation contained in this report may not
be suitable for all investors and it is not to be deemed
an offer or solicitation on our part with respect to
the purchase or sale of any securities. All trademarks,
service marks and trade names appearing in this report
are the property of their respective owners, and are
likewise used for identification purposes only.
This report is a service available
only to active Paid Premium Members.
You may opt-out of receiving report notifications
at any time. Questions or comments may be submitted
by writing to Premium Membership Services 665 S.E. 10 Street, Suite 201 Deerfield Beach, FL 33441-5634 or by calling 1-800-965-8307
or 954-785-1121.
|
|
|


