You are not logged in.
This means you
CAN ONLY VIEW reports that were published prior to Wednesday, March 26, 2025.
You
MUST UPGRADE YOUR MEMBERSHIP if you want to see any current reports.
AFTER MARKET UPDATE - TUESDAY, JULY 7TH, 2009
Previous After Market Report Next After Market Report >>>
|
|
|
|
DOW |
-161.27 |
8,163.60 |
-1.94% |
|
Volume |
1,107,473,080 |
-3% |
|
Volume |
2,109,962,230 |
+5% |
|
NASDAQ |
-41.23 |
1,746.17 |
-2.31% |
|
Advancers |
659 |
21% |
|
Advancers |
660 |
23% |
|
S&P 500 |
-17.69 |
881.03 |
-1.97% |
|
Decliners |
2,350 |
75% |
|
Decliners |
2,030 |
72% |
|
Russell 2000 |
-9.78 |
484.25 |
-1.98% |
|
52 Wk Highs |
16 |
|
|
52 Wk Highs |
18 |
|
|
S&P 600 |
-4.65 |
257.24 |
-1.78% |
|
52 Wk Lows |
5 |
|
|
52 Wk Lows |
15 |
|
|
 |
Indices Face Pressure; Losses Raise Technical Concerns
Adam Sarhan, Contributing Writer,
The major averages and several commodities fell as the US dollar rallied on Tuesday. Volume totals were reported lighter than average and mixed, yet near the prior session totals on the NYSE and on the Nasdaq exchange. Decliners trumped advancers by about a 3-to-1 ratio on the NYSE and on the Nasdaq exchange. There were only 4 high-ranked companies from the CANSLIM.net Leaders List that made a new 52-week high and appeared on the CANSLIM.net BreakOuts Page, one more than the 3 issues that appeared on the prior session.
Investors sold stocks and commodities and moved to the greenback as concern spread that second quarter earnings will not be strong enough to justify the robust rally (nearly +50% rally in the Nasdaq Composite) seen in the major averages since their March lows. Losses led the Nasdaq Composite Index to its lowest close since May 1st. Many investors feel that stocks have moved up too quickly from their March lows, and that the recession has not fully ended. The second quarter earnings season will officially begin after Alcoa (AA +1.62%), the first Dow component, announces its second quarter results.
The current rally which began on the March 12, 2009 follow through day (FTD) has stalled since the middle of June as the major averages have paused to consolidate their recent gains. The benchmark S&P 500 index slid -6% since June 12, 2009 and is currently fighting to maintain an 18-week rally. The S&P 500's current P/E ratio is 14.2 times over the past 12 months earnings, which is higher than what has been seen in prior bear markets. Further, it should be noted that the Dow Jones Industrial Average, technically, sliced below the neckline of its recent head-and-shoulders pattern. This pattern is bearish in nature, despite the fact that volume was lighter than average as the Dow sold off. This brings to mind something which has occasionally been heard around the office: "When in doubt, let time work it out."
Leading stocks continue to be the bane for this current rally. Remember that every new sustained bull market began with a healthy new batch of high-ranked leadership - stocks triggering technical buy signals as they break out of sound bases. So far, the primary problem for the major averages has been a dearth of high-ranked stocks that performed well since early March. The vast majority of high-ranked stocks (mainly Chinese tech stocks) that broke out of a sound bases have failed or gone sideways at best in recent weeks. This is not the healthy action seen in prior bull markets. This suggests that patience is paramount as this market spends more time consolidating and stabilizing after last year's violent collapse.
PICTURED: The Dow Jones Industrial Average sliced below the "neckline" of its head-and-shoulders topping pattern.
|
|
|
 |
Healthcare Group Posts Standout Gains
Kenneth J. Gruneisen - Passed the CAN SLIM® Master's Exam
The Integrated Oil ($XOI -2.02%) and Oil Services ($OSX -3.14%) indexes sank as the energy group continued to see prices contract on Tuesday, and the tech sector faced widespread pressure as the Networking ($NWX -3.06%), Semiconductor ($SOX -2.89%), Internet ($IIX -2.78%), and Biotechnoogy ($BTK -2.01%) indexes each lost more than -2% on the session. The Retail Index ($RLX -2.10%) and financial shares also had a great deal of negative influence on the major averages as the Broker/Dealer Index ($XBD -3.75%) outpaced the Bank Index ($BKX -0.74%) to the downside. The Gold & Silver Index ($XAU -0.53%) ended with a small loss, but it has been noted recently as no great "safe haven" area for investors looking to find any areas which might perform inversely to the equities markets should they spiral downward.
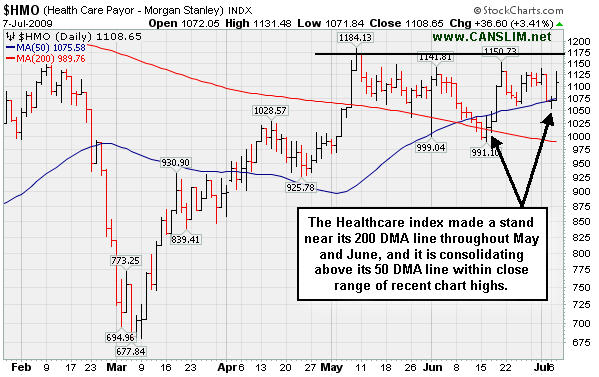
PICTURED: The Healthcare ($HMO +3.41%) group was a standout gainer on a mostly negative session. Government entitlement programs are encountering financial challenges in how to maintain healthcare services for a huge wave of aging baby boomers, and while there are certain favorable industry demographics, the prospect of price and wage controls contributes to the rather foggy outlook for many healthcare firms. Tuesday's gains came amid reports from sources such as briefing.com which said that some hospitals have agreed to contribute funds toward covering the uninsured in the future. The agreement was said to remove an "element of uncertainty from the sector" amid ongoing government efforts to "reform" healthcare.
| Oil Services |
$OSX |
145.64 |
-4.72 |
-3.14% |
+19.98% |
| Healthcare |
$HMO |
1,108.65 |
+36.60 |
+3.41% |
+15.46% |
| Integrated Oil |
$XOI |
859.06 |
-17.73 |
-2.02% |
-12.31% |
| Semiconductor |
$SOX |
252.73 |
-7.51 |
-2.89% |
+19.12% |
| Networking |
$NWX |
174.75 |
-5.51 |
-3.06% |
+21.45% |
| Internet |
$IIX |
176.82 |
-5.05 |
-2.78% |
+32.18% |
| Broker/Dealer |
$XBD |
92.94 |
-3.62 |
-3.75% |
+19.97% |
| Retail |
$RLX |
304.23 |
-6.52 |
-2.10% |
+8.94% |
| Gold & Silver |
$XAU |
133.51 |
-0.71 |
-0.53% |
+7.80% |
| Bank |
$BKX |
34.81 |
-0.26 |
-0.74% |
-21.46% |
| Biotech |
$BTK |
646.13 |
-13.26 |
-2.01% |
-0.16% |
|
|
|
 |
Good Watchlist Candidate Needs More Time
Kenneth J. Gruneisen - Passed the CAN SLIM® Master's Exam
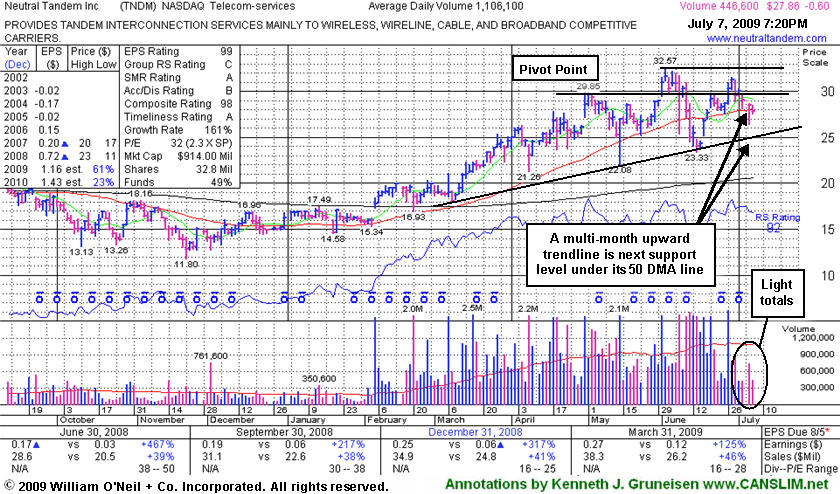
Neutral Tandem Inc (TNDM -$0.60 or -2.11% to $27.86) quietly consolidated to a close today just under its 50-day moving average (DMA) line again. Its recent rebound ran out of steam short of its prior chart highs. Technical sell signals and heavy distribution completely negated its latest breakout above the pivot point of $29.85 based upon the stock's May 1st high, and it is slumping back into its prior base and below that important short-term average once again. TNDM traded up as much as +72.42% since first featured at $18.89 in the 3/02/09 Mid-Day BreakOuts Report (read here).
Its choppy consolidation over the past 5-weeks since it reached an all-time high of $32.57 still offers no ideal entry point within the investment system's guidelines. This high-ranked leader should remain on an active watch list until a sound new base has formed. Meanwhile, a multi-month upward trendline identifies the next important support level to watch.
|
|
|
Color Codes Explained :
Y - Better candidates highlighted by our
staff of experts.
G - Previously featured
in past reports as yellow but may no longer be buyable under the
guidelines.
***Last / Change / Volume quote data in this table corresponds with the timestamp on the note***
Symbol/Exchange
Company Name
Industry Group |
Last |
Chg. |
Vol
% DAV |
Date Featured |
Price Featured |
Latest Pivot Point
Featured |
Status |
| Latest Max Buy Price |
GMCR
- NASDAQ
Green Mtn Coffee Roastrs
FOOD & BEVERAGE - Processed & Packaged Goods
|
$56.17
|
N/A
|
N/A
N/A
|
1/1/2008
(Date
Featured) |
$27.13
(Price
Featured) |
PP = $28.66 |
G |
| MB = $30.09 |
Most Recent Note - 7/7/2009 7:13:53 PM
G - Quietly consolidating above its 50 DMA line -important support to watch. On 6/09/09 it reached a new all-time high with a gain on light volume as a 3:2 stock split took effect. GMCR traded up more than +144% since appearing with an annotated graph under the headline "It May Soon Be Time To Go Green" when featured in the January 2009 CANSLIM.net News (read here).
>>> The latest Featured Stock Update with an annotated graph appeared on 7/6/2009. click here.
|
|
C
A
S
I |
News |
Chart |
SEC
View all notes Alert
me of new notes
Company
Profile
|
HMSY
- NASDAQ
H M S Holdings Corp
COMPUTER SOFTWARE & SERVICES - Healthcare Information Service
|
$40.45
|
N/A
|
N/A
N/A
|
2/20/2009
(Date
Featured) |
$34.08
(Price
Featured) |
PP = $38.38 |
G |
| MB = $40.30 |
Most Recent Note - 7/7/2009 7:15:47 PM
G - Quietly consolidating near all-time highs. Prior chart highs and an upward trendline connecting its April-June lows come into play near $38, making that a very important initial support level above its 50 DMA line to watch. Gap up gain on 6/16/09 with heavy volume triggered a technical buy signal. No overhead supply is left to hinder the progress for this Commercial Services - Healthcare firm.
>>> The latest Featured Stock Update with an annotated graph appeared on 6/29/2009. click here.
|
|
C
A
S
I |
News |
Chart |
SEC
View all notes Alert
me of new notes
Company
Profile
|
LFT
-
|
$24.00
|
N/A
|
N/A
N/A
|
4/2/2009
(Date
Featured) |
$22.19
(Price
Featured) |
PP = $21.81 |
G |
| MB = $22.90 |
Most Recent Note - 7/7/2009 7:17:20 PM
G - Its outlook gets increasingly questionable the longer it remains trading under its 50 DMA line. Its progress could be hindered by future share offerings. This Chinese Computer Software firm recently filed a registration of approximately 16 million shares for resale, and it also revealed a planned acquisition of another Chinese service provider.
>>> The latest Featured Stock Update with an annotated graph appeared on 7/1/2009. click here.
|
|
C
A
S
I |
News |
Chart |
SEC
View all notes Alert
me of new notes
Company
Profile
|
NTES
- NASDAQ
Netease Inc Adr
INTERNET - Internet Information Providers
|
$34.04
|
N/A
|
N/A
N/A
|
5/21/2009
(Date
Featured) |
$31.19
(Price
Featured) |
PP = $32.75 |
G |
| MB = $34.39 |
Most Recent Note - 7/7/2009 7:20:12 PM
G - Recent losses led to a worrisome violation of a multi-month upward trendline, yet it has thus far found support above its 50 DMA line. Prior chart highs in the $32 area make this an important technical support level to watch. It has negated all gains since its 5/28/09 gap up and considerable gain with +79% above average volume confirmed its last sound technical buy signal. Indications of institutional (the I criteria) buying demand have been noted after earnings news on 5/20/09 a shakeout tested support near its 50 DMA line. First featured at $26.75 in the 3/31/09 CANSLIM.net Mid-Day Breakouts Report (read here). This high-ranked Chinese Internet - Content firm was also summarized in greater detail including an annotated graph in the April 2009 issue of CANSLIM.net News (read here).
>>> The latest Featured Stock Update with an annotated graph appeared on 6/30/2009. click here.
|
|
C
A
S
I |
News |
Chart |
SEC
View all notes Alert
me of new notes
Company
Profile
|
NVEC
- NASDAQ
N V E Corp
ELECTRONICS - Semiconductor - Specialized
|
$43.92
|
N/A
|
N/A
N/A
|
3/13/2009
(Date
Featured) |
$33.85
(Price
Featured) |
PP = $45.50 |
Y |
| MB = $47.78 |
Most Recent Note - 7/7/2009 7:03:13 PM
Y - Today was its third consecutive loss on near average volume, sinking under its pivot point toward its 50 DMA line and prior highs which are important support to watch. Color code is changed to yellow based on healthy consolidation above support. Its 6/19/09 gain with volume more than 2 times average helped it rise from an "ascending base" type pattern to a new 52-week high and multi-year high, triggering a technical buy signal. Sales increases in recent comparisons have been under the +25% guideline and still rather minuscule, leaving concerns, especially in the event of any hiccups. This is a reason to be especially disciplined about proper entries and exits.
>>> The latest Featured Stock Update with an annotated graph appeared on 6/23/2009. click here.
|
|
C
A
S
I |
News |
Chart |
SEC
View all notes Alert
me of new notes
Company
Profile
|
SNDA
-
|
$55.26
|
N/A
|
N/A
N/A
|
5/31/2009
(Date
Featured) |
$57.62
(Price
Featured) |
PP = $53.95 |
G |
| MB = $56.65 |
Most Recent Note - 7/7/2009 7:05:25 PM
G - Consolidating near its 50 DMA line, and subsequent deterioration below its recent chart low near $50 would raise more serious concerns and trigger a worrisome technical sell signal. Detailed analysis was included when recently featured in the June 2009 issue of CANSLIM.net News. Be sure to review the "What to Look Out For" section and entire detailed summary - read here).
>>> The latest Featured Stock Update with an annotated graph appeared on 7/2/2009. click here.
|
|
C
A
S
I |
News |
Chart |
SEC
View all notes Alert
me of new notes
Company
Profile
|
SYNA
- NASDAQ
Synaptics Inc
COMPUTER SOFTWARE & SERVICES - Information Technology Service
|
$35.58
|
N/A
|
N/A
N/A
|
5/18/2009
(Date
Featured) |
$32.58
(Price
Featured) |
PP = $34.52 |
G |
| MB = $36.25 |
Most Recent Note - 7/7/2009 7:08:56 PM
G - Losses on average volume have it slumping under its August 2008 chart highs ($36) today while falling toward its 50 DMA line ($35.16). Further losses could violate that important support level and trigger technical sell signals. First featured in yellow in the May 18, 2009 mid-day report (read here). The number of top-rated funds owning its shares rose from 123 in June '08 to 199 in March '09, which is good news concerning the I criteria. Its annual earnings (the A criteria) history showed a dowturn in 2006, leaving concerns, but it followed that up with strong growth the next 2 years. Its small supply of shares (the S criteria) outstanding could contribute to especially great volatility in the event of institutional accumulation or distribution.
>>> The latest Featured Stock Update with an annotated graph appeared on 6/26/2009. click here.
|
|
C
A
S
I |
News |
Chart |
SEC
View all notes Alert
me of new notes
Company
Profile
|
TNDM
- NASDAQ
Tandem Diabetes Care Inc
TELECOMMUNICATIONS - Wireless Communications
|
$27.86
|
N/A
|
N/A
N/A
|
3/2/2009
(Date
Featured) |
$18.89
(Price
Featured) |
PP = $29.85 |
G |
| MB = $31.34 |
Most Recent Note - 7/7/2009 7:11:49 PM
G - Loss today on light volume led to a close just under its 50 DMA line again. Its choppy chart offers no sound base per the investment system's guidelines. It traded up as much as +72.42% since first featured at $18.89 in the 3/02/09 Mid-Day BreakOuts Report (read here).
>>> The latest Featured Stock Update with an annotated graph appeared on 7/7/2009. click here.
|
|
C
A
S
I |
News |
Chart |
SEC
View all notes Alert
me of new notes
Company
Profile
|
|
|
|
THESE ARE NOT BUY RECOMMENDATIONS!
Comments contained in the body of this report are technical
opinions only. The material herein has been obtained
from sources believed to be reliable and accurate, however,
its accuracy and completeness cannot be guaranteed.
This site is not an investment advisor, hence it does
not endorse or recommend any securities or other investments.
Any recommendation contained in this report may not
be suitable for all investors and it is not to be deemed
an offer or solicitation on our part with respect to
the purchase or sale of any securities. All trademarks,
service marks and trade names appearing in this report
are the property of their respective owners, and are
likewise used for identification purposes only.
This report is a service available
only to active Paid Premium Members.
You may opt-out of receiving report notifications
at any time. Questions or comments may be submitted
by writing to Premium Membership Services 665 S.E. 10 Street, Suite 201 Deerfield Beach, FL 33441-5634 or by calling 1-800-965-8307
or 954-785-1121.
|
|
|


