You are not logged in.
This means you
CAN ONLY VIEW reports that were published prior to Monday, April 14, 2025.
You
MUST UPGRADE YOUR MEMBERSHIP if you want to see any current reports.
AFTER MARKET UPDATE - FRIDAY, JULY 6TH, 2012
Previous After Market Report Next After Market Report >>>
|
|
|
|
DOW |
-124.20 |
12,772.47 |
-0.96% |
|
Volume |
596,384,650 |
-13% |
|
Volume |
1,399,134,120 |
+2% |
|
NASDAQ |
-38.79 |
2,937.33 |
-1.30% |
|
Advancers |
969 |
31% |
|
Advancers |
712 |
28% |
|
S&P 500 |
-12.90 |
1,354.68 |
-0.94% |
|
Decliners |
2,058 |
65% |
|
Decliners |
1,767 |
68% |
|
Russell 2000 |
-10.29 |
807.14 |
-1.26% |
|
52 Wk Highs |
156 |
|
|
52 Wk Highs |
55 |
|
|
S&P 600 |
-5.59 |
448.71 |
-1.23% |
|
52 Wk Lows |
7 |
|
|
52 Wk Lows |
27 |
|
|
 |
Losses With Below Average Volume Erased the Week's Gains
Kenneth J. Gruneisen - Passed the CAN SLIM® Master's Exam
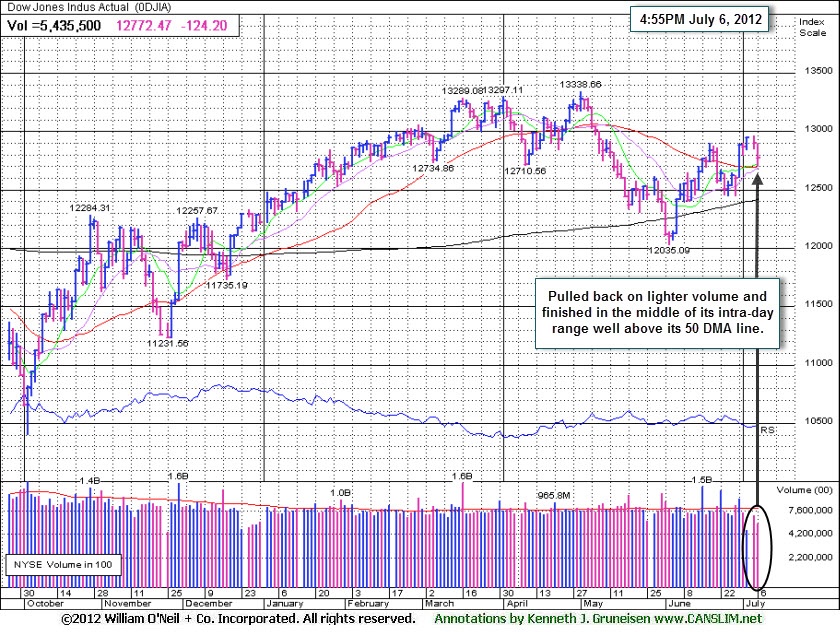
For the week, the Dow Jones Industrial Average fell -0.8%, the S&P 500 Index lost -0.5%, and the Nasdaq Composite Index posted a modest +0.1% gain. On Friday's session the indices suffered losses which easily erased the week's earlier gains, yet stocks finished the session well above their lows. The volume total on the NYSE was lighter and the Nasdaq exchange's volume was near the prior session total, with both totals coming in well below average, not a worrisome sign of institutional selling. Breadth was negative as decliners led advancers by more than a 2-1 ratio on the NYSE and on the Nasdaq exchange. The total number of new 52-week highs led new 52-week lows on the NYSE and on the Nasdaq exchange while the new lows total remained in the single digits on the NYSE. There were 18 high-ranked companies from the CANSLIM.net Leaders List made new 52-week highs and appeared on the CANSLIM.net BreakOuts Page, down abruptly from the prior session total of 79 stocks. At Friday's close there were gains for only 2 of the 20 high-ranked companies currently included on the Featured Stocks Page, a decisively negative tally compared to the broader market.
Stocks lost ground after the June non farm payrolls report showed 80,000 jobs were added last month, missing the street's estimate for a 100,000 gain. In addition, private employment increased by the weakest margin in 10 months and the unemployment rate held steady at 8.2%. Euro zone concerns also weighed on markets as the IMF's Managing Director voiced concern over a slowdown in developed and emerging economies. Meanwhile, Spain's borrowing costs rose closer to unsustainable levels after the country's industrial output fell for the ninth straight month in May.
With the risk-trade off, financials paced early declines while Citigroup Inc (C -1.79%) and Bank of America Corp (BAC -2.05%) lost ground. Energy was also a laggard due to a slump in crude oil prices, which pushed Halliburton Corp (HAL -0.88%) and Chevron Corp (CVX -0.91%) down. Over in tech, Seagate Technology Plc (STX -0.50%) declined after saying it expects to miss its fourth-quarter revenue estimates.
The market's pullback came with lighter volume following considerable volume-driven gains for the major averages coupled with a huge expansion in leadership (stocks making new 52-week highs). The recently reconfirmed upward trend concerning the M criteria signaled to investors that new buying efforts are now encouraged under the fact-based system. Action may only be justified in worthy buy candidates with strong fundamental and technical characteristics matching all key investment criteria. As always, disciplined investors avoid chasing extended stocks, and they limit losses if any stock ever falls more than -7% from its purchase price. The best buy candidates identified by CANSLIM.net's experts are always viewable on the Featured Stocks page.
The Q2 2012 WEBCAST is available "ON DEMAND" - CLICK HERE. Upgraded members now get access to these informative *Quarterly Webcasts included at no additional cost. (*Previously sold separately at $99 per webcast.) Links to archived webcasts and all prior reports are on the Premium Member Homepage.
PICTURED: The Dow Jones Industrial Average pulled back on lighter volume and finished Friday's session in the middle of its intra-day range well above its 50-day moving average (DMA) line.
|
 Kenneth J. Gruneisen started out as a licensed stockbroker in August 1987, a couple of months prior to the historic stock market crash that took the Dow Jones Industrial Average down -22.6% in a single day. He has published daily fact-based fundamental and technical analysis on high-ranked stocks online for two decades. Through FACTBASEDINVESTING.COM, Kenneth provides educational articles, news, market commentary, and other information regarding proven investment systems that work in good times and bad.
Comments contained in the body of this report are technical opinions only and are not necessarily those of Gruneisen Growth Corp. The material herein has been obtained from sources believed to be reliable and accurate, however, its accuracy and completeness cannot be guaranteed. Our firm, employees, and customers may effect transactions, including transactions contrary to any recommendation herein, or have positions in the securities mentioned herein or options with respect thereto. Any recommendation contained in this report may not be suitable for all investors and it is not to be deemed an offer or solicitation on our part with respect to the purchase or sale of any securities. |
|
 |
Retail Index Avoids Setback While Consolidating Above 50 DMA
Kenneth J. Gruneisen - Passed the CAN SLIM® Master's Exam
Tech stocks took a beating on Friday as the Networking Index ($NWX -3.50%), Semiconductor Index ($SOX -2.50%), and Internet Index ($IIX -2.08%) fell hardest, followed by the Biotechnology Index ($BTK -1.05%). Energy-related groups also slumped as the Oil Services Index ($OSX -1.47%) and Integrated Oil Index ($XOI -1.13%) ended with losses. The Broker/Dealer Index ($XBD -1.14%) and Bank Index ($BKX -0.75%) also weighed negatively on the major averages with small losses, meanwhile the Retail Index ($RLX -0.09%) held its ground. The Gold & Silver Index ($XAU -2.80%) was another big decliner as defensive groups provided no reward for safe haven investors. The Healthcare Index ($HMO -0.65%) edged lower, also sputtering near a 2012 low.
Charts courtesy www.stockcharts.com

PICTURED: The Retail Index ($RLX -0.09%) is consolidating above its 50-day moving average (DMA) line. Prior lows define a chart support area above its linger-term 200 DMA line.
| Oil Services |
$OSX |
202.62 |
-3.03 |
-1.47% |
-6.32% |
| Healthcare |
$HMO |
2,170.75 |
-14.10 |
-0.65% |
-4.86% |
| Integrated Oil |
$XOI |
1,159.52 |
-13.31 |
-1.13% |
-5.66% |
| Semiconductor |
$SOX |
376.04 |
-9.64 |
-2.50% |
+3.18% |
| Networking |
$NWX |
206.77 |
-7.51 |
-3.50% |
-3.90% |
| Internet |
$IIX |
298.83 |
-6.36 |
-2.08% |
+6.07% |
| Broker/Dealer |
$XBD |
86.32 |
-0.99 |
-1.14% |
+3.66% |
| Retail |
$RLX |
618.27 |
-0.58 |
-0.09% |
+18.17% |
| Gold & Silver |
$XAU |
157.41 |
-4.53 |
-2.80% |
-12.86% |
| Bank |
$BKX |
45.19 |
-0.34 |
-0.75% |
+14.75% |
| Biotech |
$BTK |
1,490.39 |
-15.81 |
-1.05% |
+36.55% |
|
|
|
 |
Prior Highs Define Initial Support Level Following Breakout
Kenneth J. Gruneisen - Passed the CAN SLIM® Master's Exam
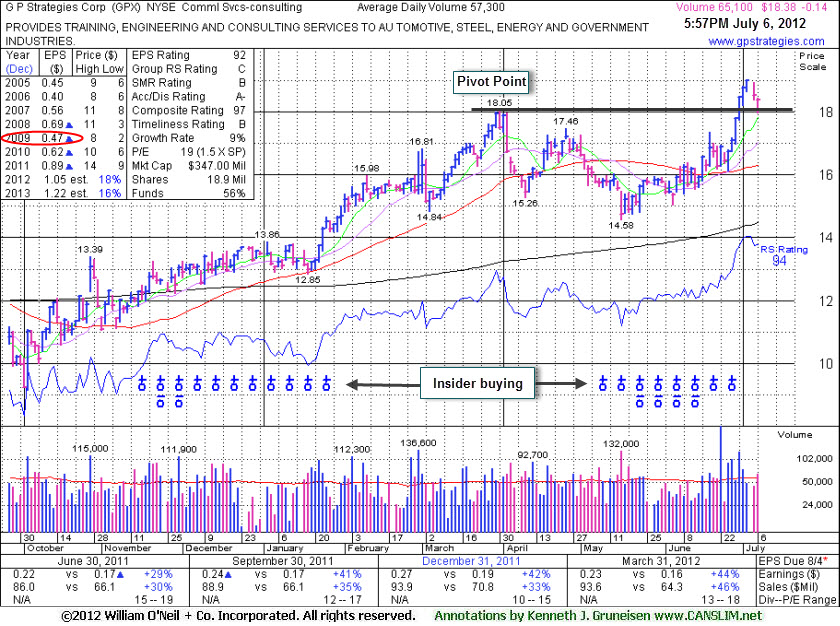
Often, when a leading stock is setting up to breakout of a solid base it is highlighted in CANSLIM.net's Mid-Day Breakouts Report. The most relevant factors are noted in the report which alerts prudent CANSLIM oriented investors to place the issue in their watch list. After doing any necessary backup research, the investor is prepared to act after the stock triggers a technical buy signal (breaks above its pivot point on more than +50% average turnover) but before it gets too extended from a sound base. In the event the stock fails to trigger a technical buy signal and its price declines then it will simply be removed from the watch list. Disciplined investors know to buy as near as possible to the pivot point and avoid chasing stocks after they have rallied more than +5% above their pivot point. It is crucial to always limit losses whenever any stock heads the wrong direction, and disciplined investors sell if a struggling stock ever falls more than -7% from their purchase price.
G P Strategies Corp (GPX -$0.14 or -0.76% to $18.38) finished in the upper third of its intra-day range today with a small loss, action which suggests that it was finding support. Prior highs define an initial support level to watch following a technical breakout. Disciplined investors always limit losses if ever any stock falls more than -7% from its purchase price.
There was a 6 session winning streak that lifted it into new high territory. Its 7/02/12 gain above the pivot point with above average volume was noted as it triggered a technical buy signal. The stock was highlighted in yellow in the 6/29/12 mid-day report (read here) and noted - "It cleared a valid base earlier this week with volume-driven gains and no overhead supply remains. Quarterly earnings increases above the +25% guideline in the 8 latest quarterly comparisons through Dec '11 satisfy the C criteria. Recent cluster of Insider buying in May-Jun looks similar to that which was reported in Nov, Dec, and Jan as it rose toward and above prior resistance in the $14 area. Prior reports cautioned - 'Recent quarterly comparisons show improving sales revenues and earnings increases but its annual earnings (A criteria) history falls below the investment system's guidelines.'"
The current Up/Down Volume Ratio of 1.2 hints that its shares have been under accumulation during the past 50 days. Company management reportedly owns 23% of its shares, which keeps the directors keenly focused on building and maintaining shareholder value.
|
|
|
Color Codes Explained :
Y - Better candidates highlighted by our
staff of experts.
G - Previously featured
in past reports as yellow but may no longer be buyable under the
guidelines.
***Last / Change / Volume data in this table is the closing quote data***
Symbol/Exchange
Company Name
Industry Group |
PRICE |
CHANGE
(%Change) |
Day High |
Volume
(% DAV)
(% 50 day avg vol) |
52 Wk Hi
% From Hi |
Featured
Date |
Price
Featured |
Pivot Featured |
|
Max Buy |
ALXN
-
NASDAQ
Alexion Pharmaceuticals
DRUGS - Drug Manufacturers - Other
|
$101.25
|
-2.14
-2.07% |
$103.85
|
1,101,782
50.25% of 50 DAV
50 DAV is 2,192,500
|
$104.38
-3.00%
|
5/1/2012
|
$91.73
|
PP = $95.11
|
|
MB = $99.87
|
Most Recent Note - 7/2/2012 4:13:39 PM
G - Gain with near average volume today led to a rally above its "max buy" level and its color code is changed to green. Prior highs in the $95 area define support to watch on pullbacks.
>>> The latest Featured Stock Update with an annotated graph appeared on 6/29/2012. Click here.
View all notes |
Alert me of new notes |
CANSLIM.net Company Profile |
SEC |
Zacks Reports |
StockTalk |
News |
Chart |
Request a new note
C
A N
S L
I M


|
ASPS
-
NASDAQ
Altisource Ptf Sltns Sa
REAL ESTATE - Property Management/Developmen
|
$74.44
|
-0.55
-0.73% |
$75.47
|
59,542
44.17% of 50 DAV
50 DAV is 134,800
|
$76.20
-2.31%
|
6/5/2012
|
$60.01
|
PP = $63.00
|
|
MB = $66.15
|
Most Recent Note - 7/3/2012 1:59:50 PM
G - Holding its ground near its 52-week high, extended from its prior base. Prior highs in the $65 area define support to watch on pullbacks. See the latest FSU analysis for more details and a new annotated graph.
>>> The latest Featured Stock Update with an annotated graph appeared on 7/3/2012. Click here.
View all notes |
Alert me of new notes |
CANSLIM.net Company Profile |
SEC |
Zacks Reports |
StockTalk |
News |
Chart |
Request a new note
C
A N
S L
I M
|
CERN
-
NASDAQ
Cerner Corp
COMPUTER SOFTWARE and SERVICES - Healthcare Information Service
|
$82.02
|
-0.95
-1.14% |
$83.18
|
1,450,379
92.98% of 50 DAV
50 DAV is 1,559,900
|
$88.32
-7.13%
|
6/7/2012
|
$78.36
|
PP = $84.20
|
|
MB = $88.41
|
Most Recent Note - 7/5/2012 3:59:24 PM
G - Holding its ground since rebounding back above its 50 DMA line helping its technical stance. It has not formed a proper base since negating its prior breakout.
>>> The latest Featured Stock Update with an annotated graph appeared on 6/7/2012. Click here.
View all notes |
Alert me of new notes |
CANSLIM.net Company Profile |
SEC |
Zacks Reports |
StockTalk |
News |
Chart |
Request a new note
C
A N
S L
I M
|
CMCSA
-
NASDAQ
Comcast Corp Cl A
MEDIA - CATV Systems
|
$31.36
|
-0.09
-0.29% |
$31.82
|
10,373,237
73.53% of 50 DAV
50 DAV is 14,106,800
|
$32.50
-3.51%
|
6/11/2012
|
$29.94
|
PP = $30.98
|
|
MB = $32.53
|
Most Recent Note - 7/5/2012 1:06:14 PM
Y - Quietly consolidating near its 52-week high today. No overhead supply remains to act as resistance and it is still trading below its "max buy" level.
>>> The latest Featured Stock Update with an annotated graph appeared on 6/11/2012. Click here.
View all notes |
Alert me of new notes |
CANSLIM.net Company Profile |
SEC |
Zacks Reports |
StockTalk |
News |
Chart |
Request a new note
C
A N
S L
I M
|
CSTR
-
NASDAQ
Coinstar Inc
DIVERSIFIED SERVICES - Personal Services
|
$70.93
|
-0.17
-0.24% |
$71.10
|
692,935
63.26% of 50 DAV
50 DAV is 1,095,300
|
$71.82
-1.24%
|
6/26/2012
|
$64.05
|
PP = $67.00
|
|
MB = $70.35
|
Most Recent Note - 7/3/2012 1:54:48 PM
G - Hit another new 52-week high today and finished above its "max buy" level. Color code is changed to green while getting extended from its prior base.
>>> The latest Featured Stock Update with an annotated graph appeared on 6/26/2012. Click here.
View all notes |
Alert me of new notes |
CANSLIM.net Company Profile |
SEC |
Zacks Reports |
StockTalk |
News |
Chart |
Request a new note
C
A N
S L
I M
|
Symbol/Exchange
Company Name
Industry Group |
PRICE |
CHANGE
(%Change) |
Day High |
Volume
(% DAV)
(% 50 day avg vol) |
52 Wk Hi
% From Hi |
Featured
Date |
Price
Featured |
Pivot Featured |
|
Max Buy |
DG
-
NYSE
Dollar General Corp
RETAIL - Discount, Variety Stores
|
$54.59
|
+0.30
0.55% |
$55.05
|
1,916,925
49.64% of 50 DAV
50 DAV is 3,861,400
|
$55.30
-1.28%
|
5/7/2012
|
$48.51
|
PP = $47.69
|
|
MB = $50.07
|
Most Recent Note - 7/5/2012 4:00:34 PM
G - Posted a small gain today with average volume, hovering near its all-time high, extended from its prior base. Completed another Secondary Offering on 6/05/12, its 4th Secondary Offering since September '11.
>>> The latest Featured Stock Update with an annotated graph appeared on 6/12/2012. Click here.
View all notes |
Alert me of new notes |
CANSLIM.net Company Profile |
SEC |
Zacks Reports |
StockTalk |
News |
Chart |
Request a new note
C
A N
S L
I M
|
ECHO
-
NASDAQ
Echo Global Logistics
DIVERSIFIED SERVICES - Business/Management Services
|
$18.57
|
+0.00
0.00% |
$18.64
|
69,945
61.14% of 50 DAV
50 DAV is 114,400
|
$19.48
-4.67%
|
6/22/2012
|
$18.98
|
PP = $19.48
|
|
MB = $20.45
|
Most Recent Note - 7/3/2012 11:04:37 AM
Y - Trading in the upper half of its intra-day range, rebounding from early lows after gapping down today for a damaging loss. A volume-driven gain on the prior session led to a close just 3 cents below its pivot point, almost triggering a technical buy signal under the fact-based system.
>>> The latest Featured Stock Update with an annotated graph appeared on 6/22/2012. Click here.
View all notes |
Alert me of new notes |
CANSLIM.net Company Profile |
SEC |
Zacks Reports |
StockTalk |
News |
Chart |
Request a new note
C
A N
S L
I M
|
EXPE
-
NASDAQ
Expedia Inc
INTERNET - Internet Information Providers
|
$47.72
|
-0.61
-1.26% |
$48.70
|
2,075,076
44.31% of 50 DAV
50 DAV is 4,682,700
|
$50.66
-5.80%
|
4/27/2012
|
$41.80
|
PP = $35.57
|
|
MB = $37.35
|
Most Recent Note - 7/2/2012 4:16:24 PM
G - Rallying further above its 50 DMA line, it finished -2.9% off its 52-week high with a gain on below average volume today. It is extended from its prior highs in the $43 area and its 50 DMA line which define support.
>>> The latest Featured Stock Update with an annotated graph appeared on 6/8/2012. Click here.
View all notes |
Alert me of new notes |
CANSLIM.net Company Profile |
SEC |
Zacks Reports |
StockTalk |
News |
Chart |
Request a new note
C
A N
S L
I M
|
GNC
-
NYSE
G N C Holdings Inc
RETAIL - Drug Stores
|
$42.14
|
-0.29
-0.68% |
$42.38
|
1,005,531
40.93% of 50 DAV
50 DAV is 2,456,700
|
$42.70
-1.31%
|
6/29/2012
|
$39.20
|
PP = $40.00
|
|
MB = $42.00
|
Most Recent Note - 7/5/2012 4:40:06 PM
G - Color code is changed to green after today's 7th consecutive gain lifted it above the "max buy" level. Its 7/02/12 gain above the pivot point triggered a new (or add-on) technical buy signal. See the latest FSU analysis for more details and a new annotated graph.
>>> The latest Featured Stock Update with an annotated graph appeared on 7/5/2012. Click here.
View all notes |
Alert me of new notes |
CANSLIM.net Company Profile |
SEC |
Zacks Reports |
StockTalk |
News |
Chart |
Request a new note
C
A N
S L
I M
|
GPX
-
NYSE
G P Strategies Corp
DIVERSIFIED SERVICES - Education and Training Services
|
$18.38
|
-0.14
-0.76% |
$18.43
|
65,115
113.64% of 50 DAV
50 DAV is 57,300
|
$18.99
-3.21%
|
6/29/2012
|
$18.01
|
PP = $18.15
|
|
MB = $19.06
|
 Most Recent Note - 7/6/2012 6:16:01 PM
Y - Finished in the upper part of its intra-day range today, consolidating above prior highs which define an initial support level. See the latest FSU analysis for more details and a new annotated graph.
>>> The latest Featured Stock Update with an annotated graph appeared on 7/6/2012. Click here.
View all notes |
Alert me of new notes |
CANSLIM.net Company Profile |
SEC |
Zacks Reports |
StockTalk |
News |
Chart |
Request a new note
C
A N
S L
I M
|
Symbol/Exchange
Company Name
Industry Group |
PRICE |
CHANGE
(%Change) |
Day High |
Volume
(% DAV)
(% 50 day avg vol) |
52 Wk Hi
% From Hi |
Featured
Date |
Price
Featured |
Pivot Featured |
|
Max Buy |
MLNX
-
NASDAQ
Mellanox Technologies
ELECTRONICS - Semiconductor - Broad Line
|
$73.72
|
-3.10
-4.04% |
$75.98
|
613,452
104.61% of 50 DAV
50 DAV is 586,400
|
$77.69
-5.11%
|
6/18/2012
|
$70.90
|
PP = $67.30
|
|
MB = $70.67
|
Most Recent Note - 7/6/2012 6:27:40 PM
G - Pulled back today on average volume from its all-time high after getting extended from its prior base with a spurt of volume-driven gains. Recent chart lows define near-term support to watch above its 50 DMA line.
>>> The latest Featured Stock Update with an annotated graph appeared on 6/25/2012. Click here.
View all notes |
Alert me of new notes |
CANSLIM.net Company Profile |
SEC |
Zacks Reports |
StockTalk |
News |
Chart |
Request a new note
C
A N
S L
I M
|
N
-
NYSE
Netsuite Inc
DIVERSIFIED SERVICES - Business/Management Services
|
$53.72
|
-1.27
-2.31% |
$54.44
|
554,384
100.78% of 50 DAV
50 DAV is 550,100
|
$56.06
-4.17%
|
6/20/2012
|
$51.83
|
PP = $51.88
|
|
MB = $54.47
|
Most Recent Note - 7/6/2012 6:24:51 PM
Y - Pulled back below its "max buy" level today with a loss on average volume, and its color code is changed to yellow. No resistance remains due to overhead supply.
>>> The latest Featured Stock Update with an annotated graph appeared on 6/20/2012. Click here.
View all notes |
Alert me of new notes |
CANSLIM.net Company Profile |
SEC |
Zacks Reports |
StockTalk |
News |
Chart |
Request a new note
C
A N
S L
I M
|
NSM
-
NYSE
Nationstar Mtg Hldgs Inc
FINANCIAL SERVICES - Credit Services
|
$24.24
|
+0.12
0.50% |
$24.55
|
795,879
103.83% of 50 DAV
50 DAV is 766,500
|
$24.33
-0.37%
|
6/27/2012
|
$20.29
|
PP = $20.46
|
|
MB = $21.48
|
Most Recent Note - 7/5/2012 4:01:18 PM
G - Hit yet another new 52-week high today with a 6th consecutive gain, getting more extended from its prior base. Prior highs in the $20 area define important support to watch on pullbacks.
>>> The latest Featured Stock Update with an annotated graph appeared on 6/27/2012. Click here.
View all notes |
Alert me of new notes |
CANSLIM.net Company Profile |
SEC |
Zacks Reports |
StockTalk |
News |
Chart |
Request a new note
C
A N
S L
I M
|
NTES
-
NASDAQ
Netease Inc Adr
INTERNET - Internet Information Providers
|
$60.06
|
-1.32
-2.15% |
$60.87
|
472,824
63.88% of 50 DAV
50 DAV is 740,200
|
$65.54
-8.36%
|
3/19/2012
|
$56.18
|
PP = $55.10
|
|
MB = $57.86
|
Most Recent Note - 7/5/2012 1:02:24 PM
G - Rebounding above its 50 DMA line with today's gain, helping its technical stance and outlook improve. Found support near prior lows in the $55 area.
>>> The latest Featured Stock Update with an annotated graph appeared on 6/19/2012. Click here.
View all notes |
Alert me of new notes |
CANSLIM.net Company Profile |
SEC |
Zacks Reports |
StockTalk |
News |
Chart |
Request a new note
C
A N
S L
I M
|
SWI
-
NYSE
Solarwinds Inc
COMPUTER SOFTWARE and SERVICES - Application Software
|
$42.61
|
-2.67
-5.90% |
$44.68
|
942,545
86.50% of 50 DAV
50 DAV is 1,089,600
|
$48.64
-12.40%
|
4/26/2012
|
$45.15
|
PP = $42.32
|
|
MB = $44.44
|
Most Recent Note - 7/6/2012 6:19:06 PM
G - Damaging loss today on near average volume led to a close well below its 50 DMA line. Gains above that short-term average are needed to help its technical stance. The previously noted 6/04/11 low ($41.24) defines important support to watch.
>>> The latest Featured Stock Update with an annotated graph appeared on 6/15/2012. Click here.
View all notes |
Alert me of new notes |
CANSLIM.net Company Profile |
SEC |
Zacks Reports |
StockTalk |
News |
Chart |
Request a new note
C
A N
S L
I M
|
Symbol/Exchange
Company Name
Industry Group |
PRICE |
CHANGE
(%Change) |
Day High |
Volume
(% DAV)
(% 50 day avg vol) |
52 Wk Hi
% From Hi |
Featured
Date |
Price
Featured |
Pivot Featured |
|
Max Buy |
SXCI
-
NASDAQ
S X C Health Solutions
COMPUTER SOFTWARE and SERVICES - Healthcare Information Service
|
$95.41
|
-0.96
-1.00% |
$97.00
|
1,429,788
122.39% of 50 DAV
50 DAV is 1,168,200
|
$104.79
-8.95%
|
6/14/2012
|
$94.71
|
PP = $100.60
|
|
MB = $105.63
|
Most Recent Note - 7/5/2012 12:39:46 PM
Y - Churning above average volume today while off the session's earlier highs above its pivot point. Reversed and closed in the red after trading up on the 2 prior sessions, and the "negative reversals" were noted as signs of distributional pressure. No resistance remains due to overhead supply, and strong close above its pivot point may clinch a technical buy signal.
>>> The latest Featured Stock Update with an annotated graph appeared on 6/14/2012. Click here.
View all notes |
Alert me of new notes |
CANSLIM.net Company Profile |
SEC |
Zacks Reports |
StockTalk |
News |
Chart |
Request a new note
C
A N
S L
I M
|
TDG
-
NYSE
Transdigm Group Inc
AEROSPACE/DEFENSE - Aerospace/Defense Products and; Services
|
$130.88
|
-2.80
-2.09% |
$132.82
|
265,502
47.40% of 50 DAV
50 DAV is 560,100
|
$136.34
-4.00%
|
6/18/2012
|
$127.00
|
PP = $132.79
|
|
MB = $139.43
|
Most Recent Note - 7/5/2012 1:08:51 PM
Y - Holding its ground since last noted when its 6/29/12 gain above its pivot point was backed by only +32% above average volume, below the minimum threshold need to trigger a proper new (or add-on) technical buy signal. Its 50 DMA line defines important support to watch.
>>> The latest Featured Stock Update with an annotated graph appeared on 6/18/2012. Click here.
View all notes |
Alert me of new notes |
CANSLIM.net Company Profile |
SEC |
Zacks Reports |
StockTalk |
News |
Chart |
Request a new note
C
A N
S L
I M
|
TNGO
-
NASDAQ
Tangoe Inc
COMPUTER SOFTWARE and SERVICES - Technical and System Software
|
$21.43
|
-0.74
-3.34% |
$21.95
|
322,656
60.20% of 50 DAV
50 DAV is 536,000
|
$23.05
-7.03%
|
6/27/2012
|
$21.70
|
PP = $23.15
|
|
MB = $24.31
|
Most Recent Note - 7/6/2012 6:21:45 PM
Y - Pulled back near its 50 DMA line with a loss on light volume today. Gains above the pivot point backed by +40% above average volume or greater could trigger a new technical buy signal.
>>> The latest Featured Stock Update with an annotated graph appeared on 6/28/2012. Click here.
View all notes |
Alert me of new notes |
CANSLIM.net Company Profile |
SEC |
Zacks Reports |
StockTalk |
News |
Chart |
Request a new note
C
A N
S L
I M
|
VSI
-
NYSE
Vitamin Shoppe Inc
SPECIALTY RETAIL - Specialty Retail, Other
|
$55.94
|
-0.81
-1.43% |
$56.53
|
194,672
37.96% of 50 DAV
50 DAV is 512,800
|
$57.52
-2.74%
|
6/29/2012
|
$54.93
|
PP = $55.03
|
|
MB = $57.78
|
Most Recent Note - 7/2/2012 5:24:43 PM
Y - Gain today with below average volume led to its best-ever close and a new 52-week high above the new pivot point cited based on its 6/22/12 high after forming an 8-week cup-with-handle base. Volume was not sufficient to trigger a proper new (or add-on) technical buy signal. See the latest FSU analysis for more details and a new annotated graph.
>>> The latest Featured Stock Update with an annotated graph appeared on 7/2/2012. Click here.
View all notes |
Alert me of new notes |
CANSLIM.net Company Profile |
SEC |
Zacks Reports |
StockTalk |
News |
Chart |
Request a new note
C
A N
S L
I M
|
WFM
-
NASDAQ
Whole Foods Market Inc
RETAIL - Grocery Stores
|
$95.08
|
-1.21
-1.26% |
$95.99
|
1,022,527
50.56% of 50 DAV
50 DAV is 2,022,400
|
$97.25
-2.23%
|
6/13/2012
|
$89.90
|
PP = $91.60
|
|
MB = $96.18
|
Most Recent Note - 7/5/2012 1:12:05 PM
G - Color code is changed to green after inching above its "max buy" level. Recently hovering near its 52-week high with no resistance remaining due to overhead supply. Its prior highs in the $91.50 area define initial support to watch on pullbacks.
>>> The latest Featured Stock Update with an annotated graph appeared on 6/13/2012. Click here.
View all notes |
Alert me of new notes |
CANSLIM.net Company Profile |
SEC |
Zacks Reports |
StockTalk |
News |
Chart |
Request a new note
C
A N
S L
I M
|
Symbol/Exchange
Company Name
Industry Group |
PRICE |
CHANGE
(%Change) |
Day High |
Volume
(% DAV)
(% 50 day avg vol) |
52 Wk Hi
% From Hi |
Featured
Date |
Price
Featured |
Pivot Featured |
|
Max Buy |
|
|
|
THESE ARE NOT BUY RECOMMENDATIONS!
Comments contained in the body of this report are technical
opinions only. The material herein has been obtained
from sources believed to be reliable and accurate, however,
its accuracy and completeness cannot be guaranteed.
This site is not an investment advisor, hence it does
not endorse or recommend any securities or other investments.
Any recommendation contained in this report may not
be suitable for all investors and it is not to be deemed
an offer or solicitation on our part with respect to
the purchase or sale of any securities. All trademarks,
service marks and trade names appearing in this report
are the property of their respective owners, and are
likewise used for identification purposes only.
This report is a service available
only to active Paid Premium Members.
You may opt-out of receiving report notifications
at any time. Questions or comments may be submitted
by writing to Premium Membership Services 665 S.E. 10 Street, Suite 201 Deerfield Beach, FL 33441-5634 or by calling 1-800-965-8307
or 954-785-1121.
|
|
|

