You are not logged in.
This means you
CAN ONLY VIEW reports that were published prior to Monday, April 14, 2025.
You
MUST UPGRADE YOUR MEMBERSHIP if you want to see any current reports.
AFTER MARKET UPDATE - TUESDAY, JULY 6TH, 2010
Previous After Market Report Next After Market Report >>>
|
|
|
|
DOW |
+57.14 |
9,743.62 |
+0.59% |
|
Volume |
1,316,776,840 |
+19% |
|
Volume |
2,078,199,000 |
+29% |
|
NASDAQ |
+2.09 |
2,093.88 |
+0.10% |
|
Advancers |
1,501 |
48% |
|
Advancers |
909 |
33% |
|
S&P 500 |
+5.48 |
1,028.06 |
+0.54% |
|
Decliners |
1,543 |
49% |
|
Decliners |
1,792 |
64% |
|
Russell 2000 |
-8.94 |
590.03 |
-1.49% |
|
52 Wk Highs |
59 |
|
|
52 Wk Highs |
14 |
|
|
S&P 600 |
-4.73 |
318.17 |
-1.46% |
|
52 Wk Lows |
93 |
|
|
52 Wk Lows |
183 |
|
|
 |
Volume Increased But Remained Below Average Behind Indices' Small Gains
Adam Sarhan, Contributing Writer,
As expected, Tuesday's volume totals were reported higher on the NYSE and the Nasdaq exchange compared to Friday's pre-holiday levels. The major averages marked Day 1 of a new rally attempt but they ended well off Tuesday's session highs. The small-cap indexes lagged behind their big-cap peers. Disappointing news for the service sector created a drag on stocks. Advancers led decliners by almost a 2-to-1 ratio on the Nasdaq exchange but the mix was nearly even on the NYSE. There were only 8 high-ranked companies from the CANSLIM.net Leaders List that made a new 52-week high and appeared on the CANSLIM.net BreakOuts Page, higher than the 5 issues that appeared on the prior session. Meanwhile, new 52-week lows outnumbered new 52-week highs on the NYSE and the Nasdaq exchange. It will be important for leadership to expand if the new rally effort will prove to be a sustained market advance.
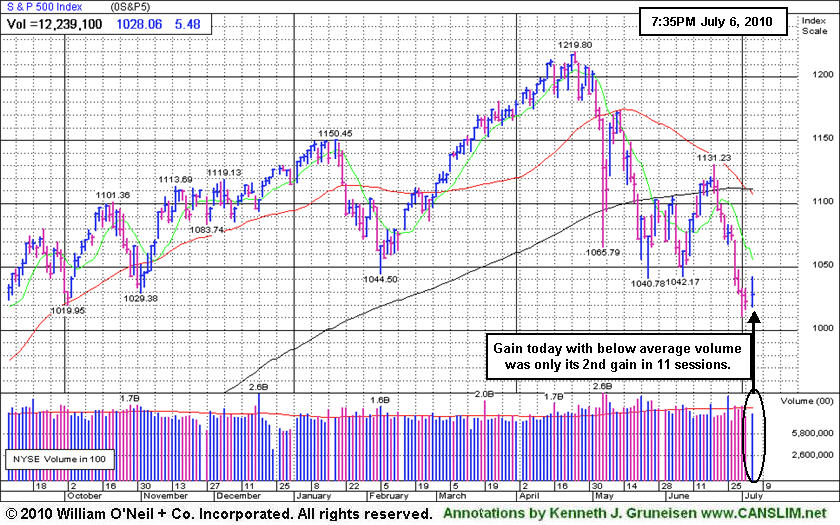
US stocks opened higher after strong gains from Asia and Europe sparked optimism that an oversold technical bounce may occur. Economic news was less than stellar, the ISM service index grew at a slower than expected rate in June which led many to question the health of the ongoing global economic recovery. Interestingly, the benchmark S&P 500 index rallied right up the 1,040 area before encountering resistance and closing near its lows for the day. It is important to note that for most of 2010, the 1,040 level has been important support and it has now become a level of resistance. That said, the bears remain in control until that the S&P 500 closes above that important level.
The market remains in a correction, which emphasizes the importance of raising cash and adopting a strong defensive stance until a new follow-through day emerges. For the past several weeks, this column has steadily noted the importance of remaining very selective and disciplined because all of the major averages are still trading below their downward sloping 50-day moving average (DMA) lines. Their 50 DMA line may continue to act as stubborn resistance. It was recently noted that the NYSE Composite saw its 50 DMA line already slice below its 200 DMA line, an event known by market technicians as a "death cross" which usually has bearish implications. The benchmark S&P 500 Index has now followed it up with its own death cross. Trade accordingly.
Q2 Webcast Rewind: The Q2 2010 CANSLIM.net Webcast aired at 8PM on Wednesday, June 30, 2010. A link to the webcast has been added near the top on the Premium Membership Homepage which will allow all who have UPGRADED with a currently active premium (paid) membership to view the webcast ON DEMAND at any time. To UPGRADE now for access to the webcast and all premium reports CLICK HERE.
PICTURED: The S&P 500 Index's gain with below average volume was only its 2nd gain in 11 sessions. The benchmark index saw its 50 DMA line slice below its 200 DMA line, a bearish sign.
|
|
|
 |
Financial Groups' Gains Helped Major Averages End Session Higher
Kenneth J. Gruneisen - Passed the CAN SLIM® Master's Exam
Tuesday's gains from the influential Broker/Dealer Index ($XBD +0.73%) and Bank Index ($BKX +1.20%) helped to produce small gains for the major averages. Energy-related shares also traded up as the Oil Services Index ($OSX +0.55%) and Integrated Oil Index ($XOI +1.35%) rose, and the Healthcare Index ($HMO +0.24%) posted a small gain. The Networking Index ($NWX +0.28%) and Internet Index ($IIX +0.32%) posted modest gains while the Semiconductor Index ($SOX -0.14%) edged lower and the Biotechnology Index ($BTK -1.15%) was a laggard in the tech sector. The Gold & Silver Index ($XAU -0.82%) slumped and the Retail Index ($RLX -0.55%) also sank.
Charts courtesy www.stockcharts.com
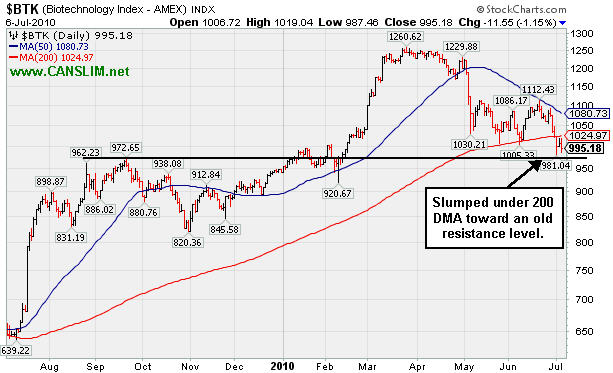
PICTURED: The Biotechnology Index ($BTK -1.15%) has slumped under its 200-day moving average (DMA) line toward an old chart resistance level.
| Oil Services |
$OSX |
166.39 |
+0.91 |
+0.55% |
-14.64% |
| Healthcare |
$HMO |
1,375.29 |
+3.30 |
+0.24% |
-6.63% |
| Integrated Oil |
$XOI |
891.28 |
+11.90 |
+1.35% |
-16.56% |
| Semiconductor |
$SOX |
331.15 |
-0.45 |
-0.14% |
-7.99% |
| Networking |
$NWX |
215.72 |
+0.60 |
+0.28% |
-6.64% |
| Internet |
$IIX |
220.01 |
+0.70 |
+0.32% |
-5.92% |
| Broker/Dealer |
$XBD |
96.48 |
+0.70 |
+0.73% |
-16.14% |
| Retail |
$RLX |
383.67 |
-2.11 |
-0.55% |
-6.68% |
| Gold & Silver |
$XAU |
168.37 |
-1.39 |
-0.82% |
+0.07% |
| Bank |
$BKX |
45.51 |
+0.54 |
+1.20% |
+6.56% |
| Biotech |
$BTK |
995.18 |
-11.55 |
-1.15% |
+5.63% |
|
|
|
 |
Weak Finish Today After Mid-Day Report Appearance in Yellow
Kenneth J. Gruneisen - Passed the CAN SLIM® Master's Exam
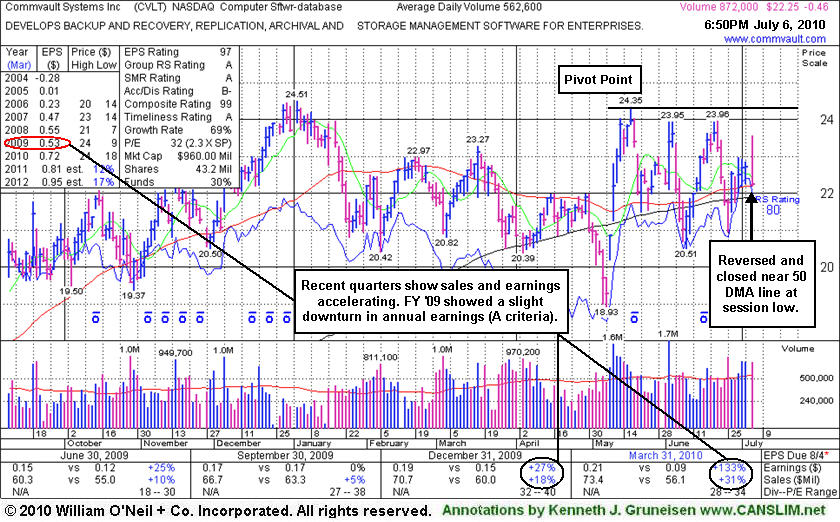
Commvault Systems Inc (CVLT -$0.46 or -2.03% to $22.25) gapped up today and then negatively reversed, closing near the session low and near its 50-day moving average (DMA) line. It is still building on the right side of a 6-month flat base, perched within close striking distance of its 52-week high and all-time high. It was featured in the mid-day report today (read here) as its color code was changed to yellow with its pivot point based on its 5/18/10 high plus ten cents.
The high-ranked Computer Software - Database firm's annual earnings (A criteria) history includes a slight downward turn in FY '09, yet it has an impressive history and recent quarters showed accelerating sales revenues and earnings increases with +25% earnings increases or greater in 3 out of the past 4 comparisons versus the year ago period. It is an ideal candidate for disciplined investors' watch lists while they are awaiting a new confirmed rally with a proper follow-through day from at least one of the major averages (M criteria). Years ago it was featured as an ideal candidate, but due to weakness on 1/31/07 it was removed from the CANSLIM.net Featured Stocks list.
|
|
|
Color Codes Explained :
Y - Better candidates highlighted by our
staff of experts.
G - Previously featured
in past reports as yellow but may no longer be buyable under the
guidelines.
***Last / Change / Volume data in this table is the closing quote data***
Symbol/Exchange
Company Name
Industry Group |
PRICE |
CHANGE
(%Change) |
Day High |
Volume
(% DAV)
(% 50 day avg vol) |
52 Wk Hi
% From Hi |
Featured
Date |
Price
Featured |
Pivot Featured |
|
Max Buy |
AAPL
-
NASDAQ
Apple Inc
COMPUTER HARDWARE - Personal Computers
|
$248.63
|
+1.69
0.68% |
$252.80
|
21,946,298
76.24% of 50 DAV
50 DAV is 28,785,800
|
$279.01
-10.89%
|
6/17/2010
|
$270.95
|
PP = $272.56
|
|
MB = $286.19
|
 Most Recent Note - 7/6/2010 4:37:36 PM
G - Small gain on light volume today halted a 4 session losing streak. Traded near prior chart lows in the $242 area last week after violating its 50 DMA line and triggering a technical sell signal. It was featured in the 6/17/10 mid-day report (read here).
>>> The latest Featured Stock Update with an annotated graph appeared on 6/17/2010. Click here.
View all notes |
Alert me of new notes |
CANSLIM.net Company Profile |
SEC |
Zacks Reports |
StockTalk |
News |
Chart |
Request a new note
C
A N
S L
I M


|
ABV
-
NYSE
Comp De Bebidas Adr
FOOD and BEVERAGE - Beverages - Brewers
|
$103.92
|
+1.06
1.03% |
$105.91
|
866,660
118.15% of 50 DAV
50 DAV is 733,500
|
$109.33
-4.95%
|
6/29/2010
|
$104.74
|
PP = $109.33
|
|
MB = $114.80
|
Most Recent Note - 7/6/2010 4:41:26 PM
Y - Brazil-based beverage firm found support near its 50 DMA line last week. Today it traded back above the price when first featured in yellow in the 6/29/10 mid-day report (read here) with a note while - "perched near all-time highs after building an orderly base pattern and finding impressive support near its 200 DMA line in recent months. It has a great annual earnings (A criteria) history and its recent quarterly earnings and sales revenues increases have shown acceleration. A gain above its pivot point with heavy volume still needed to confirm a proper new technical buy signal."
>>> The latest Featured Stock Update with an annotated graph appeared on 6/29/2010. Click here.
View all notes |
Alert me of new notes |
CANSLIM.net Company Profile |
SEC |
Zacks Reports |
StockTalk |
News |
Chart |
Request a new note
C
A N
S L
I M
|
APEI
-
NASDAQ
American Public Educ Inc
DIVERSIFIED SERVICES - Education and Training Services
|
$41.30
|
-0.10
-0.24% |
$42.57
|
194,939
110.45% of 50 DAV
50 DAV is 176,500
|
$48.95
-15.63%
|
6/7/2010
|
$46.60
|
PP = $46.29
|
|
MB = $48.60
|
Most Recent Note - 7/6/2010 4:45:18 PM
G - Slumping near its 200 DMA line and prior lows with its 7th consecutive loss.
>>> The latest Featured Stock Update with an annotated graph appeared on 7/2/2010. Click here.
View all notes |
Alert me of new notes |
CANSLIM.net Company Profile |
SEC |
Zacks Reports |
StockTalk |
News |
Chart |
Request a new note
C
A N
S L
I M
|
BIDU
-
NASDAQ
Baidu Inc Ads
INTERNET - Internet Information Providers
|
$67.45
|
-0.10
-0.15% |
$70.06
|
9,656,365
64.20% of 50 DAV
50 DAV is 15,040,600
|
$82.29
-18.03%
|
1/13/2010
|
$43.13
|
PP = $42.68
|
|
MB = $44.81
|
Most Recent Note - 7/6/2010 4:46:42 PM
G - Still holding its ground today near prior chart lows in the $66 area that define important chart support. It would need to rebound above its 50 DMA line for its outlook to improve.
>>> The latest Featured Stock Update with an annotated graph appeared on 6/21/2010. Click here.
View all notes |
Alert me of new notes |
CANSLIM.net Company Profile |
SEC |
Zacks Reports |
StockTalk |
News |
Chart |
Request a new note
C
A N
S L
I M
|
CISG
-
NASDAQ
Cninsure Inc Ads
INSURANCE - Insurance Brokers
|
$26.78
|
+0.62
2.37% |
$27.67
|
224,139
72.21% of 50 DAV
50 DAV is 310,400
|
$28.62
-6.43%
|
6/16/2010
|
$27.20
|
PP = $27.75
|
|
MB = $29.14
|
Most Recent Note - 7/6/2010 5:36:51 PM
G - Found support near its 50 DMA line recently, and it ended today's session -6.4% off its 52-week high. Featured in the 6/16/10 mid-day report (read here).
>>> The latest Featured Stock Update with an annotated graph appeared on 6/18/2010. Click here.
View all notes |
Alert me of new notes |
CANSLIM.net Company Profile |
SEC |
Zacks Reports |
StockTalk |
News |
Chart |
Request a new note
C
A N
S L
I M
|
Symbol/Exchange
Company Name
Industry Group |
PRICE |
CHANGE
(%Change) |
Day High |
Volume
(% DAV)
(% 50 day avg vol) |
52 Wk Hi
% From Hi |
Featured
Date |
Price
Featured |
Pivot Featured |
|
Max Buy |
CRM
-
NYSE
Salesforce.Com Inc
INTERNET - Internet Software and Services
|
$88.11
|
+1.00
1.15% |
$90.17
|
2,683,196
93.28% of 50 DAV
50 DAV is 2,876,600
|
$97.94
-10.04%
|
6/2/2010
|
$88.44
|
PP = $89.60
|
|
MB = $94.08
|
Most Recent Note - 7/6/2010 5:40:54 PM
G - Consolidating near its 50 DMA line after recent weakness. An upward trendline connecting its February - May lows now defines an important support level.
>>> The latest Featured Stock Update with an annotated graph appeared on 6/22/2010. Click here.
View all notes |
Alert me of new notes |
CANSLIM.net Company Profile |
SEC |
Zacks Reports |
StockTalk |
News |
Chart |
Request a new note
C
A N
S L
I M
|
CVLT
-
NASDAQ
Commvault Systems Inc
COMPUTER SOFTWARE and SERVICES - Business Software and Services
|
$22.25
|
-0.46
-2.03% |
$23.57
|
910,461
161.83% of 50 DAV
50 DAV is 562,600
|
$24.51
-9.22%
|
7/6/2010
|
$23.16
|
PP = $24.45
|
|
MB = $25.67
|
Most Recent Note - 7/6/2010 5:43:07 PM
Y - Building on the right side of a 6-month flat base within close striking distance of its 52-week high and all-time high, it was featured in the mid-day report today (read here). Color code was changed to yellow with its pivot point based on its 5/18/10 high plus ten cents. Its annual earnings (A criteria) history includes a slight downward turn in FY '09, yet it has an impressive history and recent quarters showed accelerating sales revenues and earnings increases with +25% earnings increases or greater in 3 out of the past 4 comparisons versus the year ago period. On 1/31/07 it was removed from the CANSLIM.net Featured Stocks list.
>>> The latest Featured Stock Update with an annotated graph appeared on 7/6/2010. Click here.
View all notes |
Alert me of new notes |
CANSLIM.net Company Profile |
SEC |
Zacks Reports |
StockTalk |
News |
Chart |
Request a new note
C
A N
S L
I M
|
DECK
-
NASDAQ
Deckers Outdoor Corp
CONSUMER NON-DURABLES - Textile - Apparel Footwear
|
$44.43
|
-2.84
-6.01% |
$48.50
|
1,727,099
318.77% of 50 DAV
50 DAV is 541,800
|
$168.52
-73.64%
|
6/11/2010
|
$157.34
|
PP = $158.57
|
|
MB = $166.50
|
Most Recent Note - 7/6/2010 5:45:00 PM
G - Down considerably today as a 3:1 stock split took effect, falling for its 6th consecutive loss, slumping further below its 50 DMA line. Weak market (M criteria) action may be expected to drag 3 out of 4 stocks lower, meanwhile, caution is advised until another new confirmed rally begins.
>>> The latest Featured Stock Update with an annotated graph appeared on 7/1/2010. Click here.
View all notes |
Alert me of new notes |
CANSLIM.net Company Profile |
SEC |
Zacks Reports |
StockTalk |
News |
Chart |
Request a new note
C
A N
S L
I M
|
FFIV
-
NASDAQ
F 5 Networks Inc
INTERNET - Internet Software and Services
|
$70.14
|
+1.49
2.17% |
$72.43
|
1,581,102
94.58% of 50 DAV
50 DAV is 1,671,700
|
$77.10
-9.03%
|
6/16/2010
|
$74.50
|
PP = $74.10
|
|
MB = $77.81
|
Most Recent Note - 7/6/2010 5:47:25 PM
G - Still consolidating near its 50 DMA line. Recent chart low ($66.79 on 7/01/10) now defines a near-term support level to watch.
>>> The latest Featured Stock Update with an annotated graph appeared on 6/16/2010. Click here.
View all notes |
Alert me of new notes |
CANSLIM.net Company Profile |
SEC |
Zacks Reports |
StockTalk |
News |
Chart |
Request a new note
C
A N
S L
I M
|
MELI
-
NASDAQ
Mercadolibre Inc
INTERNET - Internet Software and; Services
|
$53.22
|
+1.09
2.09% |
$55.08
|
707,485
77.71% of 50 DAV
50 DAV is 910,400
|
$62.14
-14.35%
|
5/13/2010
|
$54.21
|
PP = $55.85
|
|
MB = $58.64
|
Most Recent Note - 7/6/2010 5:50:08 PM
G - Consolidating near its 50 DMA line after it fell -10% last week. Its recent low ($49.55 on 7/01/10) now defines near-term chart support.
>>> The latest Featured Stock Update with an annotated graph appeared on 6/30/2010. Click here.
View all notes |
Alert me of new notes |
CANSLIM.net Company Profile |
SEC |
Zacks Reports |
StockTalk |
News |
Chart |
Request a new note
C
A N
S L
I M
|
Symbol/Exchange
Company Name
Industry Group |
PRICE |
CHANGE
(%Change) |
Day High |
Volume
(% DAV)
(% 50 day avg vol) |
52 Wk Hi
% From Hi |
Featured
Date |
Price
Featured |
Pivot Featured |
|
Max Buy |
NEM
-
NYSE
Newmont Mining Corp
METALS and MINING - Gold
|
$58.62
|
-0.14
-0.24% |
$59.64
|
9,409,388
93.20% of 50 DAV
50 DAV is 10,095,600
|
$62.62
-6.39%
|
6/22/2010
|
$59.60
|
PP = $59.67
|
|
MB = $62.65
|
Most Recent Note - 7/6/2010 6:05:08 PM
Y - Down today for a third consecutive losing session. Enduring distributional pressure last week, it slumped from its 52-week high back toward prior chart highs amid a mostly negative market (M criteria) environment. Featured in a 6/22/10 Stock Bulletin with annotated graph (read here).
>>> The latest Featured Stock Update with an annotated graph appeared on 6/22/2010. Click here.
View all notes |
Alert me of new notes |
CANSLIM.net Company Profile |
SEC |
Zacks Reports |
StockTalk |
News |
Chart |
Request a new note
C
A N
S L
I M
|
ROVI
-
NASDAQ
Rovi Corp
COMPUTER SOFTWARE andamp; SERVICES - Security Software andamp; Services
|
$39.42
|
+1.68
4.45% |
$39.56
|
2,502,038
178.70% of 50 DAV
50 DAV is 1,400,100
|
$40.06
-1.60%
|
6/3/2010
|
$38.70
|
PP = $40.16
|
|
MB = $42.17
|
Most Recent Note - 7/6/2010 6:12:13 PM
Y - Considerable gain today on higher volume, closing only -1.6% off its 52-week high. Disciplined investors will await a new FTD and a convincing gain above its pivot point with heavy volume to trigger a new buy signal. Prior lows near $35 area define support above its 200 DMA line.
>>> The latest Featured Stock Update with an annotated graph appeared on 6/28/2010. Click here.
View all notes |
Alert me of new notes |
CANSLIM.net Company Profile |
SEC |
Zacks Reports |
StockTalk |
News |
Chart |
Request a new note
C
A N
S L
I M
|
SUMR
-
NASDAQ
Summer Infant Inc
CONSUMER NON-DURABLES - Personal Products
|
$6.61
|
-0.21
-3.08% |
$7.14
|
98,185
90.33% of 50 DAV
50 DAV is 108,700
|
$8.42
-21.50%
|
5/4/2010
|
$6.85
|
PP = $7.09
|
|
MB = $7.44
|
Most Recent Note - 7/6/2010 6:15:49 PM
G - Negative reversal today after encountering resistance at its 50 DMA line. Recent chart lows in the $6.25 area define important support to watch. Gains back above its 50 DMA line and above recent chart highs near $7.40 would be an encouraging technical improvement.
>>> The latest Featured Stock Update with an annotated graph appeared on 6/24/2010. Click here.
View all notes |
Alert me of new notes |
CANSLIM.net Company Profile |
SEC |
Zacks Reports |
StockTalk |
News |
Chart |
Request a new note
C
A N
S L
I M
|
THOR
-
NASDAQ
Thoratec Corp
HEALTH SERVICES - Medical Instruments and Supplies
|
$43.36
|
+0.16
0.37% |
$44.86
|
728,187
61.29% of 50 DAV
50 DAV is 1,188,100
|
$47.93
-9.53%
|
6/3/2010
|
$44.38
|
PP = $45.35
|
|
MB = $47.62
|
Most Recent Note - 7/6/2010 6:17:12 PM
G - Closed near the session low today with a small gain on lighter volume. Found support last week near its a 50 DMA line, an important support level. Color code was changed to green as weakness raised concerns.
>>> The latest Featured Stock Update with an annotated graph appeared on 6/23/2010. Click here.
View all notes |
Alert me of new notes |
CANSLIM.net Company Profile |
SEC |
Zacks Reports |
StockTalk |
News |
Chart |
Request a new note
C
A N
S L
I M
|
ULTA
-
NASDAQ
Ulta Salon Cosm & Frag
SPECIALTY RETAIL - Specialty Retail, Other
|
$22.21
|
-0.87
-3.77% |
$23.88
|
933,182
135.36% of 50 DAV
50 DAV is 689,400
|
$26.75
-16.97%
|
5/28/2010
|
$25.58
|
PP = $25.86
|
|
MB = $27.15
|
Most Recent Note - 7/6/2010 6:19:05 PM
G - Erased early gains and closed with a loss today on above average volume after encountering resistance at its 50 DMA line. Color code was changed to green after the latest technical deterioration and slump below its pivot point.
>>> The latest Featured Stock Update with an annotated graph appeared on 6/25/2010. Click here.
View all notes |
Alert me of new notes |
CANSLIM.net Company Profile |
SEC |
Zacks Reports |
StockTalk |
News |
Chart |
Request a new note
C
A N
S L
I M
|
Symbol/Exchange
Company Name
Industry Group |
PRICE |
CHANGE
(%Change) |
Day High |
Volume
(% DAV)
(% 50 day avg vol) |
52 Wk Hi
% From Hi |
Featured
Date |
Price
Featured |
Pivot Featured |
|
Max Buy |
|
|
|
THESE ARE NOT BUY RECOMMENDATIONS!
Comments contained in the body of this report are technical
opinions only. The material herein has been obtained
from sources believed to be reliable and accurate, however,
its accuracy and completeness cannot be guaranteed.
This site is not an investment advisor, hence it does
not endorse or recommend any securities or other investments.
Any recommendation contained in this report may not
be suitable for all investors and it is not to be deemed
an offer or solicitation on our part with respect to
the purchase or sale of any securities. All trademarks,
service marks and trade names appearing in this report
are the property of their respective owners, and are
likewise used for identification purposes only.
This report is a service available
only to active Paid Premium Members.
You may opt-out of receiving report notifications
at any time. Questions or comments may be submitted
by writing to Premium Membership Services 665 S.E. 10 Street, Suite 201 Deerfield Beach, FL 33441-5634 or by calling 1-800-965-8307
or 954-785-1121.
|
|
|


