You are not logged in.
This means you
CAN ONLY VIEW reports that were published prior to Monday, April 14, 2025.
You
MUST UPGRADE YOUR MEMBERSHIP if you want to see any current reports.
AFTER MARKET UPDATE - MONDAY, JULY 6TH, 2009
Previous After Market Report Next After Market Report >>>
|
|
|
|
DOW |
+44.13 |
8,324.87 |
+0.53% |
|
Volume |
1,140,592,190 |
+56% |
|
Volume |
2,008,082,200 |
+1% |
|
NASDAQ |
-9.12 |
1,787.40 |
-0.51% |
|
Advancers |
1,237 |
40% |
|
Advancers |
1,002 |
36% |
|
S&P 500 |
+2.30 |
898.72 |
+0.26% |
|
Decliners |
1,774 |
57% |
|
Decliners |
1,683 |
60% |
|
Russell 2000 |
-3.18 |
494.03 |
-0.64% |
|
52 Wk Highs |
11 |
|
|
52 Wk Highs |
17 |
|
|
S&P 600 |
-1.24 |
261.89 |
-0.47% |
|
52 Wk Lows |
6 |
|
|
52 Wk Lows |
23 |
|
|
 |
Major Averages End Post-Holiday Session Mixed
Adam Sarhan, Contributing Writer,
The market opened sharply lower but spent the rest of the day rallying after a stronger than expected economic report was released. The major indices ended mixed with the tech-sector draging the tech-heavy index into the red. Volume totals were reported higher on the NYSE and on the Nasdaq exchange which was expected since Friday's volume totals were exceptionally light. Decliners led advancers by nearly a 3-to-2 ratio on the NYSE and on the Nasdaq exchange. There were only 3 high-ranked companies from the CANSLIM.net Leaders List that made a new 52-week high and appeared on the CANSLIM.net BreakOuts Page, matching the 3 issues that appeared on the prior session.
The benchmark S&P 500 500 Index and small cap Russell 2000 indexes both managed to find support and rally near their respective 200-day moving average (DMA) lines on Monday which was an encouraging sign. However the small cap index ended in the red while the benchmark index ended with a small gain. The tech-heavy Nasdaq composite found support near its shorter term 50 DMA line, which was also a healthy sign. The Dow Jones Industrial Average is the only major average to close below both its shorter (50) and longer term (200) day moving average lines on Monday. From our perspective, the current rally is under pressure, since the action in leading stocks remains questionable (only 3 stocks today on the breakouts page!).
Turning to the economic front, the Institute of Supply Management (ISM) released its service index which was stronger than expected. The service index, also is also known as the non- manufacturing index and makes up nearly 90% of the economy, rose to 47 from 44 in May. Even though the reading was stronger than expected it was still below the boom/bust line of 50, indicating contraction. US services shrank at the slowest pace in nine months which was also an impressive feat. Looking forward, investors will begin digesting second quarter earnings and that will likely dictate the near term action for the major averages.
PICTURED: The Nasdaq Composite Index rallied after finding support near its 50 DMA line on Monday, but ended with a loss..
|
|
|
 |
Tech Sector and Commodity-Linked Areas Slump
Kenneth J. Gruneisen - Passed the CAN SLIM® Master's Exam
Upward action from the Retail ($RLX +0.60%) and Broker/Dealer ($XBD +0.82%) indexes helped the NYSE indices rise. The Gold & Silver Index ($XAU -4.13%) was a standout decliner on Monday, offering no safe haven for investors. The Integrated Oil ($XOI -1.53%) and Oil Services ($OSX -1.31%) indexes also lost ground as the commodity-linked areas struggled. The tech indexes did not fare as well as former tech-sector leader, Dell Inc. (DELL +3.47%), which sparkled amid a swirl of headlines. Meanwhile, the Semiconductor ($SOX -1.35%), Networking ($NWX -1.09%), Biotechnology ($BTK -0.77%), and Internet ($IIX -0.70%) indexes smoldered with losses. The Bank Index ($BKX -0.09%) edged lower, and the Healthcare ($HMO +0.22%) group posted a small gain.
Have you seen the Q2 WEBCAST ON DEMAND ???
it aired June 24th...
| Oil Services |
$OSX |
150.36 |
-1.99 |
-1.31% |
+23.87% |
| Healthcare |
$HMO |
1,072.05 |
+2.33 |
+0.22% |
+11.65% |
| Integrated Oil |
$XOI |
876.79 |
-13.64 |
-1.53% |
-10.50% |
| Semiconductor |
$SOX |
260.24 |
-3.57 |
-1.35% |
+22.66% |
| Networking |
$NWX |
180.26 |
-1.99 |
-1.09% |
+25.28% |
| Internet |
$IIX |
181.87 |
-1.28 |
-0.70% |
+35.96% |
| Broker/Dealer |
$XBD |
96.56 |
+0.79 |
+0.82% |
+24.64% |
| Retail |
$RLX |
310.75 |
+1.86 |
+0.60% |
+11.28% |
| Gold & Silver |
$XAU |
134.22 |
-5.78 |
-4.13% |
+8.37% |
| Bank |
$BKX |
35.07 |
-0.03 |
-0.09% |
-20.87% |
| Biotech |
$BTK |
659.39 |
-5.15 |
-0.77% |
+1.89% |
|
|
|
 |
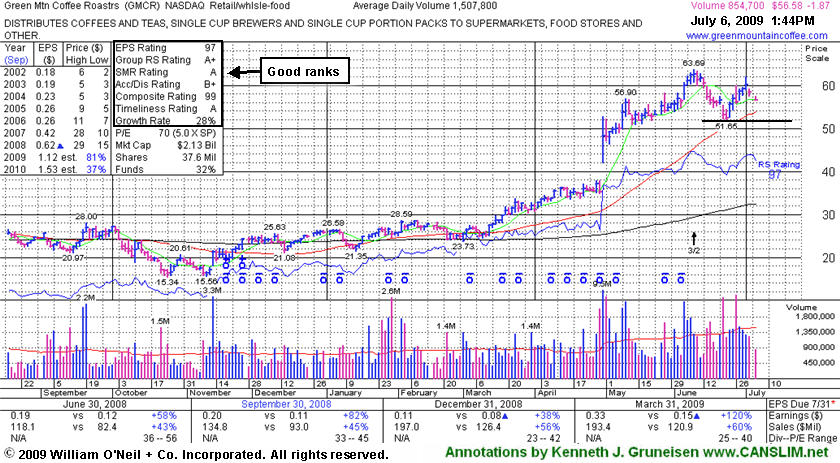
Consolidating Above 50 DMA; Late-Stage Breakout Failed
Kenneth J. Gruneisen - Passed the CAN SLIM® Master's Exam
Green Mountain Coffee Roasters (GMCR -$0.95 or -1.63% to $57.50) has been quietly consolidating above its 50-day moving average (DMA) line. Its 50 DMA line is an important support level to watch. A violation of it and the recent chart low ($51.65) would raise concerns and trigger technical sell signals. Losses negated its latest breakout from a "high-tight flag" type pattern. Under the headline "Gap Down Today Indicative Of Distributional Pressure" an annotated graph illustrated as its late stage breakout failed amid "worrisome signs of distributional pressure" in the Featured Stock Update section on June 22nd (read here). It barely claimed its all-time high with a small gain on light volume as its 3:2 stock split took effect on 6/09/09. Do not be confused by the effect of the split on share prices, GMCR traded up an astonishing +144% since appearing with an annotated graph under the headline "It May Soon Be Time To Go Green" when featured in the January 2009 CANSLIM.net News (read here).
|
|
|
Color Codes Explained :
Y - Better candidates highlighted by our
staff of experts.
G - Previously featured
in past reports as yellow but may no longer be buyable under the
guidelines.
***Last / Change / Volume quote data in this table corresponds with the timestamp on the note***
Symbol/Exchange
Company Name
Industry Group |
Last |
Chg. |
Vol
% DAV |
Date Featured |
Price Featured |
Latest Pivot Point
Featured |
Status |
| Latest Max Buy Price |
GMCR
- NASDAQ
Green Mtn Coffee Roastrs
FOOD & BEVERAGE - Processed & Packaged Goods
|
$58.65
|
N/A
|
N/A
N/A
|
1/1/2008
(Date
Featured) |
$27.13
(Price
Featured) |
PP = $28.66 |
G |
| MB = $30.09 |
Most Recent Note - 7/2/2009 3:57:08 PM
G - Small gap down today. Recently found support above its 50 DMA line -important support to watch. On 6/09/09 it reached a new all-time high with a gain on light volume as a 3:2 stock split took effect. GMCR traded up more than +144% since appearing with an annotated graph under the headline "It May Soon Be Time To Go Green" when featured in the January 2009 CANSLIM.net News (read here).
>>> The latest Featured Stock Update with an annotated graph appeared on 7/6/2009. click here.
|
|
C
A
S
I |
News |
Chart |
SEC
View all notes Alert
me of new notes
Company
Profile
|
HMSY
- NASDAQ
H M S Holdings Corp
COMPUTER SOFTWARE & SERVICES - Healthcare Information Service
|
$40.62
|
N/A
|
N/A
N/A
|
2/20/2009
(Date
Featured) |
$34.08
(Price
Featured) |
PP = $38.38 |
G |
| MB = $40.30 |
Most Recent Note - 7/2/2009 4:00:26 PM
G - Extended from a sound base. Prior chart highs and an upward trendline connecting its April-June lows come into play near $38, making that a very important initial support level above its 50 DMA line to watch. Gap up gain on 6/16/09 with heavy volume triggered a technical buy signal. No overhead supply is left to hinder the progress for this Commercial Services - Healthcare firm.
>>> The latest Featured Stock Update with an annotated graph appeared on 6/29/2009. click here.
|
|
C
A
S
I |
News |
Chart |
SEC
View all notes Alert
me of new notes
Company
Profile
|
LFT
-
|
$23.76
|
N/A
|
N/A
N/A
|
4/2/2009
(Date
Featured) |
$22.19
(Price
Featured) |
PP = $21.81 |
G |
| MB = $22.90 |
Most Recent Note - 7/2/2009 4:02:40 PM
G - Gapped down today and sank to its lowest level since May 27th. Its outlook gets increasingly questionable the longer it remains treading under its 50 DMA line. Its progress could be hindered by future share offerings. This Chinese Computer Software firm recently filed a registration of approximately 16 million shares for resale, and it also revealed a planned acquisition of another Chinese service provider.
>>> The latest Featured Stock Update with an annotated graph appeared on 7/1/2009. click here.
|
|
C
A
S
I |
News |
Chart |
SEC
View all notes Alert
me of new notes
Company
Profile
|
NTES
- NASDAQ
Netease Inc Adr
INTERNET - Internet Information Providers
|
$33.63
|
N/A
|
N/A
N/A
|
5/21/2009
(Date
Featured) |
$31.19
(Price
Featured) |
PP = $32.75 |
G |
| MB = $34.39 |
Most Recent Note - 7/2/2009 4:08:06 PM
G - Gapped down today for its 4th consecutive loss, which led to a worrisome violation of a multi-month upward trendline. Closed near its 50 DMA line which coincides with prior chart highs in the $32 area as an important technical support level to watch. It has negated all gains since its 5/28/09 gap up and considerable gain with +79% above average volume confirmed its last sound technical buy signal. Indications of institutional (the I criteria) buying demand have been noted after earnings news on 5/20/09 a shakeout tested support near its 50 DMA line. First featured at $26.75 in the 3/31/09 CANSLIM.net Mid-Day Breakouts Report (read here). This high-ranked Chinese Internet - Content firm was also summarized in greater detail including an annotated graph in the April 2009 issue of CANSLIM.net News (read here).
>>> The latest Featured Stock Update with an annotated graph appeared on 6/30/2009. click here.
|
|
C
A
S
I |
News |
Chart |
SEC
View all notes Alert
me of new notes
Company
Profile
|
NVEC
- NASDAQ
N V E Corp
ELECTRONICS - Semiconductor - Specialized
|
$47.00
|
N/A
|
N/A
N/A
|
3/13/2009
(Date
Featured) |
$33.85
(Price
Featured) |
PP = $45.50 |
G |
| MB = $47.78 |
Most Recent Note - 7/2/2009 4:11:38 PM
G - Loss on slightly above average volume today has it sinking back under its previously cited "max buy" level. Its 50 DMA and prior highs are important support to watch. Its 6/19/09 gain with volume more than 2 times average helped it rise from an "ascending base" type pattern to a new 52-week high and multi-year high, triggering a technical buy signal. Sales increases in recent comparisons have been under the +25% guideline and still rather minuscule, leaving concerns, especially in the event of any hiccups. This is a reason to be especially disciplined about proper entries and exits.
>>> The latest Featured Stock Update with an annotated graph appeared on 6/23/2009. click here.
|
|
C
A
S
I |
News |
Chart |
SEC
View all notes Alert
me of new notes
Company
Profile
|
SNDA
-
|
$53.02
|
N/A
|
N/A
N/A
|
5/31/2009
(Date
Featured) |
$57.62
(Price
Featured) |
PP = $53.95 |
G |
| MB = $56.65 |
Most Recent Note - 7/2/2009 4:13:44 PM
G - Gapped down today for a loss on light volume, sinking below its 50 DMA line again. Deterioration below its recent chart low near $50 would raise more serious concerns and trigger a worrisome technical sell signal. Detailed analysis was included when recently featured in the June 2009 issue of CANSLIM.net News. Be sure to review the "What to Look Out For" section and entire detailed summary - read here).
>>> The latest Featured Stock Update with an annotated graph appeared on 7/2/2009. click here.
|
|
C
A
S
I |
News |
Chart |
SEC
View all notes Alert
me of new notes
Company
Profile
|
SYNA
- NASDAQ
Synaptics Inc
COMPUTER SOFTWARE & SERVICES - Information Technology Service
|
$37.79
|
N/A
|
N/A
N/A
|
5/18/2009
(Date
Featured) |
$32.58
(Price
Featured) |
PP = $34.52 |
G |
| MB = $36.25 |
Most Recent Note - 7/2/2009 4:15:26 PM
G - Volume continues to dry up while consolidating in a tight range within close striking distance of all-time highs. Its August 2008 chart highs ($36), its 50 DMA line, and recent chart highs coincide to define an important support level. First featured in yellow in the May 18, 2009 mid-day report (read here). The number of top-rated funds owning its shares rose from 123 in June '08 to 197 in March '09, which is good news concerning the I criteria. Its annual earnings (the A criteria) history showed a dowturn in 2006, leaving concerns, but it followed that up with strong growth the next 2 years. Its small supply of shares (the S criteria) outstanding could contribute to especially great volatility in the event of institutional accumulation or distribution.
>>> The latest Featured Stock Update with an annotated graph appeared on 6/26/2009. click here.
|
|
C
A
S
I |
News |
Chart |
SEC
View all notes Alert
me of new notes
Company
Profile
|
TNDM
- NASDAQ
Tandem Diabetes Care Inc
TELECOMMUNICATIONS - Wireless Communications
|
$29.13
|
N/A
|
N/A
N/A
|
3/2/2009
(Date
Featured) |
$18.89
(Price
Featured) |
PP = $29.85 |
G |
| MB = $31.34 |
Most Recent Note - 7/2/2009 4:17:14 PM
G - Gapped down today for a small loss on light volume, quietly consolidating after recently rebounding above its 50 DMA line. Its choppy chart offers no sound base per the investment system's guidelines. It traded up as much as +72.42% since first featured at $18.89 in the 3/02/09 Mid-Day BreakOuts Report (read here).
>>> The latest Featured Stock Update with an annotated graph appeared on 6/24/2009. click here.
|
|
C
A
S
I |
News |
Chart |
SEC
View all notes Alert
me of new notes
Company
Profile
|
|
|
|
THESE ARE NOT BUY RECOMMENDATIONS!
Comments contained in the body of this report are technical
opinions only. The material herein has been obtained
from sources believed to be reliable and accurate, however,
its accuracy and completeness cannot be guaranteed.
This site is not an investment advisor, hence it does
not endorse or recommend any securities or other investments.
Any recommendation contained in this report may not
be suitable for all investors and it is not to be deemed
an offer or solicitation on our part with respect to
the purchase or sale of any securities. All trademarks,
service marks and trade names appearing in this report
are the property of their respective owners, and are
likewise used for identification purposes only.
This report is a service available
only to active Paid Premium Members.
You may opt-out of receiving report notifications
at any time. Questions or comments may be submitted
by writing to Premium Membership Services 665 S.E. 10 Street, Suite 201 Deerfield Beach, FL 33441-5634 or by calling 1-800-965-8307
or 954-785-1121.
|
|
|


