You are not logged in.
This means you
CAN ONLY VIEW reports that were published prior to Monday, March 10, 2025.
You
MUST UPGRADE YOUR MEMBERSHIP if you want to see any current reports.
AFTER MARKET UPDATE - FRIDAY, JULY 5TH, 2013
Previous After Market Report Next After Market Report >>>
|
|
|
|
DOW |
+147.29 |
15,135.84 |
+0.98% |
|
Volume |
625,396,820 |
+30% |
|
Volume |
1,220,856,200 |
+36% |
|
NASDAQ |
+35.71 |
3,479.38 |
+1.04% |
|
Advancers |
1,730 |
56% |
|
Advancers |
1,818 |
71% |
|
S&P 500 |
+16.48 |
1,631.89 |
+1.02% |
|
Decliners |
1,310 |
42% |
|
Decliners |
663 |
26% |
|
Russell 2000 |
+14.26 |
1,005.39 |
+1.44% |
|
52 Wk Highs |
210 |
|
|
52 Wk Highs |
308 |
|
|
S&P 600 |
+8.22 |
568.15 |
+1.47% |
|
52 Wk Lows |
85 |
|
|
52 Wk Lows |
30 |
|
|
 |
Indices Rebounded Above 50-Day Moving Average Lines
Kenneth J. Gruneisen - Passed the CAN SLIM® Master's Exam
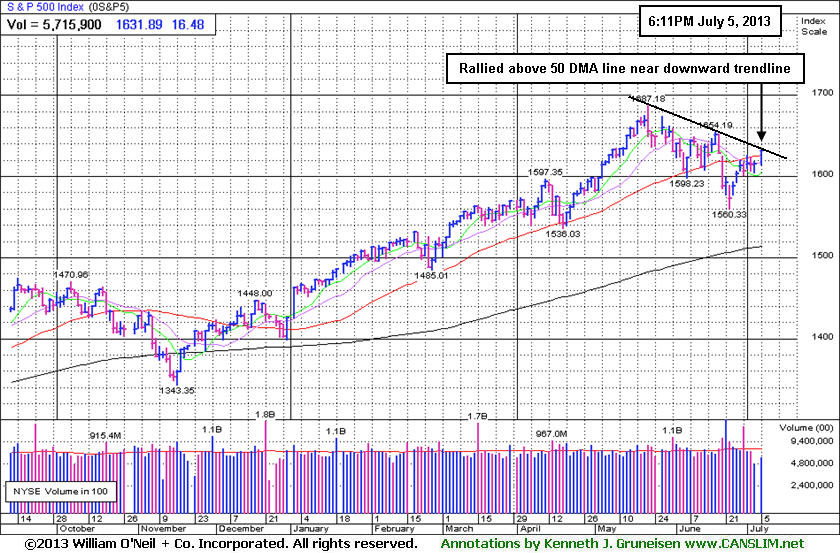
Friday's advance helped the major averages gain ground for the second consecutive week, and they rebounded above their respective 50-day moving average lines helping their technical stance improve. The Dow Jones Industrial Average was up +1.5% for the week, the S&P 500 Index increased +1.6% and the Nasdaq Compsite Index rose +2.2%. Friday's session saw volume totals on the NYSE and on the Nasdaq exchange higher than Wednesday's shortened trading session totals. Breadth was positive as advancers led decliners by nearly a 3-2 margin on the NYSE and by nearly a 3-1 margin on the Nasdaq exchange. There were 96 high-ranked companies from the CANSLIM.net Leaders List made new 52-week highs and appeared on the CANSLIM.net BreakOuts Page, up considerably from the prior session total of 25 stocks. The list of stocks hitting new 52-week highs expanded and easily outnumbered new 52-week lows on both the NYSE and the Nasdaq exchange. There were gains for 6 of the 8 high-ranked companies currently included on the Featured Stocks Page.
Equity markets advanced thanks to an encouraging employment update. Non-farm payrolls increased by 195,000 for the second straight month, topping expectations for a gain of 165,000. In addition, the jobless rate remained at 7.6% as more Americans sought out employment.
Nine of the 10 S&P 500 sectors were higher with cyclicals outperforming defensive issues. Financials including JP Morgan Chase & Co (JPM +2.31%) and Industrials including 3M Company (MMM +1.91%) rose. Utilities lagged behind as Southern Co. (SO -0.60%) and Duke Energy Corp (DUK -0.18%) retreated. Now attention turns to the start of second-quarter earnings season with Alcoa Inc's (AA +1.30%) profit tally due out after the close next Monday.
In fixed-income, Treasuries sold off. The 10-year note nearly fell two full points to yield 2.72%, its highest level since August 2011. The 30-year bond lost over three full points to yield 3.69%.
Monday's session marks Day 9 of the current rally attempt. Disciplined investors will note that the market (M criteria) did not produce a follow-through day within the most ideal period between days 4-7 of a new rally attempt. In spite of the recent rebound there is still a need for caution until a new rally is confirmed by a proper follow-through day (FTD) of meaningful gains (+1.4% or greater) from at least one of the major averages on higher volume coupled with an expansion in leadership (stocks hitting new 52-week highs). The rally attempt remains valid unless the Day 1 lows are violated which would clearly indicate deterioration and signal that the correction is worsening.
Upcoming CANSLIM.net reports will observe and explain any noteworthy shifts in the market direction (M criteria) while especially highlighting the characteristics and important details in the bold portion of this commentary. Regular readers are aware via prior reports since early June repeatedly reminding members - "Be protective of any gains, and limit losses! Be especially watchful for any individual issues flashing technical sell signals. It is vitally important to your success with the fact-based investment system to reduce exposure and preserve cash during market downdrafts."
Individual leaders best matching the winning models of the fact-based investment system are on the Featured Stocks Page - with our Certified experts' latest notes and links to additional resources including detailed analysis with annotated graphs. The Premium Member Homepage - includes "dynamic archives" to all prior pay reports published. Watch for an announcement via email concerning the next WEBCAST.
PICTURED: The S&P 500 Index rebounded above its 50-day moving average (DMA) line and is challenging near-term resistance at a downward trendline.
|
 Kenneth J. Gruneisen started out as a licensed stockbroker in August 1987, a couple of months prior to the historic stock market crash that took the Dow Jones Industrial Average down -22.6% in a single day. He has published daily fact-based fundamental and technical analysis on high-ranked stocks online for two decades. Through FACTBASEDINVESTING.COM, Kenneth provides educational articles, news, market commentary, and other information regarding proven investment systems that work in good times and bad.
Comments contained in the body of this report are technical opinions only and are not necessarily those of Gruneisen Growth Corp. The material herein has been obtained from sources believed to be reliable and accurate, however, its accuracy and completeness cannot be guaranteed. Our firm, employees, and customers may effect transactions, including transactions contrary to any recommendation herein, or have positions in the securities mentioned herein or options with respect thereto. Any recommendation contained in this report may not be suitable for all investors and it is not to be deemed an offer or solicitation on our part with respect to the purchase or sale of any securities. |
|
 |
Financial, Tech, Retail, Energy, and Healthcare Groups Rose
Kenneth J. Gruneisen - Passed the CAN SLIM® Master's Exam
Financial shares underpinned the major averages' gains on Friday as the Broker/Dealer Index ($XBD +2.39%) and the Bank Index ($BKX +2.62%) both tallied solid gains. The Biotechnology Index ($BTK +1.83%) led the tech sector while the Networking Index ($NWX +1.47%), Semiconductor Index ($SOX +1.35%), and Internet Index ($IIX +1.13%) posted unanimous gains. The Retail Index ($RLX +1.05%) and the Healthcare Index ($HMO +1.27%) rose, and gains in energy-related shares boosted the Oil Services Index ($OSX +1.81%) and the Integrated Oil Index ($XOI +0.69%). The Gold & Silver Index ($XAU -3.19%) was a clear laggard as it suffered a large loss.
Charts courtesy www.stockcharts.com
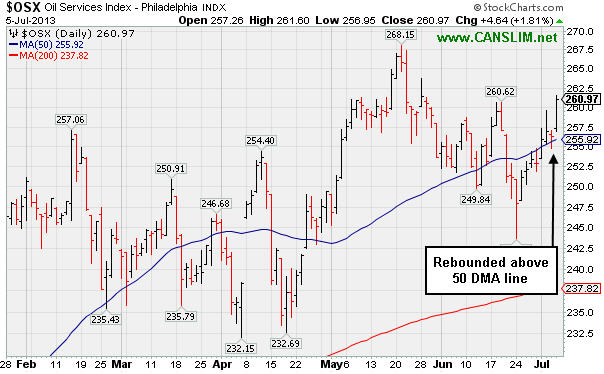
PICTURED: The Oil Services Index ($OSX +1.81%) recently rebounded above its 50-day moving average (DMA) line, rallying toward its May highs.
| Oil Services |
$OSX |
260.97 |
+4.64 |
+1.81% |
+18.54% |
| Healthcare |
$HMO |
3,257.78 |
+40.92 |
+1.27% |
+29.58% |
| Integrated Oil |
$XOI |
1,340.77 |
+9.16 |
+0.69% |
+7.97% |
| Semiconductor |
$SOX |
476.12 |
+6.32 |
+1.35% |
+23.97% |
| Networking |
$NWX |
264.60 |
+3.83 |
+1.47% |
+16.79% |
| Internet |
$IIX |
383.65 |
+4.30 |
+1.13% |
+17.32% |
| Broker/Dealer |
$XBD |
130.73 |
+3.05 |
+2.39% |
+38.59% |
| Retail |
$RLX |
809.70 |
+8.44 |
+1.05% |
+23.99% |
| Gold & Silver |
$XAU |
86.44 |
-2.85 |
-3.19% |
-47.80% |
| Bank |
$BKX |
63.94 |
+1.63 |
+2.62% |
+24.69% |
| Biotech |
$BTK |
2,036.95 |
+36.55 |
+1.83% |
+31.67% |
|
|
|
 |
Holding Ground Following Offering and M&A News
Kenneth J. Gruneisen - Passed the CAN SLIM® Master's Exam
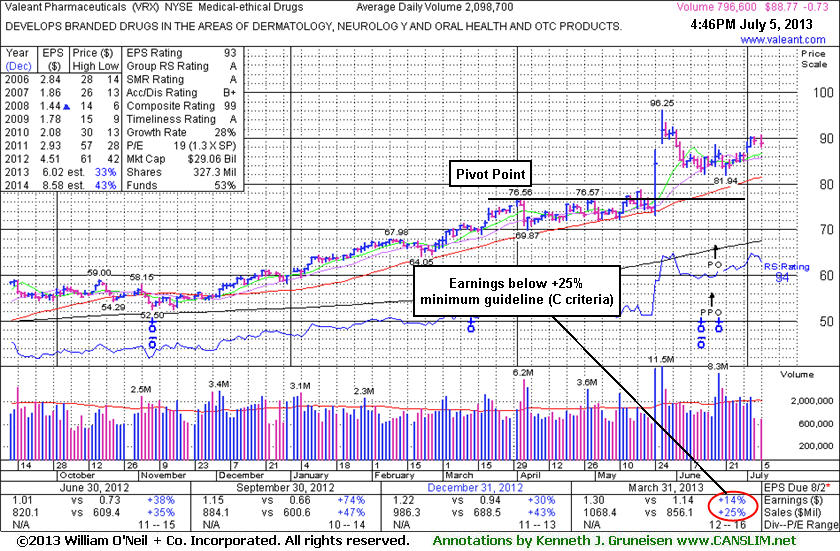
Valeant Pharmaceuticals International, Inc (VRX -$0.73 or -0.82% to $88.77) held its ground above its 50-day moving average (DMA) line ($81.54) and well above prior highs in the $76 area since last shown in this FSU section on 6/24/13 with an annotated graph under the headline, "Completed Public Offering Following M&A News." The high-ranked Medical - Ethical Drugs firm's shares spiked higher in late May at around the time of M&A news that it would buy Bausch & Lomb for $8.7 billion. Time alone will tell if Valeant's recent acquisitions will result in stronger earnings in the upcoming quarterly comparisons. Quarterly earnings increases (C criteria) had been strong and well above the +25% guideline until the Mar '13 period, which only showed a +14% earnings increase (see red circle) over the year-ago period. A downturn in FY '07 and '08 earnings (A criteria) has been followed by a strong earnings rebound in recent years. Return On Equity is currently reported at 37%, well above the 17% minimum guideline of the fact-based system.
Prior reports noted - "Investors are taught in the Certification to only buy stocks with a combination of both strong fundamentals and strong technical action, however stocks should be sold based on their technical action only. In this example, more bullish action rewarded patient investors still giving it the benefit of the doubt until any technical sell signals start adding up."
The number of top-rated funds owning its shares rose from 818 in Mar '12 in to 977 in Jun '13, a reassuring trend concerning the I criteria. It completed a Public Offering on 6/18/13, shortly after the M&A news. The upshot on Public Offerings is that when they are completed the end result is typically an increase in the total number of institutional owners. Institutional owners are often supportive of their existing positions and will even accumulate more shares when they consolidate near classic support levels like the 50 and 200 DMA lines, if they are still believers in the company. If too many become pessimistic and decide to unload, this is what ends up sending the stocks slicing through support.
|
|
|
Color Codes Explained :
Y - Better candidates highlighted by our
staff of experts.
G - Previously featured
in past reports as yellow but may no longer be buyable under the
guidelines.
***Last / Change / Volume data in this table is the closing quote data***
Symbol/Exchange
Company Name
Industry Group |
PRICE |
CHANGE
(%Change) |
Day High |
Volume
(% DAV)
(% 50 day avg vol) |
52 Wk Hi
% From Hi |
Featured
Date |
Price
Featured |
Pivot Featured |
|
Max Buy |
AMBA
-
NASDAQ
Ambarella Inc
ELECTRONICS - Semiconductor - Specialized
|
$17.23
|
+0.16
0.91% |
$17.48
|
530,958
44.86% of 50 DAV
50 DAV is 1,183,500
|
$18.58
-7.29%
|
5/6/2013
|
$15.31
|
PP = $16.10
|
|
MB = $16.91
|
Most Recent Note - 7/1/2013 1:08:51 PM
G - Color code is changed to green after rising back above its "max buy" level. Found support while recently consolidating above its 50 DMA line - important chart support where a violation would trigger a worrisome technical sell signal.
>>> The latest Featured Stock Update with an annotated graph appeared on 6/27/2013. Click here.
View all notes |
Alert me of new notes |
CANSLIM.net Company Profile |
SEC |
Zacks Reports |
StockTalk |
News |
Chart |
Request a new note
C
A N
S L
I M


|
EQM
-
NYSE
E Q T Midstream Partners
ENERGY - Oil and Gas Pipelines
|
$47.18
|
+0.43
0.92% |
$47.46
|
51,552
33.83% of 50 DAV
50 DAV is 152,400
|
$51.72
-8.78%
|
4/25/2013
|
$40.16
|
PP = $40.84
|
|
MB = $42.88
|
Most Recent Note - 7/1/2013 12:30:11 PM
G - Testing support at its 50 DMA line ($47.11) with today's 2nd consecutive loss backed by above average volume. Below that short-term average, the prior low ($44.83 on 6/05/13) defines the next important support level.
>>> The latest Featured Stock Update with an annotated graph appeared on 7/1/2013. Click here.
View all notes |
Alert me of new notes |
CANSLIM.net Company Profile |
SEC |
Zacks Reports |
StockTalk |
News |
Chart |
Request a new note
C
A N
S L
I M
|
FLT
-
NYSE
Fleetcor Technologies
DIVERSIFIED SERVICES - Business/Management Services
|
$84.34
|
+1.10
1.32% |
$84.42
|
494,124
54.77% of 50 DAV
50 DAV is 902,200
|
$89.75
-6.03%
|
5/29/2013
|
$86.02
|
PP = $85.66
|
|
MB = $89.94
|
 Most Recent Note - 7/5/2013 6:35:06 PM
G- Rebounded to finish the week above its 50 DMA line with light volume behind its gains following distributional pressure.
>>> The latest Featured Stock Update with an annotated graph appeared on 6/28/2013. Click here.
View all notes |
Alert me of new notes |
CANSLIM.net Company Profile |
SEC |
Zacks Reports |
StockTalk |
News |
Chart |
Request a new note
C
A N
S L
I M
|
LOPE
-
NASDAQ
Grand Canyon Education
DIVERSIFIED SERVICES - Education and; Training Services
|
$33.85
|
-0.19
-0.56% |
$35.17
|
336,829
79.93% of 50 DAV
50 DAV is 421,400
|
$34.48
-1.83%
|
6/19/2013
|
$31.47
|
PP = $34.17
|
|
MB = $35.88
|
Most Recent Note - 7/5/2013 6:36:54 PM
Y - Touched a new 52-week high but reversed into the red at the close. Subsequent volume driven gains above its pivot point may trigger a new technical buy signal. Its 50 DMA line and recent lows define support in the $30-31 area.
>>> The latest Featured Stock Update with an annotated graph appeared on 7/2/2013. Click here.
View all notes |
Alert me of new notes |
CANSLIM.net Company Profile |
SEC |
Zacks Reports |
StockTalk |
News |
Chart |
Request a new note
C
A N
S L
I M
|
PRAA
-
NASDAQ
Portfolio Recovery Assoc
DIVERSIFIED SERVICES - Business/Management Services
|
$158.93
|
+2.74
1.75% |
$158.93
|
73,433
85.69% of 50 DAV
50 DAV is 85,700
|
$163.87
-3.01%
|
5/1/2013
|
$130.77
|
PP = $127.88
|
|
MB = $134.27
|
Most Recent Note - 7/5/2013 6:39:37 PM
G - Extended from any sound base. Consolidating above its 50 DMA line which defines important near-term chart support.
>>> The latest Featured Stock Update with an annotated graph appeared on 6/25/2013. Click here.
View all notes |
Alert me of new notes |
CANSLIM.net Company Profile |
SEC |
Zacks Reports |
StockTalk |
News |
Chart |
Request a new note
C
A N
S L
I M
|
Symbol/Exchange
Company Name
Industry Group |
PRICE |
CHANGE
(%Change) |
Day High |
Volume
(% DAV)
(% 50 day avg vol) |
52 Wk Hi
% From Hi |
Featured
Date |
Price
Featured |
Pivot Featured |
|
Max Buy |
PRLB
-
NYSE
Proto Labs Inc
MANUFACTURING - Small Tools and Accessories
|
$65.49
|
+0.51
0.78% |
$66.45
|
245,580
49.18% of 50 DAV
50 DAV is 499,400
|
$67.40
-2.83%
|
6/17/2013
|
$59.37
|
PP = $59.94
|
|
MB = $62.94
|
Most Recent Note - 7/2/2013 7:00:27 PM
G- Encountered more distributional pressure today after a "negative reversal" on 6/28/13 at its 52-week high. Prior highs near $59 define important near-term support.
>>> The latest Featured Stock Update with an annotated graph appeared on 6/26/2013. Click here.
View all notes |
Alert me of new notes |
CANSLIM.net Company Profile |
SEC |
Zacks Reports |
StockTalk |
News |
Chart |
Request a new note
C
A N
S L
I M
|
RRTS
-
NYSE
Roadrunner Trans Systems
TRANSPORTATION - Air Delivery and Freight Service
|
$29.00
|
+0.68
2.40% |
$29.00
|
75,745
36.75% of 50 DAV
50 DAV is 206,100
|
$29.52
-1.76%
|
4/3/2013
|
$22.77
|
PP = $23.75
|
|
MB = $24.94
|
Most Recent Note - 7/5/2013 6:32:20 PM
G - Finished at the session high and 2 cents off its best-ever close with a gain on below average volume. Wedged higher without great volume conviction after finding support above its 50 DMA line. Perched within close striking distance of its 52-week high.
>>> The latest Featured Stock Update with an annotated graph appeared on 7/3/2013. Click here.
View all notes |
Alert me of new notes |
CANSLIM.net Company Profile |
SEC |
Zacks Reports |
StockTalk |
News |
Chart |
Request a new note
C
A N
S L
I M
|
VRX
-
NYSE
Valeant Pharmaceuticals
DRUGS - Drug Manufacturers - Other
|
$88.77
|
-0.73
-0.82% |
$90.82
|
798,289
38.04% of 50 DAV
50 DAV is 2,098,700
|
$96.25
-7.77%
|
4/30/2013
|
$60.24
|
PP = $76.66
|
|
MB = $80.49
|
Most Recent Note - 7/5/2013 6:33:02 PM
G- Holding its ground since completing a new Public Offering on 6/18/13 following recent M&A news. Concerns were raised by its sub par Mar '13 earnings report. See the latest FSU analysis for more details and a new annotated graph.
>>> The latest Featured Stock Update with an annotated graph appeared on 7/5/2013. Click here.
View all notes |
Alert me of new notes |
CANSLIM.net Company Profile |
SEC |
Zacks Reports |
StockTalk |
News |
Chart |
Request a new note
C
A N
S L
I M
|
|
|
|
THESE ARE NOT BUY RECOMMENDATIONS!
Comments contained in the body of this report are technical
opinions only. The material herein has been obtained
from sources believed to be reliable and accurate, however,
its accuracy and completeness cannot be guaranteed.
This site is not an investment advisor, hence it does
not endorse or recommend any securities or other investments.
Any recommendation contained in this report may not
be suitable for all investors and it is not to be deemed
an offer or solicitation on our part with respect to
the purchase or sale of any securities. All trademarks,
service marks and trade names appearing in this report
are the property of their respective owners, and are
likewise used for identification purposes only.
This report is a service available
only to active Paid Premium Members.
You may opt-out of receiving report notifications
at any time. Questions or comments may be submitted
by writing to Premium Membership Services 665 S.E. 10 Street, Suite 201 Deerfield Beach, FL 33441-5634 or by calling 1-800-965-8307
or 954-785-1121.
|
|
|

