***Last / Change / Volume data in this table is the closing quote data***
Symbol/Exchange
Company Name
Industry Group |
PRICE |
CHANGE
(%Change) |
Day High |
Volume
(% DAV)
(% 50 day avg vol) |
52 Wk Hi
% From Hi |
Featured
Date |
Price
Featured |
Pivot Featured |
|
Max Buy |
ALXN
-
NASDAQ
Alexion Pharmaceuticals
DRUGS - Drug Manufacturers - Other
|
$103.39
|
-0.35
-0.34% |
$104.27
|
1,463,199
66.25% of 50 DAV
50 DAV is 2,208,700
|
$104.38
-0.95%
|
5/1/2012
|
$91.73
|
PP = $95.11
|
|
MB = $99.87
|
Most Recent Note - 7/2/2012 4:13:39 PM
G - Gain with near average volume today led to a rally above its "max buy" level and its color code is changed to green. Prior highs in the $95 area define support to watch on pullbacks.
>>> The latest Featured Stock Update with an annotated graph appeared on 6/29/2012. Click here.
View all notes |
Alert me of new notes |
CANSLIM.net Company Profile |
SEC |
Zacks Reports |
StockTalk |
News |
Chart |
Request a new note
C
A N
S L
I M


|
ASPS
-
NASDAQ
Altisource Ptf Sltns Sa
REAL ESTATE - Property Management/Developmen
|
$74.99
|
-0.44
-0.58% |
$75.32
|
129,435
95.17% of 50 DAV
50 DAV is 136,000
|
$76.20
-1.59%
|
6/5/2012
|
$60.01
|
PP = $63.00
|
|
MB = $66.15
|
Most Recent Note - 7/3/2012 1:59:50 PM
G - Holding its ground near its 52-week high, extended from its prior base. Prior highs in the $65 area define support to watch on pullbacks. See the latest FSU analysis for more details and a new annotated graph.
>>> The latest Featured Stock Update with an annotated graph appeared on 7/3/2012. Click here.
View all notes |
Alert me of new notes |
CANSLIM.net Company Profile |
SEC |
Zacks Reports |
StockTalk |
News |
Chart |
Request a new note
C
A N
S L
I M
|
CERN
-
NASDAQ
Cerner Corp
COMPUTER SOFTWARE and SERVICES - Healthcare Information Service
|
$82.97
|
-0.59
-0.71% |
$83.66
|
1,145,163
73.51% of 50 DAV
50 DAV is 1,557,800
|
$88.32
-6.06%
|
6/7/2012
|
$78.36
|
PP = $84.20
|
|
MB = $88.41
|
 Most Recent Note - 7/5/2012 3:59:24 PM
G - Holding its ground since rebounding back above its 50 DMA line helping its technical stance. It has not formed a proper base since negating its prior breakout.
>>> The latest Featured Stock Update with an annotated graph appeared on 6/7/2012. Click here.
View all notes |
Alert me of new notes |
CANSLIM.net Company Profile |
SEC |
Zacks Reports |
StockTalk |
News |
Chart |
Request a new note
C
A N
S L
I M
|
CMCSA
-
NASDAQ
Comcast Corp Cl A
MEDIA - CATV Systems
|
$31.45
|
-0.58
-1.81% |
$32.06
|
9,793,855
69.23% of 50 DAV
50 DAV is 14,147,800
|
$32.50
-3.23%
|
6/11/2012
|
$29.94
|
PP = $30.98
|
|
MB = $32.53
|
Most Recent Note - 7/5/2012 1:06:14 PM
Y - Quietly consolidating near its 52-week high today. No overhead supply remains to act as resistance and it is still trading below its "max buy" level.
>>> The latest Featured Stock Update with an annotated graph appeared on 6/11/2012. Click here.
View all notes |
Alert me of new notes |
CANSLIM.net Company Profile |
SEC |
Zacks Reports |
StockTalk |
News |
Chart |
Request a new note
C
A N
S L
I M
|
CSTR
-
NASDAQ
Coinstar Inc
DIVERSIFIED SERVICES - Personal Services
|
$71.10
|
+0.64
0.91% |
$71.82
|
1,168,356
106.91% of 50 DAV
50 DAV is 1,092,800
|
$70.63
0.67%
|
6/26/2012
|
$64.05
|
PP = $67.00
|
|
MB = $70.35
|
Most Recent Note - 7/3/2012 1:54:48 PM
G - Hit another new 52-week high today and finished above its "max buy" level. Color code is changed to green while getting extended from its prior base.
>>> The latest Featured Stock Update with an annotated graph appeared on 6/26/2012. Click here.
View all notes |
Alert me of new notes |
CANSLIM.net Company Profile |
SEC |
Zacks Reports |
StockTalk |
News |
Chart |
Request a new note
C
A N
S L
I M
|
Symbol/Exchange
Company Name
Industry Group |
PRICE |
CHANGE
(%Change) |
Day High |
Volume
(% DAV)
(% 50 day avg vol) |
52 Wk Hi
% From Hi |
Featured
Date |
Price
Featured |
Pivot Featured |
|
Max Buy |
DG
-
NYSE
Dollar General Corp
RETAIL - Discount, Variety Stores
|
$54.29
|
+0.53
0.99% |
$54.57
|
4,047,580
105.55% of 50 DAV
50 DAV is 3,834,600
|
$55.30
-1.83%
|
5/7/2012
|
$48.51
|
PP = $47.69
|
|
MB = $50.07
|
Most Recent Note - 7/5/2012 4:00:34 PM
G - Posted a small gain today with average volume, hovering near its all-time high, extended from its prior base. Completed another Secondary Offering on 6/05/12, its 4th Secondary Offering since September '11.
>>> The latest Featured Stock Update with an annotated graph appeared on 6/12/2012. Click here.
View all notes |
Alert me of new notes |
CANSLIM.net Company Profile |
SEC |
Zacks Reports |
StockTalk |
News |
Chart |
Request a new note
C
A N
S L
I M
|
ECHO
-
NASDAQ
Echo Global Logistics
DIVERSIFIED SERVICES - Business/Management Services
|
$18.57
|
+0.17
0.92% |
$18.67
|
132,982
117.68% of 50 DAV
50 DAV is 113,000
|
$19.48
-4.67%
|
6/22/2012
|
$18.98
|
PP = $19.48
|
|
MB = $20.45
|
Most Recent Note - 7/3/2012 11:04:37 AM
Y - Trading in the upper half of its intra-day range, rebounding from early lows after gapping down today for a damaging loss. A volume-driven gain on the prior session led to a close just 3 cents below its pivot point, almost triggering a technical buy signal under the fact-based system.
>>> The latest Featured Stock Update with an annotated graph appeared on 6/22/2012. Click here.
View all notes |
Alert me of new notes |
CANSLIM.net Company Profile |
SEC |
Zacks Reports |
StockTalk |
News |
Chart |
Request a new note
C
A N
S L
I M
|
EXPE
-
NASDAQ
Expedia Inc
INTERNET - Internet Information Providers
|
$48.33
|
-0.34
-0.70% |
$49.23
|
2,021,102
43.11% of 50 DAV
50 DAV is 4,688,600
|
$50.66
-4.60%
|
4/27/2012
|
$41.80
|
PP = $35.57
|
|
MB = $37.35
|
Most Recent Note - 7/2/2012 4:16:24 PM
G - Rallying further above its 50 DMA line, it finished -2.9% off its 52-week high with a gain on below average volume today. It is extended from its prior highs in the $43 area and its 50 DMA line which define support.
>>> The latest Featured Stock Update with an annotated graph appeared on 6/8/2012. Click here.
View all notes |
Alert me of new notes |
CANSLIM.net Company Profile |
SEC |
Zacks Reports |
StockTalk |
News |
Chart |
Request a new note
C
A N
S L
I M
|
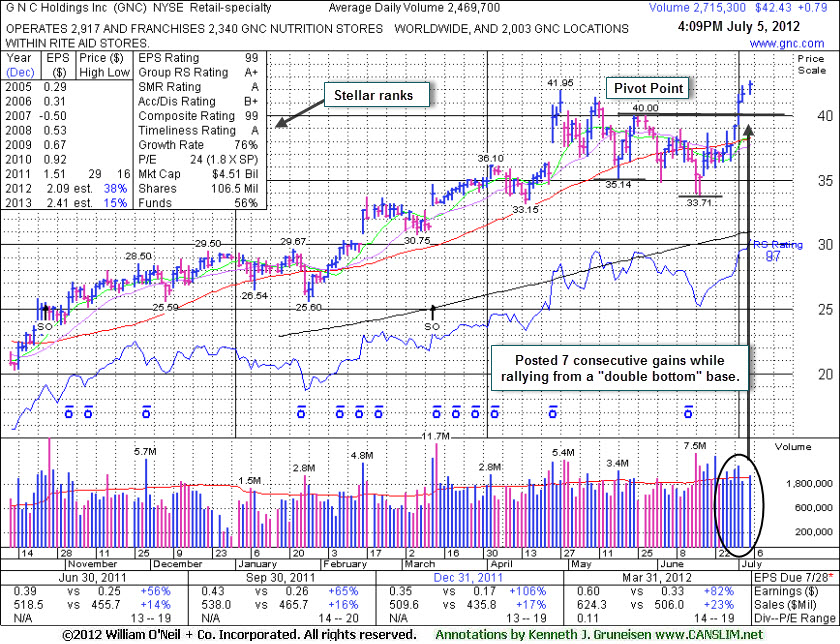
GNC
-
NYSE
G N C Holdings Inc
RETAIL - Drug Stores
|
$42.43
|
+0.79
1.90% |
$42.70
|
2,715,411
109.95% of 50 DAV
50 DAV is 2,469,700
|
$42.30
0.31%
|
6/29/2012
|
$39.20
|
PP = $40.00
|
|
MB = $42.00
|
Most Recent Note - 7/5/2012 4:40:06 PM
G - Color code is changed to green after today's 7th consecutive gain lifted it above the "max buy" level. Its 7/02/12 gain above the pivot point triggered a new (or add-on) technical buy signal. See the latest FSU analysis for more details and a new annotated graph.
>>> The latest Featured Stock Update with an annotated graph appeared on 7/5/2012. Click here.
View all notes |
Alert me of new notes |
CANSLIM.net Company Profile |
SEC |
Zacks Reports |
StockTalk |
News |
Chart |
Request a new note
C
A N
S L
I M
|
GPX
-
NYSE
G P Strategies Corp
DIVERSIFIED SERVICES - Education and Training Services
|
$18.52
|
-0.47
-2.47% |
$18.94
|
43,510
75.93% of 50 DAV
50 DAV is 57,300
|
$18.99
-2.47%
|
6/29/2012
|
$18.01
|
PP = $18.15
|
|
MB = $19.06
|
Most Recent Note - 7/5/2012 4:04:20 PM
Y - Loss today on light volume ended a 6 session winning streak into new high territory. Its 7/02/12 gain above the pivot point with above average volume triggered a technical buy signal after featured in the 6/29/12 mid-day report (read here) and noted - "It cleared a valid base earlier this week with volume-driven gains and no overhead supply remains. Quarterly earnings increases above the +25% guideline in the 8 latest quarterly comparisons through Dec '11 satisfy the C criteria. Recent cluster of Insider buying in May-Jun looks similar to that which was reported in Nov, Dec, and Jan as it rose toward and above prior resistance in the $14 area. Prior reports cautioned - 'Recent quarterly comparisons show improving sales revenues and earnings increases but its annual earnings (A criteria) history falls below the investment system's guidelines.'"

There are no Featured Stock Updates™ available for this stock at this time. You may request one by clicking the Request a New Note link below
View all notes |
Alert me of new notes |
CANSLIM.net Company Profile |
SEC |
Zacks Reports |
StockTalk |
News |
Chart |
Request a new note
C
A N
S L
I M
|
Symbol/Exchange
Company Name
Industry Group |
PRICE |
CHANGE
(%Change) |
Day High |
Volume
(% DAV)
(% 50 day avg vol) |
52 Wk Hi
% From Hi |
Featured
Date |
Price
Featured |
Pivot Featured |
|
Max Buy |
MLNX
-
NASDAQ
Mellanox Technologies
ELECTRONICS - Semiconductor - Broad Line
|
$76.82
|
+1.80
2.40% |
$77.69
|
871,728
149.14% of 50 DAV
50 DAV is 584,500
|
$75.09
2.30%
|
6/18/2012
|
$70.90
|
PP = $67.30
|
|
MB = $70.67
|
Most Recent Note - 7/5/2012 12:12:05 PM
G - Today's 4th consecutive gain helped it hit another new all-time high, getting more extended from its prior base. Recent chart lows define near-term support to watch above its 50 DMA line.
>>> The latest Featured Stock Update with an annotated graph appeared on 6/25/2012. Click here.
View all notes |
Alert me of new notes |
CANSLIM.net Company Profile |
SEC |
Zacks Reports |
StockTalk |
News |
Chart |
Request a new note
C
A N
S L
I M
|
N
-
NYSE
Netsuite Inc
DIVERSIFIED SERVICES - Business/Management Services
|
$54.99
|
-0.20
-0.36% |
$55.60
|
515,760
93.98% of 50 DAV
50 DAV is 548,800
|
$56.06
-1.91%
|
6/20/2012
|
$51.83
|
PP = $51.88
|
|
MB = $54.47
|
Most Recent Note - 7/3/2012 10:10:37 AM
G - Rallying further into new high territory today above its "max buy" level, getting extended from its prior base. No resistance remains due to overhead supply.
>>> The latest Featured Stock Update with an annotated graph appeared on 6/20/2012. Click here.
View all notes |
Alert me of new notes |
CANSLIM.net Company Profile |
SEC |
Zacks Reports |
StockTalk |
News |
Chart |
Request a new note
C
A N
S L
I M
|
NSM
-
NYSE
Nationstar Mtg Hldgs Inc
FINANCIAL SERVICES - Credit Services
|
$24.12
|
+0.75
3.21% |
$24.33
|
1,014,751
134.85% of 50 DAV
50 DAV is 752,500
|
$23.98
0.58%
|
6/27/2012
|
$20.29
|
PP = $20.46
|
|
MB = $21.48
|
Most Recent Note - 7/5/2012 4:01:18 PM
G - Hit yet another new 52-week high today with a 6th consecutive gain, getting more extended from its prior base. Prior highs in the $20 area define important support to watch on pullbacks.
>>> The latest Featured Stock Update with an annotated graph appeared on 6/27/2012. Click here.
View all notes |
Alert me of new notes |
CANSLIM.net Company Profile |
SEC |
Zacks Reports |
StockTalk |
News |
Chart |
Request a new note
C
A N
S L
I M
|
NTES
-
NASDAQ
Netease Inc Adr
INTERNET - Internet Information Providers
|
$61.38
|
+2.71
4.62% |
$61.90
|
881,681
120.22% of 50 DAV
50 DAV is 733,400
|
$65.54
-6.35%
|
3/19/2012
|
$56.18
|
PP = $55.10
|
|
MB = $57.86
|
Most Recent Note - 7/5/2012 1:02:24 PM
G - Rebounding above its 50 DMA line with today's gain, helping its technical stance and outlook improve. Found support near prior lows in the $55 area.
>>> The latest Featured Stock Update with an annotated graph appeared on 6/19/2012. Click here.
View all notes |
Alert me of new notes |
CANSLIM.net Company Profile |
SEC |
Zacks Reports |
StockTalk |
News |
Chart |
Request a new note
C
A N
S L
I M
|
SWI
-
NYSE
Solarwinds Inc
COMPUTER SOFTWARE and SERVICES - Application Software
|
$45.28
|
+0.50
1.12% |
$45.44
|
901,046
82.79% of 50 DAV
50 DAV is 1,088,400
|
$48.64
-6.91%
|
4/26/2012
|
$45.15
|
PP = $42.32
|
|
MB = $44.44
|
Most Recent Note - 7/3/2012 1:56:11 PM
G - Today's 3rd consecutive gain on lighter volume lifted it to its 50 DMA line. Gains above that short-term average would help its technical stance. The previously noted 6/04/11 low ($41.24) defines important support to watch.
>>> The latest Featured Stock Update with an annotated graph appeared on 6/15/2012. Click here.
View all notes |
Alert me of new notes |
CANSLIM.net Company Profile |
SEC |
Zacks Reports |
StockTalk |
News |
Chart |
Request a new note
C
A N
S L
I M
|
Symbol/Exchange
Company Name
Industry Group |
PRICE |
CHANGE
(%Change) |
Day High |
Volume
(% DAV)
(% 50 day avg vol) |
52 Wk Hi
% From Hi |
Featured
Date |
Price
Featured |
Pivot Featured |
|
Max Buy |
SXCI
-
NASDAQ
S X C Health Solutions
COMPUTER SOFTWARE and SERVICES - Healthcare Information Service
|
$96.37
|
-0.49
-0.51% |
$101.68
|
7,062,763
672.64% of 50 DAV
50 DAV is 1,050,000
|
$104.79
-8.04%
|
6/14/2012
|
$94.71
|
PP = $100.60
|
|
MB = $105.63
|
Most Recent Note - 7/5/2012 12:39:46 PM
Y - Churning above average volume today while off the session's earlier highs above its pivot point. Reversed and closed in the red after trading up on the 2 prior sessions, and the "negative reversals" were noted as signs of distributional pressure. No resistance remains due to overhead supply, and strong close above its pivot point may clinch a technical buy signal.
>>> The latest Featured Stock Update with an annotated graph appeared on 6/14/2012. Click here.
View all notes |
Alert me of new notes |
CANSLIM.net Company Profile |
SEC |
Zacks Reports |
StockTalk |
News |
Chart |
Request a new note
C
A N
S L
I M
|
TDG
-
NYSE
Transdigm Group Inc
AEROSPACE/DEFENSE - Aerospace/Defense Products and; Services
|
$133.68
|
+0.68
0.51% |
$134.89
|
281,292
50.23% of 50 DAV
50 DAV is 560,000
|
$136.34
-1.95%
|
6/18/2012
|
$127.00
|
PP = $132.79
|
|
MB = $139.43
|
Most Recent Note - 7/5/2012 1:08:51 PM
Y - Holding its ground since last noted when its 6/29/12 gain above its pivot point was backed by only +32% above average volume, below the minimum threshold need to trigger a proper new (or add-on) technical buy signal. Its 50 DMA line defines important support to watch.
>>> The latest Featured Stock Update with an annotated graph appeared on 6/18/2012. Click here.
View all notes |
Alert me of new notes |
CANSLIM.net Company Profile |
SEC |
Zacks Reports |
StockTalk |
News |
Chart |
Request a new note
C
A N
S L
I M
|
TNGO
-
NASDAQ
Tangoe Inc
COMPUTER SOFTWARE and SERVICES - Technical and System Software
|
$22.17
|
-0.35
-1.55% |
$22.60
|
392,679
73.33% of 50 DAV
50 DAV is 535,500
|
$23.05
-3.82%
|
6/27/2012
|
$21.70
|
PP = $23.15
|
|
MB = $24.31
|
Most Recent Note - 7/3/2012 1:51:32 PM
Y - Finished near the session high with a gain on light volume today. Gains above the pivot point backed by +40% above average volume or greater could trigger a new technical buy signal.
>>> The latest Featured Stock Update with an annotated graph appeared on 6/28/2012. Click here.
View all notes |
Alert me of new notes |
CANSLIM.net Company Profile |
SEC |
Zacks Reports |
StockTalk |
News |
Chart |
Request a new note
C
A N
S L
I M
|
VSI
-
NYSE
Vitamin Shoppe Inc
SPECIALTY RETAIL - Specialty Retail, Other
|
$56.75
|
+0.70
1.25% |
$57.52
|
296,611
57.72% of 50 DAV
50 DAV is 513,900
|
$56.62
0.23%
|
6/29/2012
|
$54.93
|
PP = $55.03
|
|
MB = $57.78
|
Most Recent Note - 7/2/2012 5:24:43 PM
Y - Gain today with below average volume led to its best-ever close and a new 52-week high above the new pivot point cited based on its 6/22/12 high after forming an 8-week cup-with-handle base. Volume was not sufficient to trigger a proper new (or add-on) technical buy signal. See the latest FSU analysis for more details and a new annotated graph.
>>> The latest Featured Stock Update with an annotated graph appeared on 7/2/2012. Click here.
View all notes |
Alert me of new notes |
CANSLIM.net Company Profile |
SEC |
Zacks Reports |
StockTalk |
News |
Chart |
Request a new note
C
A N
S L
I M
|
WFM
-
NASDAQ
Whole Foods Market Inc
RETAIL - Grocery Stores
|
$96.29
|
+0.50
0.52% |
$96.90
|
1,352,087
66.37% of 50 DAV
50 DAV is 2,037,100
|
$97.25
-0.99%
|
6/13/2012
|
$89.90
|
PP = $91.60
|
|
MB = $96.18
|
Most Recent Note - 7/5/2012 1:12:05 PM
G - Color code is changed to green after inching above its "max buy" level. Recently hovering near its 52-week high with no resistance remaining due to overhead supply. Its prior highs in the $91.50 area define initial support to watch on pullbacks.
>>> The latest Featured Stock Update with an annotated graph appeared on 6/13/2012. Click here.
View all notes |
Alert me of new notes |
CANSLIM.net Company Profile |
SEC |
Zacks Reports |
StockTalk |
News |
Chart |
Request a new note
C
A N
S L
I M
|
Symbol/Exchange
Company Name
Industry Group |
PRICE |
CHANGE
(%Change) |
Day High |
Volume
(% DAV)
(% 50 day avg vol) |
52 Wk Hi
% From Hi |
Featured
Date |
Price
Featured |
Pivot Featured |
|
Max Buy |