***Last / Change / Volume data in this table is the closing quote data***
Symbol/Exchange
Company Name
Industry Group |
PRICE |
CHANGE
(%Change) |
Day High |
Volume
(% DAV)
(% 50 day avg vol) |
52 Wk Hi
% From Hi |
Featured
Date |
Price
Featured |
Pivot Featured |
|
Max Buy |
ALXN
-
NASDAQ
Alexion Pharmaceuticals
DRUGS - Drug Manufacturers - Other
|
$103.74
|
-0.09
-0.09% |
$104.31
|
711,101
32.05% of 50 DAV
50 DAV is 2,218,800
|
$104.38
-0.61%
|
5/1/2012
|
$91.73
|
PP = $95.11
|
|
MB = $99.87
|
Most Recent Note - 7/2/2012 4:13:39 PM
G - Gain with near average volume today led to a rally above its "max buy" level and its color code is changed to green. Prior highs in the $95 area define support to watch on pullbacks.
>>> The latest Featured Stock Update with an annotated graph appeared on 6/29/2012. Click here.
View all notes |
Alert me of new notes |
CANSLIM.net Company Profile |
SEC |
Zacks Reports |
StockTalk |
News |
Chart |
Request a new note
C
A N
S L
I M


|
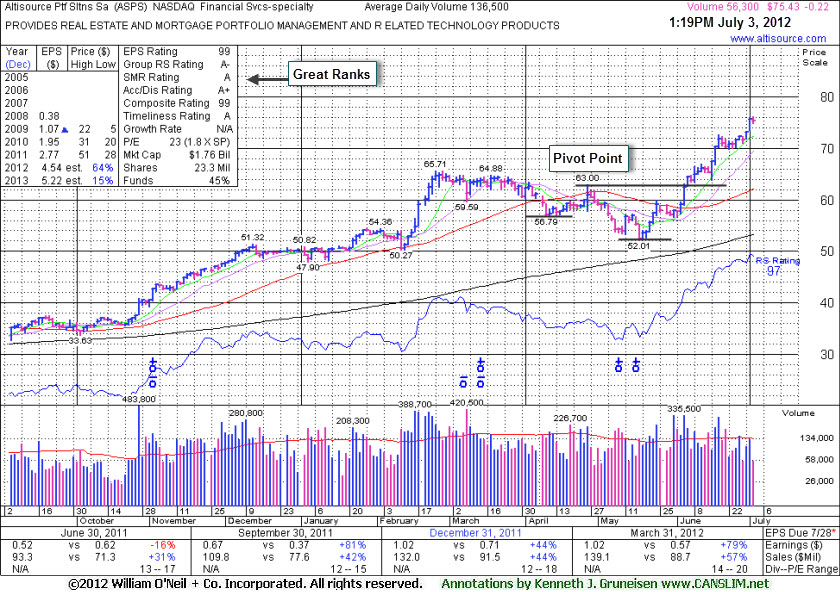
ASPS
-
NASDAQ
Altisource Ptf Sltns Sa
REAL ESTATE - Property Management/Developmen
|
$75.43
|
-0.22
-0.29% |
$76.20
|
56,360
41.29% of 50 DAV
50 DAV is 136,500
|
$75.94
-0.67%
|
6/5/2012
|
$60.01
|
PP = $63.00
|
|
MB = $66.15
|
 Most Recent Note - 7/3/2012 1:59:50 PM
G - Holding its ground near its 52-week high, extended from its prior base. Prior highs in the $65 area define support to watch on pullbacks. See the latest FSU analysis for more details and a new annotated graph.
>>> The latest Featured Stock Update with an annotated graph appeared on 7/3/2012. Click here.
View all notes |
Alert me of new notes |
CANSLIM.net Company Profile |
SEC |
Zacks Reports |
StockTalk |
News |
Chart |
Request a new note
C
A N
S L
I M
|
CERN
-
NASDAQ
Cerner Corp
COMPUTER SOFTWARE and SERVICES - Healthcare Information Service
|
$83.56
|
+0.84
1.02% |
$83.70
|
624,314
39.98% of 50 DAV
50 DAV is 1,561,500
|
$88.32
-5.39%
|
6/7/2012
|
$78.36
|
PP = $84.20
|
|
MB = $88.41
|
Most Recent Note - 6/29/2012 5:44:17 PM
G - Considerable gap up gain with above average volume, rebounding above its 50 DMA line and helping its technical stance, however it has not formed a proper base since negating its prior breakout.
>>> The latest Featured Stock Update with an annotated graph appeared on 6/7/2012. Click here.
View all notes |
Alert me of new notes |
CANSLIM.net Company Profile |
SEC |
Zacks Reports |
StockTalk |
News |
Chart |
Request a new note
C
A N
S L
I M
|
CMCSA
-
NASDAQ
Comcast Corp Cl A
MEDIA - CATV Systems
|
$32.03
|
-0.23
-0.70% |
$32.40
|
8,007,986
56.06% of 50 DAV
50 DAV is 14,284,600
|
$32.50
-1.45%
|
6/11/2012
|
$29.94
|
PP = $30.98
|
|
MB = $32.53
|
Most Recent Note - 6/29/2012 5:46:49 PM
Y - Posted a big gain today with above average volume for a new 52-week high and finished at the session high, rallying unhindered by overhead supply and approaching its "max buy" level.
>>> The latest Featured Stock Update with an annotated graph appeared on 6/11/2012. Click here.
View all notes |
Alert me of new notes |
CANSLIM.net Company Profile |
SEC |
Zacks Reports |
StockTalk |
News |
Chart |
Request a new note
C
A N
S L
I M
|
CSTR
-
NASDAQ
Coinstar Inc
DIVERSIFIED SERVICES - Personal Services
|
$70.46
|
+1.81
2.64% |
$70.63
|
1,130,667
103.58% of 50 DAV
50 DAV is 1,091,600
|
$69.74
1.03%
|
6/26/2012
|
$64.05
|
PP = $67.00
|
|
MB = $70.35
|
Most Recent Note - 7/3/2012 1:54:48 PM
G - Hit another new 52-week high today and finished above its "max buy" level. Color code is changed to green while getting extended from its prior base.
>>> The latest Featured Stock Update with an annotated graph appeared on 6/26/2012. Click here.
View all notes |
Alert me of new notes |
CANSLIM.net Company Profile |
SEC |
Zacks Reports |
StockTalk |
News |
Chart |
Request a new note
C
A N
S L
I M
|
Symbol/Exchange
Company Name
Industry Group |
PRICE |
CHANGE
(%Change) |
Day High |
Volume
(% DAV)
(% 50 day avg vol) |
52 Wk Hi
% From Hi |
Featured
Date |
Price
Featured |
Pivot Featured |
|
Max Buy |
DG
-
NYSE
Dollar General Corp
RETAIL - Discount, Variety Stores
|
$53.76
|
-0.97
-1.77% |
$54.83
|
2,342,499
61.43% of 50 DAV
50 DAV is 3,813,500
|
$55.30
-2.78%
|
5/7/2012
|
$48.51
|
PP = $47.69
|
|
MB = $50.07
|
Most Recent Note - 6/29/2012 5:49:58 PM
G - Hovering near its all-time high, extended from its prior base. Completed another Secondary Offering on 6/05/12, its 4th Secondary Offering since September '11.
>>> The latest Featured Stock Update with an annotated graph appeared on 6/12/2012. Click here.
View all notes |
Alert me of new notes |
CANSLIM.net Company Profile |
SEC |
Zacks Reports |
StockTalk |
News |
Chart |
Request a new note
C
A N
S L
I M
|
ECHO
-
NASDAQ
Echo Global Logistics
DIVERSIFIED SERVICES - Business/Management Services
|
$18.40
|
-1.05
-5.40% |
$18.89
|
355,709
329.97% of 50 DAV
50 DAV is 107,800
|
$19.48
-5.54%
|
6/22/2012
|
$18.98
|
PP = $19.48
|
|
MB = $20.45
|
Most Recent Note - 7/3/2012 11:04:37 AM
Y - Trading in the upper half of its intra-day range, rebounding from early lows after gapping down today for a damaging loss. A volume-driven gain on the prior session led to a close just 3 cents below its pivot point, almost triggering a technical buy signal under the fact-based system.
>>> The latest Featured Stock Update with an annotated graph appeared on 6/22/2012. Click here.
View all notes |
Alert me of new notes |
CANSLIM.net Company Profile |
SEC |
Zacks Reports |
StockTalk |
News |
Chart |
Request a new note
C
A N
S L
I M
|
EXPE
-
NASDAQ
Expedia Inc
INTERNET - Internet Information Providers
|
$48.67
|
-0.52
-1.06% |
$49.36
|
1,690,336
35.95% of 50 DAV
50 DAV is 4,702,200
|
$50.66
-3.93%
|
4/27/2012
|
$41.80
|
PP = $35.57
|
|
MB = $37.35
|
Most Recent Note - 7/2/2012 4:16:24 PM
G - Rallying further above its 50 DMA line, it finished -2.9% off its 52-week high with a gain on below average volume today. It is extended from its prior highs in the $43 area and its 50 DMA line which define support.
>>> The latest Featured Stock Update with an annotated graph appeared on 6/8/2012. Click here.
View all notes |
Alert me of new notes |
CANSLIM.net Company Profile |
SEC |
Zacks Reports |
StockTalk |
News |
Chart |
Request a new note
C
A N
S L
I M
|
GNC
-
NYSE
G N C Holdings Inc
RETAIL - Drug Stores
|
$41.64
|
+0.56
1.36% |
$42.30
|
2,110,122
85.29% of 50 DAV
50 DAV is 2,474,100
|
$41.95
-0.74%
|
6/29/2012
|
$39.20
|
PP = $40.00
|
|
MB = $42.00
|
Most Recent Note - 7/2/2012 12:16:02 PM
Y - Trading above the pivot point cited based upon its 5/29/12 high with today's gain. A strong finish with at least +40% above average volume may confirm a new technical buy signal from a 10-week "double bottom" type base.
>>> The latest Featured Stock Update with an annotated graph appeared on 6/6/2012. Click here.
View all notes |
Alert me of new notes |
CANSLIM.net Company Profile |
SEC |
Zacks Reports |
StockTalk |
News |
Chart |
Request a new note
C
A N
S L
I M
|
GPX
-
NYSE
G P Strategies Corp
DIVERSIFIED SERVICES - Education and Training Services
|
$18.99
|
+0.22
1.17% |
$18.99
|
47,486
83.02% of 50 DAV
50 DAV is 57,200
|
$18.82
0.93%
|
6/29/2012
|
$18.01
|
PP = $18.15
|
|
MB = $19.06
|
Most Recent Note - 7/2/2012 12:18:24 PM
Y - Holding its ground perched at its high today. Finished above the pivot point and closed near the session high with a large gain backed by +132% above average volume triggering a technical buy signal after featured in the 6/29/12 mid-day report (read here) and noted - "It cleared a valid base earlier this week with volume-driven gains and no overhead supply remains. Quarterly earnings increases above the +25% guideline in the 8 latest quarterly comparisons through Dec '11 satisfy the C criteria. Recent cluster of Insider buying in May-Jun looks similar to that which was reported in Nov, Dec, and Jan as it rose toward and above prior resistance in the $14 area. Prior reports cautioned - 'Recent quarterly comparisons show improving sales revenues and earnings increases but its annual earnings (A criteria) history falls below the investment system's guidelines.'"

There are no Featured Stock Updates™ available for this stock at this time. You may request one by clicking the Request a New Note link below
View all notes |
Alert me of new notes |
CANSLIM.net Company Profile |
SEC |
Zacks Reports |
StockTalk |
News |
Chart |
Request a new note
C
A N
S L
I M
|
Symbol/Exchange
Company Name
Industry Group |
PRICE |
CHANGE
(%Change) |
Day High |
Volume
(% DAV)
(% 50 day avg vol) |
52 Wk Hi
% From Hi |
Featured
Date |
Price
Featured |
Pivot Featured |
|
Max Buy |
MLNX
-
NASDAQ
Mellanox Technologies
ELECTRONICS - Semiconductor - Broad Line
|
$75.02
|
+2.70
3.73% |
$75.09
|
440,370
73.59% of 50 DAV
50 DAV is 598,400
|
$74.27
1.01%
|
6/18/2012
|
$70.90
|
PP = $67.30
|
|
MB = $70.67
|
Most Recent Note - 7/3/2012 1:53:01 PM
G - Today's 3rd consecutive gain on lighter volume lifted it to another new all-time high, getting more extended from its prior base. Recent chart lows define near-term support to watch above its 50 DMA line.
>>> The latest Featured Stock Update with an annotated graph appeared on 6/25/2012. Click here.
View all notes |
Alert me of new notes |
CANSLIM.net Company Profile |
SEC |
Zacks Reports |
StockTalk |
News |
Chart |
Request a new note
C
A N
S L
I M
|
N
-
NYSE
Netsuite Inc
DIVERSIFIED SERVICES - Business/Management Services
|
$55.19
|
+0.67
1.23% |
$56.06
|
357,346
64.87% of 50 DAV
50 DAV is 550,900
|
$54.89
0.55%
|
6/20/2012
|
$51.83
|
PP = $51.88
|
|
MB = $54.47
|
Most Recent Note - 7/3/2012 10:10:37 AM
G - Rallying further into new high territory today above its "max buy" level, getting extended from its prior base. No resistance remains due to overhead supply.
>>> The latest Featured Stock Update with an annotated graph appeared on 6/20/2012. Click here.
View all notes |
Alert me of new notes |
CANSLIM.net Company Profile |
SEC |
Zacks Reports |
StockTalk |
News |
Chart |
Request a new note
C
A N
S L
I M
|
NSM
-
NYSE
Nationstar Mtg Hldgs Inc
FINANCIAL SERVICES - Credit Services
|
$23.37
|
+0.97
4.33% |
$23.98
|
715,878
96.26% of 50 DAV
50 DAV is 743,700
|
$22.58
3.50%
|
6/27/2012
|
$20.29
|
PP = $20.46
|
|
MB = $21.48
|
Most Recent Note - 7/3/2012 11:10:25 AM
G - Hit yet another new 52-week high today with a 5th consecutive gain, getting extended from its prior base. Prior highs in the $20 area define important support to watch on pullbacks.
>>> The latest Featured Stock Update with an annotated graph appeared on 6/27/2012. Click here.
View all notes |
Alert me of new notes |
CANSLIM.net Company Profile |
SEC |
Zacks Reports |
StockTalk |
News |
Chart |
Request a new note
C
A N
S L
I M
|
NTES
-
NASDAQ
Netease Inc Adr
INTERNET - Internet Information Providers
|
$58.67
|
-0.34
-0.58% |
$58.91
|
479,889
64.98% of 50 DAV
50 DAV is 738,500
|
$65.54
-10.48%
|
3/19/2012
|
$56.18
|
PP = $55.10
|
|
MB = $57.86
|
Most Recent Note - 6/29/2012 6:09:21 PM
G - Small gain on light volume today, still sputtering below its 50 DMA line which has acted as resistance after a damaging violation triggered a technical sell signal. Gains above its 50 DMA line are needed for its technical stance and outlook to be considered favorable again. Found support near prior lows in the $55 area.
>>> The latest Featured Stock Update with an annotated graph appeared on 6/19/2012. Click here.
View all notes |
Alert me of new notes |
CANSLIM.net Company Profile |
SEC |
Zacks Reports |
StockTalk |
News |
Chart |
Request a new note
C
A N
S L
I M
|
SWI
-
NYSE
Solarwinds Inc
COMPUTER SOFTWARE and SERVICES - Application Software
|
$44.78
|
+0.94
2.14% |
$45.09
|
543,857
49.68% of 50 DAV
50 DAV is 1,094,700
|
$48.64
-7.94%
|
4/26/2012
|
$45.15
|
PP = $42.32
|
|
MB = $44.44
|
Most Recent Note - 7/3/2012 1:56:11 PM
G - Today's 3rd consecutive gain on lighter volume lifted it to its 50 DMA line. Gains above that short-term average would help its technical stance. The previously noted 6/04/11 low ($41.24) defines important support to watch.
>>> The latest Featured Stock Update with an annotated graph appeared on 6/15/2012. Click here.
View all notes |
Alert me of new notes |
CANSLIM.net Company Profile |
SEC |
Zacks Reports |
StockTalk |
News |
Chart |
Request a new note
C
A N
S L
I M
|
Symbol/Exchange
Company Name
Industry Group |
PRICE |
CHANGE
(%Change) |
Day High |
Volume
(% DAV)
(% 50 day avg vol) |
52 Wk Hi
% From Hi |
Featured
Date |
Price
Featured |
Pivot Featured |
|
Max Buy |
SXCI
-
NASDAQ
S X C Health Solutions
COMPUTER SOFTWARE and SERVICES - Healthcare Information Service
|
$96.86
|
-0.12
-0.12% |
$101.41
|
3,168,560
312.11% of 50 DAV
50 DAV is 1,015,200
|
$104.79
-7.57%
|
6/14/2012
|
$94.71
|
PP = $100.60
|
|
MB = $105.63
|
Most Recent Note - 7/3/2012 1:57:10 PM
Y - Reversed and closed in the red after trading up again today. Another "negative reversal" on the prior session after hitting a new 52-week high was noted as a sign it was encountering distributional pressure while poised to break out. No resistance remains due to overhead supply, and strong close above its pivot point may clinch a technical buy signal.
>>> The latest Featured Stock Update with an annotated graph appeared on 6/14/2012. Click here.
View all notes |
Alert me of new notes |
CANSLIM.net Company Profile |
SEC |
Zacks Reports |
StockTalk |
News |
Chart |
Request a new note
C
A N
S L
I M
|
TDG
-
NYSE
Transdigm Group Inc
AEROSPACE/DEFENSE - Aerospace/Defense Products and; Services
|
$133.00
|
+1.05
0.80% |
$134.19
|
204,695
36.25% of 50 DAV
50 DAV is 564,600
|
$136.34
-2.45%
|
6/18/2012
|
$127.00
|
PP = $132.79
|
|
MB = $139.43
|
Most Recent Note - 6/29/2012 6:14:41 PM
Y - Today's gain above its pivot point was backed by only +32% above average volume, below the minimum threshold need to trigger a proper new (or add-on) technical buy signal. Its 50 DMA line defines important support to watch.
>>> The latest Featured Stock Update with an annotated graph appeared on 6/18/2012. Click here.
View all notes |
Alert me of new notes |
CANSLIM.net Company Profile |
SEC |
Zacks Reports |
StockTalk |
News |
Chart |
Request a new note
C
A N
S L
I M
|
TNGO
-
NASDAQ
Tangoe Inc
COMPUTER SOFTWARE and SERVICES - Technical and System Software
|
$22.52
|
+0.96
4.45% |
$22.53
|
180,347
33.29% of 50 DAV
50 DAV is 541,700
|
$23.05
-2.30%
|
6/27/2012
|
$21.70
|
PP = $23.15
|
|
MB = $24.31
|
Most Recent Note - 7/3/2012 1:51:32 PM
Y - Finished near the session high with a gain on light volume today. Gains above the pivot point backed by +40% above average volume or greater could trigger a new technical buy signal.
>>> The latest Featured Stock Update with an annotated graph appeared on 6/28/2012. Click here.
View all notes |
Alert me of new notes |
CANSLIM.net Company Profile |
SEC |
Zacks Reports |
StockTalk |
News |
Chart |
Request a new note
C
A N
S L
I M
|
VSI
-
NYSE
Vitamin Shoppe Inc
SPECIALTY RETAIL - Specialty Retail, Other
|
$56.05
|
-0.02
-0.04% |
$56.43
|
172,463
33.49% of 50 DAV
50 DAV is 514,900
|
$56.62
-1.01%
|
6/29/2012
|
$54.93
|
PP = $55.03
|
|
MB = $57.78
|
Most Recent Note - 7/2/2012 5:24:43 PM
Y - Gain today with below average volume led to its best-ever close and a new 52-week high above the new pivot point cited based on its 6/22/12 high after forming an 8-week cup-with-handle base. Volume was not sufficient to trigger a proper new (or add-on) technical buy signal. See the latest FSU analysis for more details and a new annotated graph.
>>> The latest Featured Stock Update with an annotated graph appeared on 7/2/2012. Click here.
View all notes |
Alert me of new notes |
CANSLIM.net Company Profile |
SEC |
Zacks Reports |
StockTalk |
News |
Chart |
Request a new note
C
A N
S L
I M
|
WFM
-
NASDAQ
Whole Foods Market Inc
RETAIL - Grocery Stores
|
$95.79
|
+1.16
1.23% |
$95.95
|
842,668
41.21% of 50 DAV
50 DAV is 2,044,700
|
$97.25
-1.50%
|
6/13/2012
|
$89.90
|
PP = $91.60
|
|
MB = $96.18
|
Most Recent Note - 6/29/2012 6:24:00 PM
Y - Hovering near its 52-week high today with no resistance remaining due to overhead supply. Its prior highs in the $91.50 area define initial support to watch on pullbacks.
>>> The latest Featured Stock Update with an annotated graph appeared on 6/13/2012. Click here.
View all notes |
Alert me of new notes |
CANSLIM.net Company Profile |
SEC |
Zacks Reports |
StockTalk |
News |
Chart |
Request a new note
C
A N
S L
I M
|
Symbol/Exchange
Company Name
Industry Group |
PRICE |
CHANGE
(%Change) |
Day High |
Volume
(% DAV)
(% 50 day avg vol) |
52 Wk Hi
% From Hi |
Featured
Date |
Price
Featured |
Pivot Featured |
|
Max Buy |