You are not logged in.
This means you
CAN ONLY VIEW reports that were published prior to Monday, April 14, 2025.
You
MUST UPGRADE YOUR MEMBERSHIP if you want to see any current reports.
AFTER MARKET UPDATE - TUESDAY, JULY 2ND, 2013
Previous After Market Report Next After Market Report >>>
|
|
|
|
DOW |
-42.55 |
14,932.41 |
-0.28% |
|
Volume |
716,701,660 |
+0% |
|
Volume |
1,643,595,050 |
+7% |
|
NASDAQ |
-1.09 |
3,433.40 |
-0.03% |
|
Advancers |
1,190 |
38% |
|
Advancers |
1,227 |
47% |
|
S&P 500 |
-0.88 |
1,614.08 |
-0.05% |
|
Decliners |
1,850 |
59% |
|
Decliners |
1,283 |
49% |
|
Russell 2000 |
-0.37 |
989.47 |
-0.04% |
|
52 Wk Highs |
121 |
|
|
52 Wk Highs |
190 |
|
|
S&P 600 |
+0.68 |
559.16 |
+0.12% |
|
52 Wk Lows |
30 |
|
|
52 Wk Lows |
19 |
|
|
 |
Indices Erased Early Gains
Kenneth J. Gruneisen - Passed the CAN SLIM® Master's Exam
The major averages ended lower on Tuesday's session after erasing early gains. The volume totals were reported slightly higher than the prior session totals on the NYSE and on the Nasdaq exchange. Decliners outnumbered advancers by a 3-2 margin on the NYSE while the mix was very near even on the Nasdaq exchange. There were 48 high-ranked companies from the CANSLIM.net Leaders List made new 52-week highs and appeared on the CANSLIM.net BreakOuts Page, down from the prior session total of 70 stocks. The list of stocks hitting new 52-week highs easily outnumbered new 52-week lows on both the NYSE and the Nasdaq exchange. There were gains for 4 of the 8 high-ranked companies currently included on the Featured Stocks Page.
Investors were optimistic heading into Tuesday's opening bell after the Reserve Bank of Australia maintained their current policy measures. Investors also respond to a slightly better-than-expected report on May factory orders.
Early gains were led by the energy sector as crude oil prices advanced +0.9% to $98.88 per barrel, but Chevron Corp (CVX +0.06%) shares erased most of their early gains. Automobile stocks also showed strength following some encouraging June sales metrics. Ford Motors (F +2.80%) outpaced the new General Motors Company (GM +0.29%) after both companies topped monthly sales estimates.
On the earnings front, Constellation Brands Inc (STZ -3.57%) fell as the company fell short of analysts' expectations in the quarter. Shares of game developer Zynga Inc (ZNGA +6.50%) rallied on news that Microsoft Corp (MSFT -1.22%) executive Don Mattrick will step in as CEO of the company. In other news, Achillion Pharmaceuticals Inc (ACHN -25.12%) shares fell hard after the FDA put a hold on the company's oral hepatitis C treatment, citing safety concerns.
Disciplined investors will note that the window is now open for the market (M criteria) to produce a follow-through day within the most ideal period between days 4-7 of a new rally attempt. In spite of the recent rebound there is still a need for caution until a new rally is confirmed by a proper follow-through day (FTD) of meaningful gains (+1.4% or greater) from at least one of the major averages on higher volume coupled with an expansion in leadership (stocks hitting new 52-week highs). Wednesday's session marks Day 7 of the current rally attempt, a rally attempt that will remain valid unless the Day 1 lows are violated which would clearly indicate deterioration and signal that the correction is worsening.
Upcoming CANSLIM.net reports will observe and explain any noteworthy shifts in the market direction (M criteria) while especially highlighting the characteristics and important details in the bold portion of this commentary. Regular readers are aware via prior reports since early June repeatedly reminding members - "Be protective of any gains, and limit losses! Be especially watchful for any individual issues flashing technical sell signals. It is vitally important to your success with the fact-based investment system to reduce exposure and preserve cash during market downdrafts."
Individual leaders best matching the winning models of the fact-based investment system are on the Featured Stocks Page - with our Certified experts' latest notes and links to additional resources including detailed analysis with annotated graphs. The Premium Member Homepage - includes "dynamic archives" to all prior pay reports published. Watch for an announcement via email concerning the next WEBCAST.
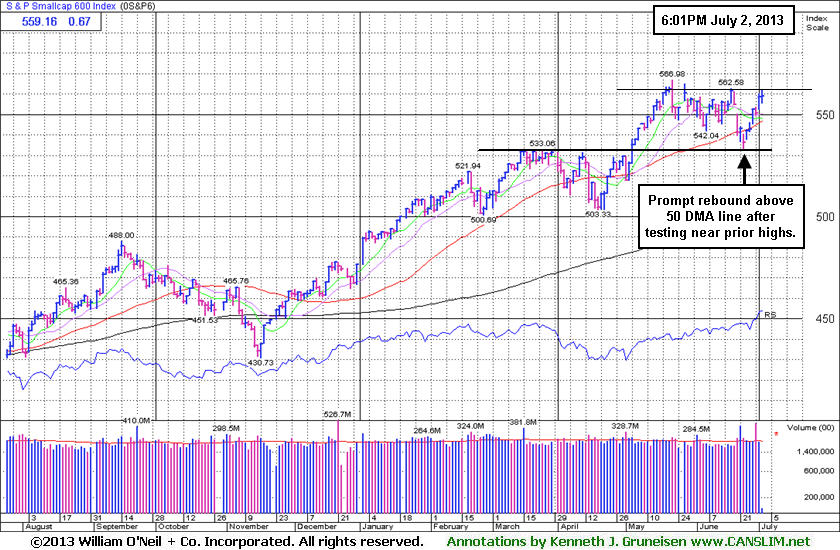
PICTURED: The S&P Small Cap 600 Index promptly rebounded above its 50-day moving average (DMA) line after finding support near prior highs. It is perched within close striking distance of its best-ever close and all-time highs.
|
 Kenneth J. Gruneisen started out as a licensed stockbroker in August 1987, a couple of months prior to the historic stock market crash that took the Dow Jones Industrial Average down -22.6% in a single day. He has published daily fact-based fundamental and technical analysis on high-ranked stocks online for two decades. Through FACTBASEDINVESTING.COM, Kenneth provides educational articles, news, market commentary, and other information regarding proven investment systems that work in good times and bad.
Comments contained in the body of this report are technical opinions only and are not necessarily those of Gruneisen Growth Corp. The material herein has been obtained from sources believed to be reliable and accurate, however, its accuracy and completeness cannot be guaranteed. Our firm, employees, and customers may effect transactions, including transactions contrary to any recommendation herein, or have positions in the securities mentioned herein or options with respect thereto. Any recommendation contained in this report may not be suitable for all investors and it is not to be deemed an offer or solicitation on our part with respect to the purchase or sale of any securities. |
|
 |
Gains for Bank, Retail, and Oil Services Indexes
Kenneth J. Gruneisen - Passed the CAN SLIM® Master's Exam
The Bank Index ($BKX +0.55%) and the Retail Index ($RLX +0.42%) tallied influential gains and the Oil Services Index ($OSX +0.43%) also held a modest gain into the close on Tuesday, meanwhile other groups, including the Integrated Oil Index ($XOI -0.31%), slumped into the red. The Internet Index ($IIX -0.67%) and Networking Index ($NWX -0.33%) led the tech sector lower, while the Biotechnology Index ($BTK -0.14%) finished with a smaller loss and the Semiconductor Index ($SOX +0.10%) eked out a small gain. The Broker/Dealer Index ($XBD -0.15%) edged lower. In defensive areas, the Healthcare Index ($HMO -0.44%) suffered a modest loss, meanwhile, the Gold & Silver Index ($XAU -4.17%) was a standout decliner.
Charts courtesy www.stockcharts.com
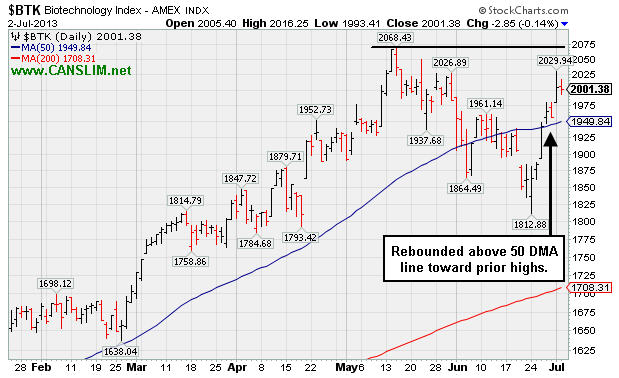
PICTURED: The Biotechnology Index ($BTK -0.14%) rebounded above its 50-day moving average (DMA) in late-June, rallying toward prior highs.
| Oil Services |
$OSX |
256.99 |
+1.11 |
+0.43% |
+16.73% |
| Healthcare |
$HMO |
3,223.03 |
-14.40 |
-0.44% |
+28.19% |
| Integrated Oil |
$XOI |
1,330.84 |
-4.09 |
-0.31% |
+7.17% |
| Semiconductor |
$SOX |
468.18 |
+0.45 |
+0.10% |
+21.90% |
| Networking |
$NWX |
259.37 |
-0.85 |
-0.33% |
+14.49% |
| Internet |
$IIX |
378.23 |
-2.57 |
-0.67% |
+15.67% |
| Broker/Dealer |
$XBD |
127.42 |
-0.20 |
-0.15% |
+35.08% |
| Retail |
$RLX |
800.31 |
+3.37 |
+0.42% |
+22.55% |
| Gold & Silver |
$XAU |
87.66 |
-3.81 |
-4.17% |
-47.07% |
| Bank |
$BKX |
62.30 |
+0.34 |
+0.55% |
+21.49% |
| Biotech |
$BTK |
2,001.38 |
-2.85 |
-0.14% |
+29.37% |
|
|
|
 |
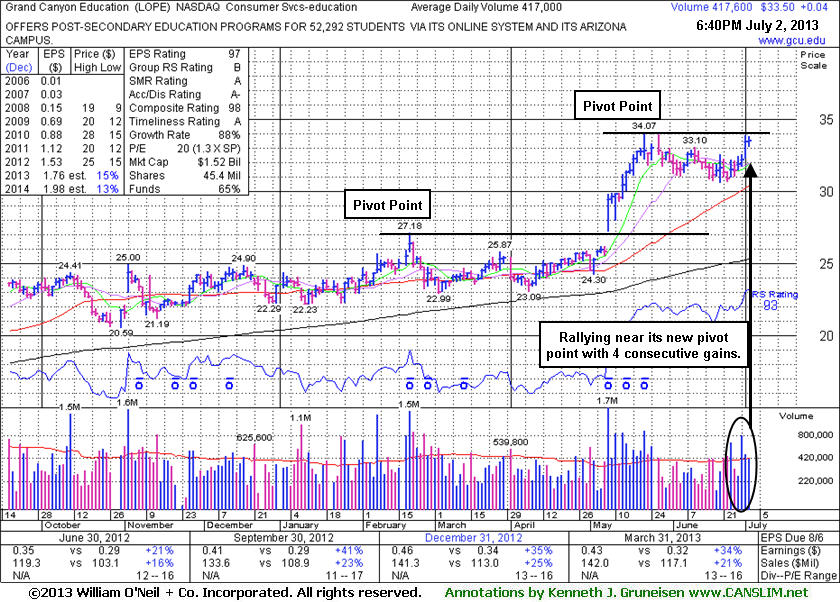
Formed New Base While Perched Near All-Time Highs
Kenneth J. Gruneisen - Passed the CAN SLIM® Master's Exam
Grand Canyon Education (LOPE +$0.04 or +0.12% to $33.50) managed its best-ever close today with a small gain backed by average volume. Its 50-day moving average (DMA) line and recent lows define important near-term support in the $30-31 area. LOPE was last shown in this FSU section on 6/19/13 with an annotated graph under the headline, "New Base Forming Following Prior Breakout and Big Gains", after a new pivot point was cited based on its 5/22/13 high plus 10 cents. Subsequent volume-driven gains may trigger a new technical buy signal.
As it made it to all-time high territory above its April 2010 high (N criteria) it was noted - "Showing bullish technical action which may mark the beginning of a meaningful and sustained advance in price." The Commercial Services - Schools group has shown leadership (L criteria) and currently has a B Rating. Its prior pivot point was based on its 2/20/13 high plus 10 cents. The breakaway gap was noted as one exception where investors may chase a stock more than +5% above its prior high or pivot point. However, buying further above prior highs increases the chances that a normal pullback may prompt disciplined investors to limit losses and sell if the stock falls more than -7% from their purchase price.
The number of top-rated funds owning its shares rose from 200 in Mar '12 to 295 in Mar '13, a reassuring trend concerning the I criteria. Its current Up/Down Volume Ratio of 1.8 is an unbiased indication that its shares have been under accumulation over the past 50 days. It most recently reported earnings +34% on +21% sales revenues for the Mar '13 quarter, and earnings increases were above the +25% minimum earnings guideline (C criteria) the past 3 quarterly comparisons. Its Relative Strength Rating (93) remains above the 80+ minimum guideline for buy candidates under the fact-based investment system.
|
|
|
Color Codes Explained :
Y - Better candidates highlighted by our
staff of experts.
G - Previously featured
in past reports as yellow but may no longer be buyable under the
guidelines.
***Last / Change / Volume data in this table is the closing quote data***
Symbol/Exchange
Company Name
Industry Group |
PRICE |
CHANGE
(%Change) |
Day High |
Volume
(% DAV)
(% 50 day avg vol) |
52 Wk Hi
% From Hi |
Featured
Date |
Price
Featured |
Pivot Featured |
|
Max Buy |
AMBA
-
NASDAQ
Ambarella Inc
ELECTRONICS - Semiconductor - Specialized
|
$16.89
|
-0.08
-0.47% |
$17.48
|
724,690
61.62% of 50 DAV
50 DAV is 1,176,000
|
$18.58
-9.10%
|
5/6/2013
|
$15.31
|
PP = $16.10
|
|
MB = $16.91
|
Most Recent Note - 7/1/2013 1:08:51 PM
G - Color code is changed to green after rising back above its "max buy" level. Found support while recently consolidating above its 50 DMA line - important chart support where a violation would trigger a worrisome technical sell signal.
>>> The latest Featured Stock Update with an annotated graph appeared on 6/27/2013. Click here.
View all notes |
Alert me of new notes |
CANSLIM.net Company Profile |
SEC |
Zacks Reports |
StockTalk |
News |
Chart |
Request a new note
C
A N
S L
I M


|
EQM
-
NYSE
E Q T Midstream Partners
ENERGY - Oil and Gas Pipelines
|
$46.86
|
-0.95
-1.99% |
$48.61
|
129,485
86.67% of 50 DAV
50 DAV is 149,400
|
$51.72
-9.40%
|
4/25/2013
|
$40.16
|
PP = $40.84
|
|
MB = $42.88
|
Most Recent Note - 7/1/2013 12:30:11 PM
G - Testing support at its 50 DMA line ($47.11) with today's 2nd consecutive loss backed by above average volume. Below that short-term average, the prior low ($44.83 on 6/05/13) defines the next important support level.
>>> The latest Featured Stock Update with an annotated graph appeared on 7/1/2013. Click here.
View all notes |
Alert me of new notes |
CANSLIM.net Company Profile |
SEC |
Zacks Reports |
StockTalk |
News |
Chart |
Request a new note
C
A N
S L
I M
|
FLT
-
NYSE
Fleetcor Technologies
DIVERSIFIED SERVICES - Business/Management Services
|
$82.41
|
-0.47
-0.57% |
$83.60
|
556,010
60.18% of 50 DAV
50 DAV is 923,900
|
$89.75
-8.18%
|
5/29/2013
|
$86.02
|
PP = $85.66
|
|
MB = $89.94
|
Most Recent Note - 6/28/2013 6:25:18 PM
G- Endured distributional pressure and slumped to close the week below its 50 DMA line raising concerns and its color code is changed to green. See the latest FSU analysis for more details and a new annotated graph.
>>> The latest Featured Stock Update with an annotated graph appeared on 6/28/2013. Click here.
View all notes |
Alert me of new notes |
CANSLIM.net Company Profile |
SEC |
Zacks Reports |
StockTalk |
News |
Chart |
Request a new note
C
A N
S L
I M
|
LOPE
-
NASDAQ
Grand Canyon Education
DIVERSIFIED SERVICES - Education and; Training Services
|
$33.50
|
+0.04
0.12% |
$33.83
|
418,209
100.29% of 50 DAV
50 DAV is 417,000
|
$34.07
-1.67%
|
6/19/2013
|
$31.47
|
PP = $34.17
|
|
MB = $35.88
|
 Most Recent Note - 7/2/2013 6:57:14 PM
Y - Finished at a best-ever close today with a gain backed by average volume. Its 50 DMA line and recent lows define support in the $30-31 area. Subsequent volume driven gains above its pivot point may trigger a new technical buy signal. See the latest FSU analysis for more details and a new annotated graph.
>>> The latest Featured Stock Update with an annotated graph appeared on 7/2/2013. Click here.
View all notes |
Alert me of new notes |
CANSLIM.net Company Profile |
SEC |
Zacks Reports |
StockTalk |
News |
Chart |
Request a new note
C
A N
S L
I M
|
PRAA
-
NASDAQ
Portfolio Recovery Assoc
DIVERSIFIED SERVICES - Business/Management Services
|
$158.68
|
+0.71
0.45% |
$159.68
|
95,651
111.61% of 50 DAV
50 DAV is 85,700
|
$163.87
-3.17%
|
5/1/2013
|
$130.77
|
PP = $127.88
|
|
MB = $134.27
|
Most Recent Note - 6/28/2013 6:41:46 PM
G - Endured a loss on heavy volume. Extended from any sound base, it rallied with no resistance due to overhead supply. Its 50 DMA line defines important near-term chart support.
>>> The latest Featured Stock Update with an annotated graph appeared on 6/25/2013. Click here.
View all notes |
Alert me of new notes |
CANSLIM.net Company Profile |
SEC |
Zacks Reports |
StockTalk |
News |
Chart |
Request a new note
C
A N
S L
I M
|
Symbol/Exchange
Company Name
Industry Group |
PRICE |
CHANGE
(%Change) |
Day High |
Volume
(% DAV)
(% 50 day avg vol) |
52 Wk Hi
% From Hi |
Featured
Date |
Price
Featured |
Pivot Featured |
|
Max Buy |
PRLB
-
NYSE
Proto Labs Inc
MANUFACTURING - Small Tools and Accessories
|
$63.57
|
-2.26
-3.43% |
$66.42
|
617,233
121.72% of 50 DAV
50 DAV is 507,100
|
$67.40
-5.68%
|
6/17/2013
|
$59.37
|
PP = $59.94
|
|
MB = $62.94
|
Most Recent Note - 7/2/2013 7:00:27 PM
G- Encountered more distributional pressure today after a "negative reversal" on 6/28/13 at its 52-week high. Prior highs near $59 define important near-term support.
>>> The latest Featured Stock Update with an annotated graph appeared on 6/26/2013. Click here.
View all notes |
Alert me of new notes |
CANSLIM.net Company Profile |
SEC |
Zacks Reports |
StockTalk |
News |
Chart |
Request a new note
C
A N
S L
I M
|
RRTS
-
NYSE
Roadrunner Trans Systems
TRANSPORTATION - Air Delivery and Freight Service
|
$28.41
|
+0.13
0.46% |
$28.47
|
139,972
68.01% of 50 DAV
50 DAV is 205,800
|
$29.52
-3.76%
|
4/3/2013
|
$22.77
|
PP = $23.75
|
|
MB = $24.94
|
Most Recent Note - 7/1/2013 1:06:40 PM
G - Wedging higher without great volume conviction after finding support above its 50 DMA line, and it is perched within close striking distance of its 52-week high. Fundamental concerns were raised by its sub par earnings increase in the Mar '13 quarter.
>>> The latest Featured Stock Update with an annotated graph appeared on 6/20/2013. Click here.
View all notes |
Alert me of new notes |
CANSLIM.net Company Profile |
SEC |
Zacks Reports |
StockTalk |
News |
Chart |
Request a new note
C
A N
S L
I M
|
VRX
-
NYSE
Valeant Pharmaceuticals
DRUGS - Drug Manufacturers - Other
|
$89.99
|
+1.99
2.26% |
$90.44
|
2,481,001
119.73% of 50 DAV
50 DAV is 2,072,100
|
$96.25
-6.50%
|
4/30/2013
|
$60.24
|
PP = $76.66
|
|
MB = $80.49
|
Most Recent Note - 7/1/2013 1:04:18 PM
G- Small gap up today. Held its ground since completing a new Public Offering on 6/18/13 following recent M&A news. Concerns were raised by its sub par Mar '13 earnings report.
>>> The latest Featured Stock Update with an annotated graph appeared on 6/24/2013. Click here.
View all notes |
Alert me of new notes |
CANSLIM.net Company Profile |
SEC |
Zacks Reports |
StockTalk |
News |
Chart |
Request a new note
C
A N
S L
I M
|
|
|
|
THESE ARE NOT BUY RECOMMENDATIONS!
Comments contained in the body of this report are technical
opinions only. The material herein has been obtained
from sources believed to be reliable and accurate, however,
its accuracy and completeness cannot be guaranteed.
This site is not an investment advisor, hence it does
not endorse or recommend any securities or other investments.
Any recommendation contained in this report may not
be suitable for all investors and it is not to be deemed
an offer or solicitation on our part with respect to
the purchase or sale of any securities. All trademarks,
service marks and trade names appearing in this report
are the property of their respective owners, and are
likewise used for identification purposes only.
This report is a service available
only to active Paid Premium Members.
You may opt-out of receiving report notifications
at any time. Questions or comments may be submitted
by writing to Premium Membership Services 665 S.E. 10 Street, Suite 201 Deerfield Beach, FL 33441-5634 or by calling 1-800-965-8307
or 954-785-1121.
|
|
|

