***Last / Change / Volume data in this table is the closing quote data***
Symbol/Exchange
Company Name
Industry Group |
PRICE |
CHANGE
(%Change) |
Day High |
Volume
(% DAV)
(% 50 day avg vol) |
52 Wk Hi
% From Hi |
Featured
Date |
Price
Featured |
Pivot Featured |
|
Max Buy |
ALXN
-
NASDAQ
Alexion Pharmaceuticals
DRUGS - Drug Manufacturers - Other
|
$103.83
|
+4.53
4.56% |
$104.38
|
2,252,349
102.74% of 50 DAV
50 DAV is 2,192,200
|
$99.70
4.14%
|
5/1/2012
|
$91.73
|
PP = $95.11
|
|
MB = $99.87
|
 Most Recent Note - 7/2/2012 4:13:39 PM
G - Gain with near average volume today led to a rally above its "max buy" level and its color code is changed to green. Prior highs in the $95 area define support to watch on pullbacks.
>>> The latest Featured Stock Update with an annotated graph appeared on 6/29/2012. Click here.
View all notes |
Alert me of new notes |
CANSLIM.net Company Profile |
SEC |
Zacks Reports |
StockTalk |
News |
Chart |
Request a new note
C
A N
S L
I M


|
ASPS
-
NASDAQ
Altisource Ptf Sltns Sa
REAL ESTATE - Property Management/Developmen
|
$75.65
|
+2.42
3.30% |
$75.94
|
132,678
96.56% of 50 DAV
50 DAV is 137,400
|
$73.23
3.30%
|
6/5/2012
|
$60.01
|
PP = $63.00
|
|
MB = $66.15
|
Most Recent Note - 7/2/2012 4:14:20 PM
G - Hit another new 52-week high today with a gain on near average volume. Previously noted - "Prior highs in the $65 area define initial support to watch on pullbacks, meanwhile it is getting extended from its prior base."
>>> The latest Featured Stock Update with an annotated graph appeared on 6/5/2012. Click here.
View all notes |
Alert me of new notes |
CANSLIM.net Company Profile |
SEC |
Zacks Reports |
StockTalk |
News |
Chart |
Request a new note
C
A N
S L
I M
|
CERN
-
NASDAQ
Cerner Corp
COMPUTER SOFTWARE and SERVICES - Healthcare Information Service
|
$82.72
|
+0.06
0.07% |
$83.54
|
1,401,414
90.58% of 50 DAV
50 DAV is 1,547,200
|
$88.32
-6.34%
|
6/7/2012
|
$78.36
|
PP = $84.20
|
|
MB = $88.41
|
Most Recent Note - 6/29/2012 5:44:17 PM
G - Considerable gap up gain with above average volume, rebounding above its 50 DMA line and helping its technical stance, however it has not formed a proper base since negating its prior breakout.
>>> The latest Featured Stock Update with an annotated graph appeared on 6/7/2012. Click here.
View all notes |
Alert me of new notes |
CANSLIM.net Company Profile |
SEC |
Zacks Reports |
StockTalk |
News |
Chart |
Request a new note
C
A N
S L
I M
|
CMCSA
-
NASDAQ
Comcast Corp Cl A
MEDIA - CATV Systems
|
$32.26
|
+0.29
0.89% |
$32.50
|
11,753,256
82.01% of 50 DAV
50 DAV is 14,331,200
|
$31.99
0.83%
|
6/11/2012
|
$29.94
|
PP = $30.98
|
|
MB = $32.53
|
Most Recent Note - 6/29/2012 5:46:49 PM
Y - Posted a big gain today with above average volume for a new 52-week high and finished at the session high, rallying unhindered by overhead supply and approaching its "max buy" level.
>>> The latest Featured Stock Update with an annotated graph appeared on 6/11/2012. Click here.
View all notes |
Alert me of new notes |
CANSLIM.net Company Profile |
SEC |
Zacks Reports |
StockTalk |
News |
Chart |
Request a new note
C
A N
S L
I M
|
CSTR
-
NASDAQ
Coinstar Inc
DIVERSIFIED SERVICES - Personal Services
|
$68.65
|
-0.01
-0.01% |
$69.50
|
1,059,388
96.95% of 50 DAV
50 DAV is 1,092,700
|
$69.74
-1.56%
|
6/26/2012
|
$64.05
|
PP = $67.00
|
|
MB = $70.35
|
Most Recent Note - 6/29/2012 5:49:11 PM
Y - Gapped up today and posted a gain with +42% above average volume, near the bare minimum volume threshold, yet finishing above its pivot point confirming a technical buy signal.
>>> The latest Featured Stock Update with an annotated graph appeared on 6/26/2012. Click here.
View all notes |
Alert me of new notes |
CANSLIM.net Company Profile |
SEC |
Zacks Reports |
StockTalk |
News |
Chart |
Request a new note
C
A N
S L
I M
|
Symbol/Exchange
Company Name
Industry Group |
PRICE |
CHANGE
(%Change) |
Day High |
Volume
(% DAV)
(% 50 day avg vol) |
52 Wk Hi
% From Hi |
Featured
Date |
Price
Featured |
Pivot Featured |
|
Max Buy |
DG
-
NYSE
Dollar General Corp
RETAIL - Discount, Variety Stores
|
$54.73
|
+0.34
0.63% |
$55.02
|
2,317,300
61.20% of 50 DAV
50 DAV is 3,786,600
|
$55.30
-1.03%
|
5/7/2012
|
$48.51
|
PP = $47.69
|
|
MB = $50.07
|
Most Recent Note - 6/29/2012 5:49:58 PM
G - Hovering near its all-time high, extended from its prior base. Completed another Secondary Offering on 6/05/12, its 4th Secondary Offering since September '11.
>>> The latest Featured Stock Update with an annotated graph appeared on 6/12/2012. Click here.
View all notes |
Alert me of new notes |
CANSLIM.net Company Profile |
SEC |
Zacks Reports |
StockTalk |
News |
Chart |
Request a new note
C
A N
S L
I M
|
ECHO
-
NASDAQ
Echo Global Logistics
DIVERSIFIED SERVICES - Business/Management Services
|
$19.45
|
+0.39
2.05% |
$19.48
|
251,860
240.10% of 50 DAV
50 DAV is 104,900
|
$19.38
0.36%
|
6/22/2012
|
$18.98
|
PP = $19.48
|
|
MB = $20.45
|
Most Recent Note - 6/29/2012 5:51:18 PM
Y - Gapped up today and posted a gain with +89% above average volume. Faces little resistance due to overhead supply while perched within close striking distance of its 52-week high. Disciplined investors may watch for a volume-driven gain above its pivot point to trigger a technical buy signal before action is justified under the fact-based system.
>>> The latest Featured Stock Update with an annotated graph appeared on 6/22/2012. Click here.
View all notes |
Alert me of new notes |
CANSLIM.net Company Profile |
SEC |
Zacks Reports |
StockTalk |
News |
Chart |
Request a new note
C
A N
S L
I M
|
EXPE
-
NASDAQ
Expedia Inc
INTERNET - Internet Information Providers
|
$49.19
|
+1.12
2.33% |
$49.52
|
3,526,989
75.03% of 50 DAV
50 DAV is 4,701,000
|
$50.66
-2.90%
|
4/27/2012
|
$41.80
|
PP = $35.57
|
|
MB = $37.35
|
Most Recent Note - 7/2/2012 4:16:24 PM
G - Rallying further above its 50 DMA line, it finished -2.9% off its 52-week high with a gain on below average volume today. It is extended from its prior highs in the $43 area and its 50 DMA line which define support.
>>> The latest Featured Stock Update with an annotated graph appeared on 6/8/2012. Click here.
View all notes |
Alert me of new notes |
CANSLIM.net Company Profile |
SEC |
Zacks Reports |
StockTalk |
News |
Chart |
Request a new note
C
A N
S L
I M
|
GNC
-
NYSE
G N C Holdings Inc
RETAIL - Drug Stores
|
$41.08
|
+1.88
4.80% |
$41.63
|
4,192,910
173.36% of 50 DAV
50 DAV is 2,418,600
|
$41.95
-2.07%
|
6/29/2012
|
$39.20
|
PP = $40.00
|
|
MB = $42.00
|
Most Recent Note - 7/2/2012 12:16:02 PM
Y - Trading above the pivot point cited based upon its 5/29/12 high with today's gain. A strong finish with at least +40% above average volume may confirm a new technical buy signal from a 10-week "double bottom" type base.
>>> The latest Featured Stock Update with an annotated graph appeared on 6/6/2012. Click here.
View all notes |
Alert me of new notes |
CANSLIM.net Company Profile |
SEC |
Zacks Reports |
StockTalk |
News |
Chart |
Request a new note
C
A N
S L
I M
|
GPX
-
NYSE
G P Strategies Corp
DIVERSIFIED SERVICES - Education and Training Services
|
$18.77
|
+0.30
1.62% |
$18.82
|
75,364
132.68% of 50 DAV
50 DAV is 56,800
|
$18.49
1.51%
|
6/29/2012
|
$18.01
|
PP = $18.15
|
|
MB = $19.06
|
Most Recent Note - 7/2/2012 12:18:24 PM
Y - Holding its ground perched at its high today. Finished above the pivot point and closed near the session high with a large gain backed by +132% above average volume triggering a technical buy signal after featured in the 6/29/12 mid-day report (read here) and noted - "It cleared a valid base earlier this week with volume-driven gains and no overhead supply remains. Quarterly earnings increases above the +25% guideline in the 8 latest quarterly comparisons through Dec '11 satisfy the C criteria. Recent cluster of Insider buying in May-Jun looks similar to that which was reported in Nov, Dec, and Jan as it rose toward and above prior resistance in the $14 area. Prior reports cautioned - 'Recent quarterly comparisons show improving sales revenues and earnings increases but its annual earnings (A criteria) history falls below the investment system's guidelines.'"

There are no Featured Stock Updates™ available for this stock at this time. You may request one by clicking the Request a New Note link below
View all notes |
Alert me of new notes |
CANSLIM.net Company Profile |
SEC |
Zacks Reports |
StockTalk |
News |
Chart |
Request a new note
C
A N
S L
I M
|
Symbol/Exchange
Company Name
Industry Group |
PRICE |
CHANGE
(%Change) |
Day High |
Volume
(% DAV)
(% 50 day avg vol) |
52 Wk Hi
% From Hi |
Featured
Date |
Price
Featured |
Pivot Featured |
|
Max Buy |
MLNX
-
NASDAQ
Mellanox Technologies
ELECTRONICS - Semiconductor - Broad Line
|
$72.32
|
+1.50
2.12% |
$73.62
|
730,840
116.21% of 50 DAV
50 DAV is 628,900
|
$74.27
-2.63%
|
6/18/2012
|
$70.90
|
PP = $67.30
|
|
MB = $70.67
|
Most Recent Note - 7/2/2012 12:32:27 PM
G - Perched near its all-time high, extended from its prior base. Recent chart lows define near-term support to watch above its 50 DMA line.
>>> The latest Featured Stock Update with an annotated graph appeared on 6/25/2012. Click here.
View all notes |
Alert me of new notes |
CANSLIM.net Company Profile |
SEC |
Zacks Reports |
StockTalk |
News |
Chart |
Request a new note
C
A N
S L
I M
|
N
-
NYSE
Netsuite Inc
DIVERSIFIED SERVICES - Business/Management Services
|
$54.52
|
-0.25
-0.46% |
$54.89
|
337,246
61.50% of 50 DAV
50 DAV is 548,400
|
$54.80
-0.51%
|
6/20/2012
|
$51.83
|
PP = $51.88
|
|
MB = $54.47
|
Most Recent Note - 6/29/2012 6:05:36 PM
G - Finished near the session high as a solid gain today lifted it above its "max buy" level, and its color code is changed to green. No resistance remains due to overhead supply.
>>> The latest Featured Stock Update with an annotated graph appeared on 6/20/2012. Click here.
View all notes |
Alert me of new notes |
CANSLIM.net Company Profile |
SEC |
Zacks Reports |
StockTalk |
News |
Chart |
Request a new note
C
A N
S L
I M
|
NSM
-
NYSE
Nationstar Mtg Hldgs Inc
FINANCIAL SERVICES - Credit Services
|
$22.40
|
+0.88
4.09% |
$22.58
|
963,538
132.52% of 50 DAV
50 DAV is 727,100
|
$21.64
3.51%
|
6/27/2012
|
$20.29
|
PP = $20.46
|
|
MB = $21.48
|
Most Recent Note - 7/2/2012 4:18:52 PM
G - Hit yet another new 52-week high today with a 4th consecutive gain lifting it well above its "max buy" level. Disciplined investors do not chase extended stocks more than +5% above their pivot point. Prior highs in the $20 area define important support to watch on pullbacks.
>>> The latest Featured Stock Update with an annotated graph appeared on 6/27/2012. Click here.
View all notes |
Alert me of new notes |
CANSLIM.net Company Profile |
SEC |
Zacks Reports |
StockTalk |
News |
Chart |
Request a new note
C
A N
S L
I M
|
NTES
-
NASDAQ
Netease Inc Adr
INTERNET - Internet Information Providers
|
$59.01
|
+0.16
0.27% |
$59.69
|
642,008
87.55% of 50 DAV
50 DAV is 733,300
|
$65.54
-9.96%
|
3/19/2012
|
$56.18
|
PP = $55.10
|
|
MB = $57.86
|
Most Recent Note - 6/29/2012 6:09:21 PM
G - Small gain on light volume today, still sputtering below its 50 DMA line which has acted as resistance after a damaging violation triggered a technical sell signal. Gains above its 50 DMA line are needed for its technical stance and outlook to be considered favorable again. Found support near prior lows in the $55 area.
>>> The latest Featured Stock Update with an annotated graph appeared on 6/19/2012. Click here.
View all notes |
Alert me of new notes |
CANSLIM.net Company Profile |
SEC |
Zacks Reports |
StockTalk |
News |
Chart |
Request a new note
C
A N
S L
I M
|
SWI
-
NYSE
Solarwinds Inc
COMPUTER SOFTWARE and SERVICES - Application Software
|
$43.84
|
+0.28
0.64% |
$44.24
|
771,920
70.62% of 50 DAV
50 DAV is 1,093,000
|
$48.64
-9.87%
|
4/26/2012
|
$45.15
|
PP = $42.32
|
|
MB = $44.44
|
Most Recent Note - 6/29/2012 6:10:40 PM
G - Gapped up today yet it remains below its 50 DMA line. A rebound above that short-term average would help its technical stance. The previously noted 6/04/11 low ($41.24) defines important support to watch.
>>> The latest Featured Stock Update with an annotated graph appeared on 6/15/2012. Click here.
View all notes |
Alert me of new notes |
CANSLIM.net Company Profile |
SEC |
Zacks Reports |
StockTalk |
News |
Chart |
Request a new note
C
A N
S L
I M
|
Symbol/Exchange
Company Name
Industry Group |
PRICE |
CHANGE
(%Change) |
Day High |
Volume
(% DAV)
(% 50 day avg vol) |
52 Wk Hi
% From Hi |
Featured
Date |
Price
Featured |
Pivot Featured |
|
Max Buy |
SXCI
-
NASDAQ
S X C Health Solutions
COMPUTER SOFTWARE and SERVICES - Healthcare Information Service
|
$96.98
|
-2.23
-2.25% |
$104.79
|
2,193,057
212.98% of 50 DAV
50 DAV is 1,029,700
|
$103.97
-6.72%
|
6/14/2012
|
$94.71
|
PP = $100.60
|
|
MB = $105.63
|
Most Recent Note - 7/2/2012 12:53:34 PM
Y - Gapped up today and hit a new 52-week high with higher volume behind its gain. No resistance remains due to overhead supply, and strong close above its pivot point may clinch a technical buy signal.
>>> The latest Featured Stock Update with an annotated graph appeared on 6/14/2012. Click here.
View all notes |
Alert me of new notes |
CANSLIM.net Company Profile |
SEC |
Zacks Reports |
StockTalk |
News |
Chart |
Request a new note
C
A N
S L
I M
|
TDG
-
NYSE
Transdigm Group Inc
AEROSPACE/DEFENSE - Aerospace/Defense Products and; Services
|
$131.95
|
-2.35
-1.75% |
$136.34
|
714,299
126.49% of 50 DAV
50 DAV is 564,700
|
$134.43
-1.84%
|
6/18/2012
|
$127.00
|
PP = $132.79
|
|
MB = $139.43
|
Most Recent Note - 6/29/2012 6:14:41 PM
Y - Today's gain above its pivot point was backed by only +32% above average volume, below the minimum threshold need to trigger a proper new (or add-on) technical buy signal. Its 50 DMA line defines important support to watch.
>>> The latest Featured Stock Update with an annotated graph appeared on 6/18/2012. Click here.
View all notes |
Alert me of new notes |
CANSLIM.net Company Profile |
SEC |
Zacks Reports |
StockTalk |
News |
Chart |
Request a new note
C
A N
S L
I M
|
TNGO
-
NASDAQ
Tangoe Inc
COMPUTER SOFTWARE and SERVICES - Technical and System Software
|
$21.56
|
+0.25
1.17% |
$21.60
|
344,697
62.98% of 50 DAV
50 DAV is 547,300
|
$23.05
-6.46%
|
6/27/2012
|
$21.70
|
PP = $23.15
|
|
MB = $24.31
|
Most Recent Note - 6/29/2012 6:17:46 PM
Y - Rebounded above its 50 DMA line today with a gap up gain backed by above average volume indicative of institutional support near that important short-term average. Color code is changed to yellow again based on its resilience. Gains above the pivot point backed by +40% above average volume or greater could trigger a new technical buy signal.
>>> The latest Featured Stock Update with an annotated graph appeared on 6/28/2012. Click here.
View all notes |
Alert me of new notes |
CANSLIM.net Company Profile |
SEC |
Zacks Reports |
StockTalk |
News |
Chart |
Request a new note
C
A N
S L
I M
|
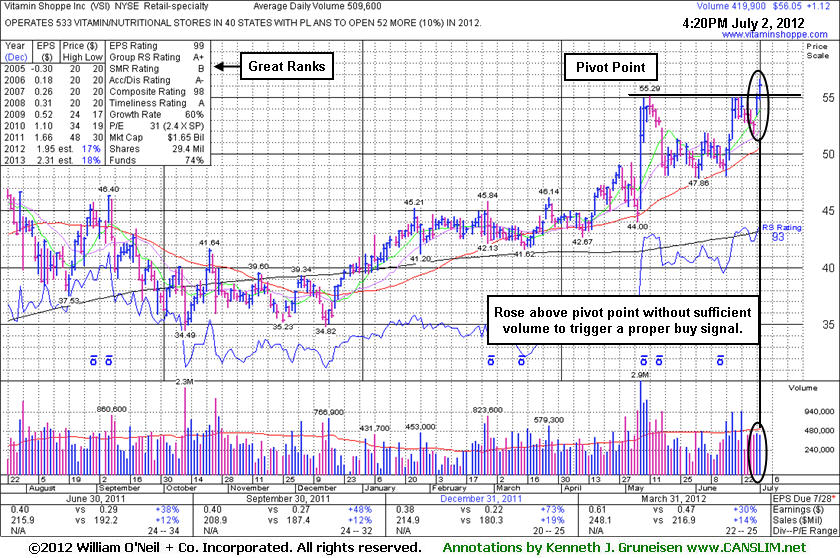
VSI
-
NYSE
Vitamin Shoppe Inc
SPECIALTY RETAIL - Specialty Retail, Other
|
$56.07
|
+1.14
2.08% |
$56.62
|
469,464
92.12% of 50 DAV
50 DAV is 509,600
|
$55.35
1.30%
|
6/29/2012
|
$54.93
|
PP = $55.03
|
|
MB = $57.78
|
Most Recent Note - 7/2/2012 5:24:43 PM
Y - Gain today with below average volume led to its best-ever close and a new 52-week high above the new pivot point cited based on its 6/22/12 high after forming an 8-week cup-with-handle base. Volume was not sufficient to trigger a proper new (or add-on) technical buy signal. See the latest FSU analysis for more details and a new annotated graph.
>>> The latest Featured Stock Update with an annotated graph appeared on 7/2/2012. Click here.
View all notes |
Alert me of new notes |
CANSLIM.net Company Profile |
SEC |
Zacks Reports |
StockTalk |
News |
Chart |
Request a new note
C
A N
S L
I M
|
WFM
-
NASDAQ
Whole Foods Market Inc
RETAIL - Grocery Stores
|
$94.63
|
-0.69
-0.72% |
$95.23
|
1,872,424
91.71% of 50 DAV
50 DAV is 2,041,700
|
$97.25
-2.69%
|
6/13/2012
|
$89.90
|
PP = $91.60
|
|
MB = $96.18
|
Most Recent Note - 6/29/2012 6:24:00 PM
Y - Hovering near its 52-week high today with no resistance remaining due to overhead supply. Its prior highs in the $91.50 area define initial support to watch on pullbacks.
>>> The latest Featured Stock Update with an annotated graph appeared on 6/13/2012. Click here.
View all notes |
Alert me of new notes |
CANSLIM.net Company Profile |
SEC |
Zacks Reports |
StockTalk |
News |
Chart |
Request a new note
C
A N
S L
I M
|
Symbol/Exchange
Company Name
Industry Group |
PRICE |
CHANGE
(%Change) |
Day High |
Volume
(% DAV)
(% 50 day avg vol) |
52 Wk Hi
% From Hi |
Featured
Date |
Price
Featured |
Pivot Featured |
|
Max Buy |