You are not logged in.
This means you
CAN ONLY VIEW reports that were published prior to Monday, April 21, 2025.
You
MUST UPGRADE YOUR MEMBERSHIP if you want to see any current reports.
AFTER MARKET UPDATE - THURSDAY, JULY 2ND, 2009
Previous After Market Report Next After Market Report >>>
|
|
|
|
DOW |
-223.32 |
8,280.74 |
-2.63% |
|
Volume |
730,929,960 |
-23% |
|
Volume |
1,993,222,150 |
-1% |
|
NASDAQ |
-49.20 |
1,796.52 |
-2.67% |
|
Advancers |
562 |
18% |
|
Advancers |
461 |
16% |
|
S&P 500 |
-26.88 |
896.45 |
-2.91% |
|
Decliners |
2,405 |
78% |
|
Decliners |
2,250 |
80% |
|
Russell 2000 |
-20.21 |
497.25 |
-3.91% |
|
52 Wk Highs |
16 |
|
|
52 Wk Highs |
13 |
|
|
S&P 600 |
-11.10 |
263.13 |
-4.05% |
|
52 Wk Lows |
2 |
|
|
52 Wk Lows |
8 |
|
|
 |
Dow & S&P 500 Are Back in Negative Territory For 2009
Adam Sarhan, Contributing Writer,
The major averages got smacked on Thursday after the Labor Department announced a weaker-than-expected jobs report for June. Volume totals were reported lighter on the NYSE and on the Nasdaq exchange as the holiday-shortened week came to a close. Decliners trumped advancers by nearly a 4-to-1 ratio on the NYSE and by a 5-to-1 ratio on the Nasdaq exchange. There were only 3 high-ranked companies from the CANSLIM.net Leaders List that made a new 52-week high and appeared on the CANSLIM.net BreakOuts Page, much lower than the 15 issues that appeared on the prior session.
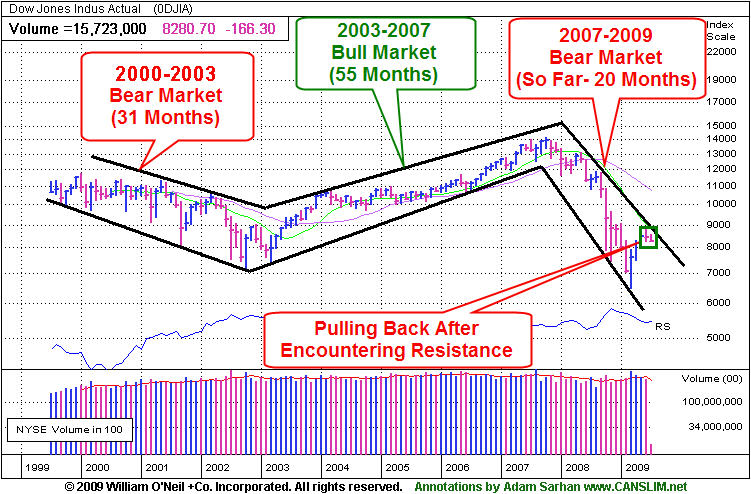
On Monday, stocks rallied as investors prepared for a shortened holiday week. In recent months, the market has enjoyed hefty gains after a flurry of stronger than expected economic data was released. The Federal Reserve Bank of Boston President Eric Rosengren said, US GDP "is expected to start being positive in the second half of this year." When questioned about unemployment he said, "The unemployment rate is likely to lag so that the peak in the unemployment rate is likely to be sometime early next year." This pretty much summarizes the Street's view on the economy. However, as the week progressed a series of distribution days showed up as the major averages failed to break above formidable long term resistance (shown above) in recent weeks.
On Tuesday, the major averages ended the last day of the second quarter lower as consumer confidence unexpectedly fell and home delinquencies more than doubled. Since early March, the small cap Russell 2000 Index has emerged as the standout winner, surging a whopping +56%! The tech-heavy Nasdaq Composite Index is a close second, after vaulting +49%. Meanwhile, the S&P 500 Index raced +44% higher and the Dow Jones Industrial Average rose +37%. It is important to note that the vast majority of stocks that helped the major averages rally were beaten down, low-ranked stocks bouncing from egregiously oversold levels, not fresh high ranked leadership! There have been a few high-ranked stocks that triggered technical buy signals over the past 17 weeks, and the vast majority of them have technically failed or they were tremendously volatile and difficult for disciplined investors to effectively trade for profits (i.e. Netflix Inc (NFLX) and Neutral Tandem Inc (TNDM). That said, until the major averages trade above their long multi-year downward trendlines, the market's sideways to lower action may likely continue. Until then, patience is necessary, and cash is king.
On Wednesday, the first trading day of the third quarter, stocks ended higher after a slew of stronger-than-expected economic data was released. Before Wednesday's opening bell, the country's largest employment services firm, ADP, said employers cut -473,000 in June. This was about the same as May's adjusted reading of a -485,000 cut. A separate report showed that factory orders rose +0.7% in April. Elsewhere, the Institute for Supply Management's (ISM) manufacturing index continued to rise toward positive territory. The index rose to 42.8 in May from 40.1 in April. The National Association of Realtors released a report which showed that pending home sales was little changed in May, at 90.7. However, the index did rise on a year-over-year basis, gaining +3.2%. A pending sale is one in which a contract for a new home was signed, but not yet closed. Normally, it takes approximately four to six weeks to close a contracted sale.
Before Thursday's opening bell, the Labor Department said US employers slashed -467,000 jobs last month as the unemployment rate rose to +9.5% which is the highest level since 1983! Almost immediately, equity futures tanked which set the stage for a down day on Wall Street. Thursday's light volume totals were below average, however there have been at least 5 or 6 distribution days for the Dow Jones Industrial Average, the benchmark S&P 500 Index, the Nasdaq Composite Index, and the NYSE Composite Index in recent weeks. In addition, the Dow Jones Industrial Average and S&P 500 index have again violated their respective 50-day moving average (DMA) lines, which puts serious pressure on the current uptrend -if not officially ending this aging rally.
For the past few weeks, we have repeatedly highlighted the shortcomings of the confirmed rally, which has just finished its 17th week. This re-emphasizes the importance of raising cash. Until a new batch of leadership emerges and the major averages rally above their respective longer-term downtrend lines (resistance), or both, the market's sideways to lower price action appears likely to continue.
PICTURED: The monthly chart of the Dow Jones Industrial Average shows prior bull and bear market phases. The blue chip index is pulling back after encountering resistance near its multi-year downward trendline.
Money Management Services - WE FOLLOW THE RULES! DOES YOUR BROKER?
Managing money can be difficult at times. Are you looking for a money manager who follows a proven set of rules? If you are frustrated because your broker/money manager does not follow all of the rules of this powerful investment system, contact us. We have veterans who have been in business for over 20 years who pride themselves on their ability to closely follow all the rules of the investment system in both bull and bear markets. All of our portfolio managers have completed the Master's Program and are highly skilled at using this powerful investment system. You may inquire about having your account professionally managed using this fact-based investment system by clicking HERE. *Accounts over $250,000 please. ** Serious inquiries only.
|
|
|
 |
No Safe Haven In Widespread Downdraft But Cash
Kenneth J. Gruneisen - Passed the CAN SLIM® Master's Exam
Broad losses on Friday led to large losses in energy-related shares and drove the Oil Services ($OSX -4.39%) and Integrated Oil ($XOI -3.47%) indexes further below their 50-day moving average (DMA) lines. The Healthcare ($HMO -4.97%) group's vital signs also slumped badly. The Retail Index ($RLX -3.96%) and the tech sector were also punished with big losses as the Biotechnology ($BTK -3.31%), Networking ($NWX -3.17%), and Internet ($IIX -2.10%) indexes outpaced the Semiconductor Index ($SOX -1.20%) on the downside.
The Gold & Silver Index ($XAU -3.00%) offered no safe haven for those seeking shelter there. Cash is currently king! Investors expecting to see commodity-linked areas rise in a typical inverse relationship with a falling US dollar might take note of the Investing For The New Millennium column titled "Down On Dollars?" published in the July 2009 issue of CANSLIM.net News earlier this week (read here).
Charts courtesy www.stockcharts.com
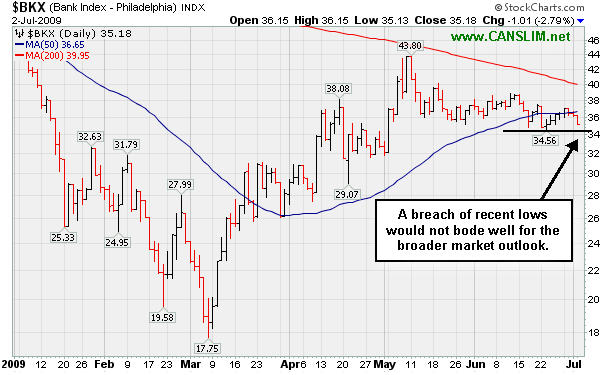
PICTURED: The Bank Index ($BKX -3.01%) has slumped under its 50-day moving average (DMA) line in recent weeks. Since financial shares are a valuable leading indicator, any breach of recent chart lows would raise concerns and hurt the near-term market outlook. On the other hand, any subsequent rally above the 200 DMA line (the red line) would be a very encouraging sign for all investors with market interest.
Charts courtesy www.stockcharts.com
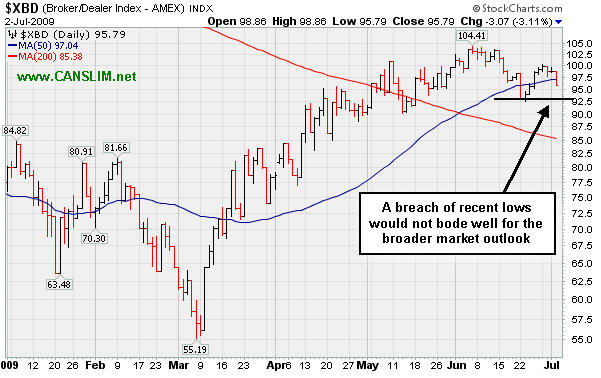
PICTURED: The Broker/Dealer Index ($XBD -3.13%) sank below ts 50 DMA line again, and a breach of recent chart lows would hurt the broader market outlook. If it eventually rallies above its June chart high (104.41) the market outlook would improve and there would be a greater likelihood of further upward momentum.
| Oil Services |
$OSX |
152.35 |
-7.00 |
-4.39% |
+25.50% |
| Healthcare |
$HMO |
1,069.72 |
-55.95 |
-4.97% |
+11.41% |
| Integrated Oil |
$XOI |
890.43 |
-32.00 |
-3.47% |
-9.11% |
| Semiconductor |
$SOX |
263.81 |
-3.21 |
-1.20% |
+24.34% |
| Networking |
$NWX |
182.25 |
-5.97 |
-3.17% |
+26.66% |
| Internet |
$IIX |
183.15 |
-3.93 |
-2.10% |
+36.91% |
| Broker/Dealer |
$XBD |
95.77 |
-3.09 |
-3.13% |
+23.62% |
| Retail |
$RLX |
308.89 |
-12.72 |
-3.96% |
+10.61% |
| Gold & Silver |
$XAU |
140.00 |
-4.33 |
-3.00% |
+13.04% |
| Bank |
$BKX |
35.10 |
-1.09 |
-3.01% |
-20.80% |
| Biotech |
$BTK |
664.54 |
-22.73 |
-3.31% |
+2.68% |
|
|
|
 |
Distributional Pressure Hurts Near-Term Outlook
Kenneth J. Gruneisen - Passed the CAN SLIM® Master's Exam
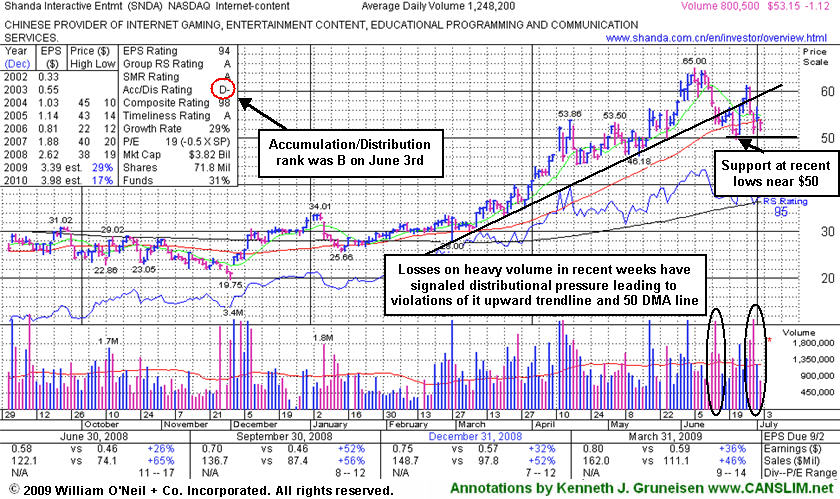
Shanda Interactive Ent Ltd (SNDA -$1.12 or -2.06% to $53.15) gapped down today for a loss on light volume, sinking below its 50-day moving average (DMA) line again. Deterioration below its recent chart low near $50 would raise more serious concerns and trigger a worrisome technical sell signal, especially if volume swells behind more damaging losses. Losses on heavy volume in recent weeks were noted as they signaled distributional pressure leading to violations of it upward trendline and 50 DMA line. Its Accumulation/Distribution rank also reflects the recent action, having fallen from a respectable B on June 3rd, to a rather dismal D- today!
A closer look at its chart identified a worrisome "island reversal" pattern in the annotated graph included with the stock's last appearance in this FSU section on June 25th, and any members who may not have noted that ominous pattern before should take time now to review that earlier report (read here). After featured in the June 2009 issue of CANSLIM.net News (read here), SNDA quickly got too extended from a proper buy point. Its outlook now grows increasingly questionable the longer and deeper it slumps into its prior base below it previous chart highs in the $53 area. More time is needed for it to form a new sound base such as "double bottom" in the coming weeks.
|
|
|
Color Codes Explained :
Y - Better candidates highlighted by our
staff of experts.
G - Previously featured
in past reports as yellow but may no longer be buyable under the
guidelines.
***Last / Change / Volume quote data in this table corresponds with the timestamp on the note***
Symbol/Exchange
Company Name
Industry Group |
Last |
Chg. |
Vol
% DAV |
Date Featured |
Price Featured |
Latest Pivot Point
Featured |
Status |
| Latest Max Buy Price |
GMCR
- NASDAQ
Green Mtn Coffee Roastrs
FOOD & BEVERAGE - Processed & Packaged Goods
|
$58.65
|
N/A
|
N/A
N/A
|
1/1/2008
(Date
Featured) |
$27.13
(Price
Featured) |
PP = $28.66 |
G |
| MB = $30.09 |
Most Recent Note - 7/2/2009 3:57:08 PM
G - Small gap down today. Recently found support above its 50 DMA line -important support to watch. On 6/09/09 it reached a new all-time high with a gain on light volume as a 3:2 stock split took effect. GMCR traded up more than +144% since appearing with an annotated graph under the headline "It May Soon Be Time To Go Green" when featured in the January 2009 CANSLIM.net News (read here).
>>> The latest Featured Stock Update with an annotated graph appeared on 6/22/2009. click here.
|
|
C
A
S
I |
News |
Chart |
SEC
View all notes Alert
me of new notes
Company
Profile
|
HMSY
- NASDAQ
H M S Holdings Corp
COMPUTER SOFTWARE & SERVICES - Healthcare Information Service
|
$40.62
|
N/A
|
N/A
N/A
|
2/20/2009
(Date
Featured) |
$34.08
(Price
Featured) |
PP = $38.38 |
G |
| MB = $40.30 |
Most Recent Note - 7/2/2009 4:00:26 PM
G - Extended from a sound base. Prior chart highs and an upward trendline connecting its April-June lows come into play near $38, making that a very important initial support level above its 50 DMA line to watch. Gap up gain on 6/16/09 with heavy volume triggered a technical buy signal. No overhead supply is left to hinder the progress for this Commercial Services - Healthcare firm.
>>> The latest Featured Stock Update with an annotated graph appeared on 6/29/2009. click here.
|
|
C
A
S
I |
News |
Chart |
SEC
View all notes Alert
me of new notes
Company
Profile
|
LFT
-
|
$23.76
|
N/A
|
N/A
N/A
|
4/2/2009
(Date
Featured) |
$22.19
(Price
Featured) |
PP = $21.81 |
G |
| MB = $22.90 |
Most Recent Note - 7/2/2009 4:02:40 PM
G - Gapped down today and sank to its lowest level since May 27th. Its outlook gets increasingly questionable the longer it remains treading under its 50 DMA line. Its progress could be hindered by future share offerings. This Chinese Computer Software firm recently filed a registration of approximately 16 million shares for resale, and it also revealed a planned acquisition of another Chinese service provider.
>>> The latest Featured Stock Update with an annotated graph appeared on 7/1/2009. click here.
|
|
C
A
S
I |
News |
Chart |
SEC
View all notes Alert
me of new notes
Company
Profile
|
NTES
- NASDAQ
Netease Inc Adr
INTERNET - Internet Information Providers
|
$33.63
|
N/A
|
N/A
N/A
|
5/21/2009
(Date
Featured) |
$31.19
(Price
Featured) |
PP = $32.75 |
G |
| MB = $34.39 |
Most Recent Note - 7/2/2009 4:08:06 PM
G - Gapped down today for its 4th consecutive loss, which led to a worrisome violation of a multi-month upward trendline. Closed near its 50 DMA line which coincides with prior chart highs in the $32 area as an important technical support level to watch. It has negated all gains since its 5/28/09 gap up and considerable gain with +79% above average volume confirmed its last sound technical buy signal. Indications of institutional (the I criteria) buying demand have been noted after earnings news on 5/20/09 a shakeout tested support near its 50 DMA line. First featured at $26.75 in the 3/31/09 CANSLIM.net Mid-Day Breakouts Report (read here). This high-ranked Chinese Internet - Content firm was also summarized in greater detail including an annotated graph in the April 2009 issue of CANSLIM.net News (read here).
>>> The latest Featured Stock Update with an annotated graph appeared on 6/30/2009. click here.
|
|
C
A
S
I |
News |
Chart |
SEC
View all notes Alert
me of new notes
Company
Profile
|
NVEC
- NASDAQ
N V E Corp
ELECTRONICS - Semiconductor - Specialized
|
$47.00
|
N/A
|
N/A
N/A
|
3/13/2009
(Date
Featured) |
$33.85
(Price
Featured) |
PP = $45.50 |
G |
| MB = $47.78 |
Most Recent Note - 7/2/2009 4:11:38 PM
G - Loss on slightly above average volume today has it sinking back under its previously cited "max buy" level. Its 50 DMA and prior highs are important support to watch. Its 6/19/09 gain with volume more than 2 times average helped it rise from an "ascending base" type pattern to a new 52-week high and multi-year high, triggering a technical buy signal. Sales increases in recent comparisons have been under the +25% guideline and still rather minuscule, leaving concerns, especially in the event of any hiccups. This is a reason to be especially disciplined about proper entries and exits.
>>> The latest Featured Stock Update with an annotated graph appeared on 6/23/2009. click here.
|
|
C
A
S
I |
News |
Chart |
SEC
View all notes Alert
me of new notes
Company
Profile
|
SNDA
-
|
$53.02
|
N/A
|
N/A
N/A
|
5/31/2009
(Date
Featured) |
$57.62
(Price
Featured) |
PP = $53.95 |
G |
| MB = $56.65 |
Most Recent Note - 7/2/2009 4:13:44 PM
G - Gapped down today for a loss on light volume, sinking below its 50 DMA line again. Deterioration below its recent chart low near $50 would raise more serious concerns and trigger a worrisome technical sell signal. Detailed analysis was included when recently featured in the June 2009 issue of CANSLIM.net News. Be sure to review the "What to Look Out For" section and entire detailed summary - read here).
>>> The latest Featured Stock Update with an annotated graph appeared on 7/2/2009. click here.
|
|
C
A
S
I |
News |
Chart |
SEC
View all notes Alert
me of new notes
Company
Profile
|
SYNA
- NASDAQ
Synaptics Inc
COMPUTER SOFTWARE & SERVICES - Information Technology Service
|
$37.79
|
N/A
|
N/A
N/A
|
5/18/2009
(Date
Featured) |
$32.58
(Price
Featured) |
PP = $34.52 |
G |
| MB = $36.25 |
Most Recent Note - 7/2/2009 4:15:26 PM
G - Volume continues to dry up while consolidating in a tight range within close striking distance of all-time highs. Its August 2008 chart highs ($36), its 50 DMA line, and recent chart highs coincide to define an important support level. First featured in yellow in the May 18, 2009 mid-day report (read here). The number of top-rated funds owning its shares rose from 123 in June '08 to 197 in March '09, which is good news concerning the I criteria. Its annual earnings (the A criteria) history showed a dowturn in 2006, leaving concerns, but it followed that up with strong growth the next 2 years. Its small supply of shares (the S criteria) outstanding could contribute to especially great volatility in the event of institutional accumulation or distribution.
>>> The latest Featured Stock Update with an annotated graph appeared on 6/26/2009. click here.
|
|
C
A
S
I |
News |
Chart |
SEC
View all notes Alert
me of new notes
Company
Profile
|
TNDM
- NASDAQ
Tandem Diabetes Care Inc
TELECOMMUNICATIONS - Wireless Communications
|
$29.13
|
N/A
|
N/A
N/A
|
3/2/2009
(Date
Featured) |
$18.89
(Price
Featured) |
PP = $29.85 |
G |
| MB = $31.34 |
Most Recent Note - 7/2/2009 4:17:14 PM
G - Gapped down today for a small loss on light volume, quietly consolidating after recently rebounding above its 50 DMA line. Its choppy chart offers no sound base per the investment system's guidelines. It traded up as much as +72.42% since first featured at $18.89 in the 3/02/09 Mid-Day BreakOuts Report (read here).
>>> The latest Featured Stock Update with an annotated graph appeared on 6/24/2009. click here.
|
|
C
A
S
I |
News |
Chart |
SEC
View all notes Alert
me of new notes
Company
Profile
|
|
|
|
THESE ARE NOT BUY RECOMMENDATIONS!
Comments contained in the body of this report are technical
opinions only. The material herein has been obtained
from sources believed to be reliable and accurate, however,
its accuracy and completeness cannot be guaranteed.
This site is not an investment advisor, hence it does
not endorse or recommend any securities or other investments.
Any recommendation contained in this report may not
be suitable for all investors and it is not to be deemed
an offer or solicitation on our part with respect to
the purchase or sale of any securities. All trademarks,
service marks and trade names appearing in this report
are the property of their respective owners, and are
likewise used for identification purposes only.
This report is a service available
only to active Paid Premium Members.
You may opt-out of receiving report notifications
at any time. Questions or comments may be submitted
by writing to Premium Membership Services 665 S.E. 10 Street, Suite 201 Deerfield Beach, FL 33441-5634 or by calling 1-800-965-8307
or 954-785-1121.
|
|
|


