You are not logged in.
This means you
CAN ONLY VIEW reports that were published prior to Monday, April 14, 2025.
You
MUST UPGRADE YOUR MEMBERSHIP if you want to see any current reports.
AFTER MARKET UPDATE - MONDAY, JULY 1ST, 2013
Previous After Market Report Next After Market Report >>>
|
|
|
|
DOW |
+65.36 |
14,974.96 |
+0.44% |
|
Volume |
713,851,000 |
-59% |
|
Volume |
1,536,528,130 |
-38% |
|
NASDAQ |
+31.24 |
3,434.49 |
+0.92% |
|
Advancers |
2,175 |
70% |
|
Advancers |
1,779 |
68% |
|
S&P 500 |
+8.68 |
1,614.96 |
+0.54% |
|
Decliners |
867 |
28% |
|
Decliners |
734 |
28% |
|
Russell 2000 |
+12.36 |
989.84 |
+1.26% |
|
52 Wk Highs |
169 |
|
|
52 Wk Highs |
243 |
|
|
S&P 600 |
+7.96 |
558.48 |
+1.45% |
|
52 Wk Lows |
12 |
|
|
52 Wk Lows |
12 |
|
|
 |
Indices Rise With Lighter Volume on Both Major Exchanges
Kenneth J. Gruneisen - Passed the CAN SLIM® Master's Exam
The indices ended Monday's session higher, albeit off of their best levels. The volume totals were reported much lighter than the prior session totals on the NYSE and on the Nasdaq exchange. Breadth was positive as advancers outnumbered decliners by more than 2-1 on the NYSE and on the Nasdaq exchange. There were 70 high-ranked companies from the CANSLIM.net Leaders List made new 52-week highs and appeared on the CANSLIM.net BreakOuts Page, up from the prior session total of 41 stocks. The list of stocks hitting new 52-week highs easily outnumbered new 52-week lows on both the NYSE and the Nasdaq exchange. There were gains for 7 of the 8 high-ranked companies currently included on the Featured Stocks Page.
The major averages kicked off July on a positive note following a batch of mostly upbeat economic reports. A positive reading on ISM manufacturing and an in-line report on construction spending helped offset a slightly weaker-than-expected PMI reading.
Nine of the 10 sectors on the S&P were higher, led by gains in telecom stocks including F5 Networks Inc (FFIV +1.19%). On the M&A front, Onyx Pharmaceuticals Inc (ONXX +51.27%) spiked higher after the drug maker reportedly rejected a $10 billion buyout offer from Amgen INC (AMGN -1.18%) on the grounds that it undervalued the company.
Commodity markets ended higher. Crude oil was up +1.4% to $97.90 per barrel and gold added +2.3% to $1,251 an ounce. Turning to fixed income markets, Treasuries were modestly higher along the curve. The benchmark 10-year note was up 3/32 to yield 2.48% and the 30-year bond added 13/32 to yield 3.48%.
Disciplined investors will note that the window is now open for the market (M criteria) to produce a follow-through day within the most ideal period between days 4-7 of a new rally attempt. In spite of the recent rebound there is still a need for caution until a new rally is confirmed by a proper follow-through day (FTD) of meaningful gains (+1.4% or greater) from at least one of the major averages on higher volume coupled with an expansion in leadership (stocks hitting new 52-week highs).
Upcoming CANSLIM.net reports will observe and explain any noteworthy shifts in the market direction (M criteria) while especially highlighting the characteristics and important details in the bold portion of this commentary. Regular readers are aware via prior reports since early June repeatedly reminding members - "Be protective of any gains, and limit losses! Be especially watchful for any individual issues flashing technical sell signals. It is vitally important to your success with the fact-based investment system to reduce exposure and preserve cash during market downdrafts."
Individual leaders best matching the winning models of the fact-based investment system are on the Featured Stocks Page - with our Certified experts' latest notes and links to additional resources including detailed analysis with annotated graphs. The Premium Member Homepage - includes "dynamic archives" to all prior pay reports published. Watch for an announcement via email concerning the next WEBCAST.
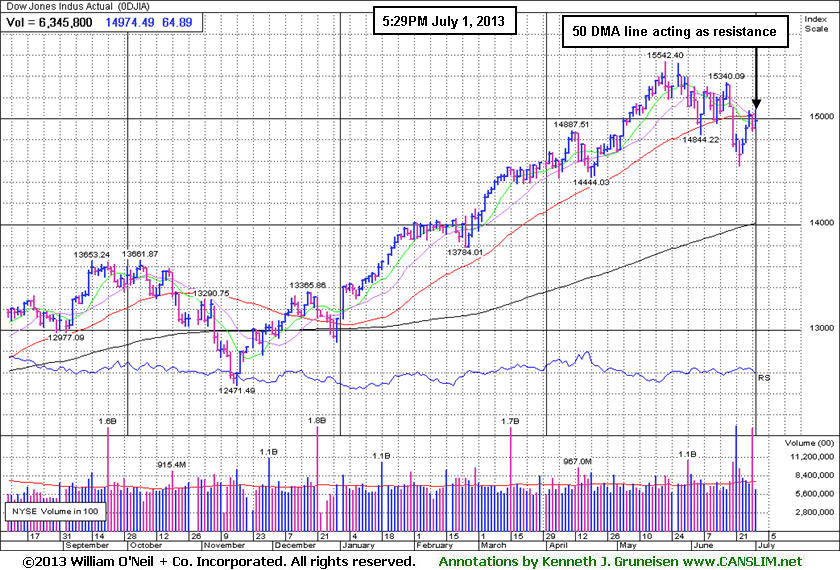
PICTURED: The Dow Jones Industrial Average has been encountering resistance at its 50-day moving average (DMA) line. Gains above that important short-term average are needed to help the Blue Chip index's technical stance improve. It also faces resistance at a near-term downward trendline. Tuesday marks Day 6 of the current rally attempt, a rally attempt that will remain valid unless the Day 1 lows (14,669 on 6/25/13) are violated which would clearly indicate deterioration and signal that the correction is worsening. Careful chart readers will notice that the volume totals were below average behind the latest gains following damaging losses with much heavier above-average volume totals.
|
 Kenneth J. Gruneisen started out as a licensed stockbroker in August 1987, a couple of months prior to the historic stock market crash that took the Dow Jones Industrial Average down -22.6% in a single day. He has published daily fact-based fundamental and technical analysis on high-ranked stocks online for two decades. Through FACTBASEDINVESTING.COM, Kenneth provides educational articles, news, market commentary, and other information regarding proven investment systems that work in good times and bad.
Comments contained in the body of this report are technical opinions only and are not necessarily those of Gruneisen Growth Corp. The material herein has been obtained from sources believed to be reliable and accurate, however, its accuracy and completeness cannot be guaranteed. Our firm, employees, and customers may effect transactions, including transactions contrary to any recommendation herein, or have positions in the securities mentioned herein or options with respect thereto. Any recommendation contained in this report may not be suitable for all investors and it is not to be deemed an offer or solicitation on our part with respect to the purchase or sale of any securities. |
|
 |
Commodity-Linked Groups, Retail, Financial and Tech Indices Rose
Kenneth J. Gruneisen - Passed the CAN SLIM® Master's Exam
Commodity-linked groups rose and the Gold & Silver Index ($XAU +1.46%) out paced the Oil Services Index ($OSX +1.19%) while the Integrated Oil Index ($XOI +0.39%) tallied a smaller gain. The Retail Index ($RLX +1.09%) was a positive influence on the major averages along with gains from financial shares as the Broker/Dealer Index ($XBD +1.72%) outpaced the Bank Index ($BKX +0.90%). The Biotechnology Index ($BTK +2.45%) led the tech sector higher while the Internet Index ($IIX +0.91%) and Networking Index ($NWX +0.62%) followed with smaller gains and the Semiconductor Index ($SOX -0.15%) was a laggard as it edged lower. The Healthcare Index ($HMO +0.46%) had a slightly positive bias.
Charts courtesy www.stockcharts.com

PICTURED: The Networking Index ($NWX +0.62%) is consolidating above prior highs and well above its 50 DMA line.
| Oil Services |
$OSX |
255.88 |
+3.01 |
+1.19% |
+16.22% |
| Healthcare |
$HMO |
3,237.43 |
+14.95 |
+0.46% |
+28.77% |
| Integrated Oil |
$XOI |
1,334.93 |
+5.16 |
+0.39% |
+7.50% |
| Semiconductor |
$SOX |
467.73 |
-0.70 |
-0.15% |
+21.79% |
| Networking |
$NWX |
260.22 |
+1.61 |
+0.62% |
+14.86% |
| Internet |
$IIX |
380.80 |
+3.44 |
+0.91% |
+16.45% |
| Broker/Dealer |
$XBD |
127.62 |
+2.16 |
+1.72% |
+35.29% |
| Retail |
$RLX |
796.94 |
+8.57 |
+1.09% |
+22.03% |
| Gold & Silver |
$XAU |
91.47 |
+1.32 |
+1.46% |
-44.76% |
| Bank |
$BKX |
61.96 |
+0.55 |
+0.90% |
+20.83% |
| Biotech |
$BTK |
2,004.23 |
+47.97 |
+2.45% |
+29.55% |
|
|
|
 |
Forming New Base While Awaiting New Confirmed Market Rally
Kenneth J. Gruneisen - Passed the CAN SLIM® Master's Exam
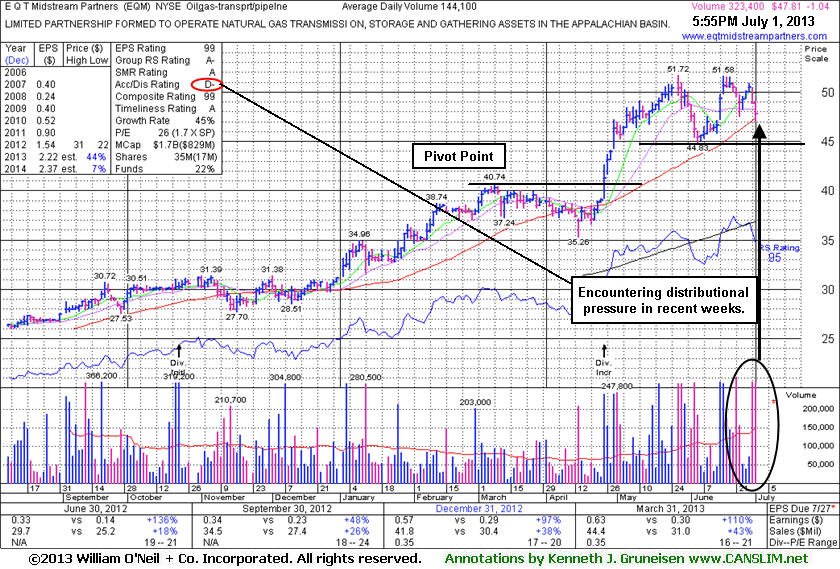
E Q T Midstream Partners (EQM -$1.04 or -2.13% to $47.81) tested support at its 50-day moving average (DMA) line again today with it 2nd consecutive loss backed by above average volume. Below that short-term average, the prior low ($44.83 on 6/05/13) defines the next important support level to watch. Its Accumulation/Distribution Rating has slumped to a D- from a B- when last appearing in this FSU section on 6/21/13 with an annotated graph under the headline, "Perched Near 52-Week High Enduring Distributional Pressure ". There was a "negative reversal" on 5/28/13 at its 52-week high. All new buying efforts are off while the major averages are in a correction, since 3 out of 4 stocks follow the direction of the major averages (M criteria). Patient investors may watch for a new confirmed rally to possibly be noted in the weeks ahead, meanwhile this high-ranked leader may be building a new base.
This MLP in the Natural Gas business reported strong results for the Mar '13 quarter, and quarterly earnings increases above the +25% minimum guideline (C criteria). Accelerating sales revenues increases are very reassuring, as its sales revenues increased by +18%, +26%, +38%, and +43% in the Jun, Sep, Dec '12 and Mar '13 quarters versus the year-ago periods, respectively. The number of top-rated funds owning its shares rose from 20 in Jun '12 to 38 in Mar '13, a reassuring sign concerning the I criteria.
|
|
|
Color Codes Explained :
Y - Better candidates highlighted by our
staff of experts.
G - Previously featured
in past reports as yellow but may no longer be buyable under the
guidelines.
***Last / Change / Volume data in this table is the closing quote data***
Symbol/Exchange
Company Name
Industry Group |
PRICE |
CHANGE
(%Change) |
Day High |
Volume
(% DAV)
(% 50 day avg vol) |
52 Wk Hi
% From Hi |
Featured
Date |
Price
Featured |
Pivot Featured |
|
Max Buy |
AMBA
-
NASDAQ
Ambarella Inc
ELECTRONICS - Semiconductor - Specialized
|
$16.97
|
+0.14
0.83% |
$17.38
|
1,132,880
97.57% of 50 DAV
50 DAV is 1,161,100
|
$18.58
-8.67%
|
5/6/2013
|
$15.31
|
PP = $16.10
|
|
MB = $16.91
|
 Most Recent Note - 7/1/2013 1:08:51 PM
G - Color code is changed to green after rising back above its "max buy" level. Found support while recently consolidating above its 50 DMA line - important chart support where a violation would trigger a worrisome technical sell signal.
>>> The latest Featured Stock Update with an annotated graph appeared on 6/27/2013. Click here.
View all notes |
Alert me of new notes |
CANSLIM.net Company Profile |
SEC |
Zacks Reports |
StockTalk |
News |
Chart |
Request a new note
C
A N
S L
I M


|
EQM
-
NYSE
E Q T Midstream Partners
ENERGY - Oil and Gas Pipelines
|
$47.81
|
-1.04
-2.13% |
$49.09
|
323,442
224.46% of 50 DAV
50 DAV is 144,100
|
$51.72
-7.56%
|
4/25/2013
|
$40.16
|
PP = $40.84
|
|
MB = $42.88
|
Most Recent Note - 7/1/2013 12:30:11 PM
G - Testing support at its 50 DMA line ($47.11) with today's 2nd consecutive loss backed by above average volume. Below that short-term average, the prior low ($44.83 on 6/05/13) defines the next important support level.
>>> The latest Featured Stock Update with an annotated graph appeared on 7/1/2013. Click here.
View all notes |
Alert me of new notes |
CANSLIM.net Company Profile |
SEC |
Zacks Reports |
StockTalk |
News |
Chart |
Request a new note
C
A N
S L
I M
|
FLT
-
NYSE
Fleetcor Technologies
DIVERSIFIED SERVICES - Business/Management Services
|
$82.88
|
+1.58
1.94% |
$83.69
|
628,528
67.58% of 50 DAV
50 DAV is 930,000
|
$89.75
-7.65%
|
5/29/2013
|
$86.02
|
PP = $85.66
|
|
MB = $89.94
|
Most Recent Note - 6/28/2013 6:25:18 PM
G- Endured distributional pressure and slumped to close the week below its 50 DMA line raising concerns and its color code is changed to green. See the latest FSU analysis for more details and a new annotated graph.
>>> The latest Featured Stock Update with an annotated graph appeared on 6/28/2013. Click here.
View all notes |
Alert me of new notes |
CANSLIM.net Company Profile |
SEC |
Zacks Reports |
StockTalk |
News |
Chart |
Request a new note
C
A N
S L
I M
|
LOPE
-
NASDAQ
Grand Canyon Education
DIVERSIFIED SERVICES - Education and; Training Services
|
$33.46
|
+1.23
3.82% |
$33.89
|
468,087
113.39% of 50 DAV
50 DAV is 412,800
|
$34.07
-1.79%
|
6/19/2013
|
$31.47
|
PP = $34.17
|
|
MB = $35.88
|
Most Recent Note - 7/1/2013 1:11:54 PM
Y - Subsequent volume driven gains above its pivot point may trigger a new technical buy signal. Poised for a best-ever close today with a gain backed by below average volume. Its 50 DMA line and recent lows define support in the $30-31 area.
>>> The latest Featured Stock Update with an annotated graph appeared on 6/19/2013. Click here.
View all notes |
Alert me of new notes |
CANSLIM.net Company Profile |
SEC |
Zacks Reports |
StockTalk |
News |
Chart |
Request a new note
C
A N
S L
I M
|
PRAA
-
NASDAQ
Portfolio Recovery Assoc
DIVERSIFIED SERVICES - Business/Management Services
|
$157.97
|
+4.34
2.82% |
$158.68
|
126,300
149.47% of 50 DAV
50 DAV is 84,500
|
$163.87
-3.60%
|
5/1/2013
|
$130.77
|
PP = $127.88
|
|
MB = $134.27
|
Most Recent Note - 6/28/2013 6:41:46 PM
G - Endured a loss on heavy volume. Extended from any sound base, it rallied with no resistance due to overhead supply. Its 50 DMA line defines important near-term chart support.
>>> The latest Featured Stock Update with an annotated graph appeared on 6/25/2013. Click here.
View all notes |
Alert me of new notes |
CANSLIM.net Company Profile |
SEC |
Zacks Reports |
StockTalk |
News |
Chart |
Request a new note
C
A N
S L
I M
|
Symbol/Exchange
Company Name
Industry Group |
PRICE |
CHANGE
(%Change) |
Day High |
Volume
(% DAV)
(% 50 day avg vol) |
52 Wk Hi
% From Hi |
Featured
Date |
Price
Featured |
Pivot Featured |
|
Max Buy |
PRLB
-
NYSE
Proto Labs Inc
MANUFACTURING - Small Tools and Accessories
|
$65.83
|
+0.86
1.32% |
$66.70
|
381,664
74.94% of 50 DAV
50 DAV is 509,300
|
$67.40
-2.33%
|
6/17/2013
|
$59.37
|
PP = $59.94
|
|
MB = $62.94
|
Most Recent Note - 6/28/2013 6:44:15 PM
G- Ended near the session low with a loss on heavy volume, encountering distributional pressure after a "negative reversal" at its 52-week high. Found prompt support near prior highs.
>>> The latest Featured Stock Update with an annotated graph appeared on 6/26/2013. Click here.
View all notes |
Alert me of new notes |
CANSLIM.net Company Profile |
SEC |
Zacks Reports |
StockTalk |
News |
Chart |
Request a new note
C
A N
S L
I M
|
RRTS
-
NYSE
Roadrunner Trans Systems
TRANSPORTATION - Air Delivery and Freight Service
|
$28.28
|
+0.44
1.58% |
$28.69
|
152,185
74.53% of 50 DAV
50 DAV is 204,200
|
$29.52
-4.20%
|
4/3/2013
|
$22.77
|
PP = $23.75
|
|
MB = $24.94
|
Most Recent Note - 7/1/2013 1:06:40 PM
G - Wedging higher without great volume conviction after finding support above its 50 DMA line, and it is perched within close striking distance of its 52-week high. Fundamental concerns were raised by its sub par earnings increase in the Mar '13 quarter.
>>> The latest Featured Stock Update with an annotated graph appeared on 6/20/2013. Click here.
View all notes |
Alert me of new notes |
CANSLIM.net Company Profile |
SEC |
Zacks Reports |
StockTalk |
News |
Chart |
Request a new note
C
A N
S L
I M
|
VRX
-
NYSE
Valeant Pharmaceuticals
DRUGS - Drug Manufacturers - Other
|
$88.00
|
+1.92
2.23% |
$89.25
|
1,792,869
87.03% of 50 DAV
50 DAV is 2,060,000
|
$96.25
-8.57%
|
4/30/2013
|
$60.24
|
PP = $76.66
|
|
MB = $80.49
|
Most Recent Note - 7/1/2013 1:04:18 PM
G- Small gap up today. Held its ground since completing a new Public Offering on 6/18/13 following recent M&A news. Concerns were raised by its sub par Mar '13 earnings report.
>>> The latest Featured Stock Update with an annotated graph appeared on 6/24/2013. Click here.
View all notes |
Alert me of new notes |
CANSLIM.net Company Profile |
SEC |
Zacks Reports |
StockTalk |
News |
Chart |
Request a new note
C
A N
S L
I M
|
|
|
|
THESE ARE NOT BUY RECOMMENDATIONS!
Comments contained in the body of this report are technical
opinions only. The material herein has been obtained
from sources believed to be reliable and accurate, however,
its accuracy and completeness cannot be guaranteed.
This site is not an investment advisor, hence it does
not endorse or recommend any securities or other investments.
Any recommendation contained in this report may not
be suitable for all investors and it is not to be deemed
an offer or solicitation on our part with respect to
the purchase or sale of any securities. All trademarks,
service marks and trade names appearing in this report
are the property of their respective owners, and are
likewise used for identification purposes only.
This report is a service available
only to active Paid Premium Members.
You may opt-out of receiving report notifications
at any time. Questions or comments may be submitted
by writing to Premium Membership Services 665 S.E. 10 Street, Suite 201 Deerfield Beach, FL 33441-5634 or by calling 1-800-965-8307
or 954-785-1121.
|
|
|

