You are not logged in.
This means you
CAN ONLY VIEW reports that were published prior to Monday, April 14, 2025.
You
MUST UPGRADE YOUR MEMBERSHIP if you want to see any current reports.
AFTER MARKET UPDATE - THURSDAY, JULY 1ST, 2010
Previous After Market Report Next After Market Report >>>
|
|
|
|
DOW |
-41.49 |
9,732.53 |
-0.42% |
|
Volume |
1,598,647,950 |
+12% |
|
Volume |
2,609,670,670 |
+23% |
|
NASDAQ |
-7.88 |
2,101.36 |
-0.37% |
|
Advancers |
1,191 |
37% |
|
Advancers |
911 |
33% |
|
S&P 500 |
-3.34 |
1,027.37 |
-0.32% |
|
Decliners |
1,874 |
59% |
|
Decliners |
1,777 |
64% |
|
Russell 2000 |
-4.73 |
604.76 |
-0.78% |
|
52 Wk Highs |
35 |
|
|
52 Wk Highs |
9 |
|
|
S&P 600 |
-2.45 |
325.52 |
-0.75% |
|
52 Wk Lows |
151 |
|
|
52 Wk Lows |
257 |
|
|
 |
Losing Streak Continues As Correction Inflicts More Technical Damage
Adam Sarhan, Contributing Writer,
Stocks, commodities and the dollar fell after a series of lackluster economic data sparked concern that the global economic recovery is faltering. Thursday's volume totals were reported higher on the NYSE and the Nasdaq exchange compared to Wednesday's levels. Decliners led advancers by a 3-to-2 ratio on the NYSE and by a 2-to-1 ratio on the Nasdaq exchange. There was only 1 high-ranked company from the CANSLIM.net Leaders List that made a new 52-week high and appeared on the CANSLIM.net BreakOuts Page, lower from the 4 issues that appeared on the prior session. Meanwhile, new 52-week lows substantially outnumbered new 52-week highs on the NYSE and the Nasdaq exchange. As leadership evaporated in recent sessions, in this commentary it was repeatedly noted - "Without a healthy crop of leaders hitting new highs it is hard for the major averages to sustain a rally."
Overnight, stocks fell in Europe and Asia after weaker than expected manufacturing reports were released. The weakness spilled over to the US when a series of tepid economic reports were released. US jobless claims unexpectedly rose to 472,000 last week, pending home sales tanked at twice the rate Wall Street had expected and US manufacturing echoed the ominous news from Europe and Asia. This was the latest round of tepid economic data which suggests the economic recovery is less than stellar.
Some might say that Thursday was Day 1 of a new rally attempt due to the fact that the major averages closed in the upper half of their intra-day ranges, recovering from steep losses in the first half of the session. That still does not change the fact that the market is in a correction which emphasizes the importance of raising cash and adopting a strong defensive stance until a new follow-through day emerges. For the past several weeks, this column has steadily noted the importance of remaining very selective and disciplined because all of the major averages are still trading below their downward sloping 50-day moving average (DMA) lines. Their 50 DMA line may continue to act as stubborn resistance. It was also recently noted that the NYSE Composite Index's 50 DMA line already sliced below the 200 DMA line, an event known by market technicians as a "death cross" which usually has bearish implications. The benchmark S&P 500 Index now appears very close to doing the same. Trade accordingly.
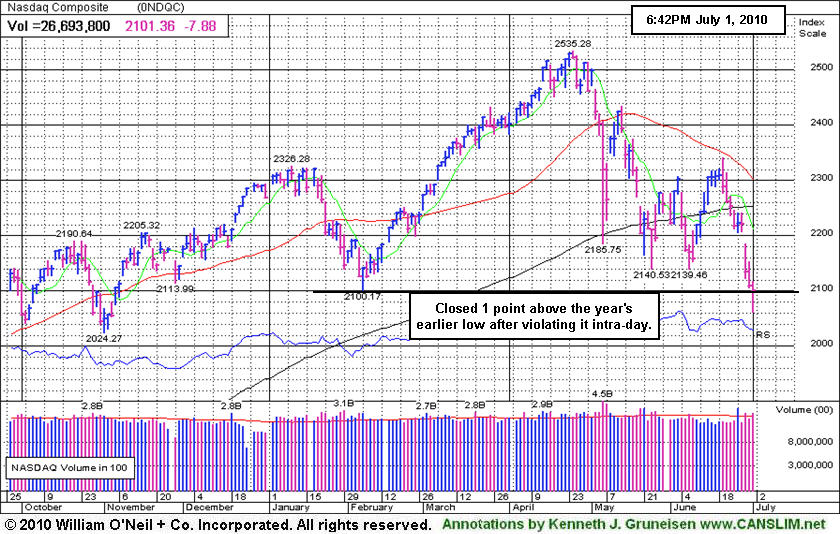
Q2 Webcast Rewind: The Q2 2010 CANSLIM.net Webcast aired at 8PM on Wednesday, June 30, 2010. A link to the webcast has been added near the top on the Premium Membership Homepage which will allow all who have UPGRADED with a currently active premium (paid) membership to view the webcast ON DEMAND at any time. To UPGRADE now for access to the webcast and all premium reports CLICK HERE. PICTURED: The Nasdaq Composite Index closed 1 point above its previous 2010 low after violating it intra-day. All three major averages have tallied 8 losses in the past 9 sessions.
|
|
|
 |
Gold And Silver Index's Dive Smacks "Safe Haven" Investors
Kenneth J. Gruneisen - Passed the CAN SLIM® Master's Exam
Defensive groups swooned on Thursday as the Healthcare Index ($HMO -2.30%) was among the laggard groups. The Biotechnology Index ($BTK -2.18%) also faced pressure, yet other tech groups held their ground reasonably well. The Internet Index ($IIX -0.05%) and Networking Index ($NWX +0.01%) finished flat, and the Semiconductor Index ($SOX +0.24%) edged higher. The influential Retail Index ($RLX +1.08%) overcame early weakness to finish the session higher, but the Broker/Dealer Index ($XBD -0.96%) and Bank Index ($BKX -0.93%) continued leading the broader market lower. Meanwhile, the Integrated Oil Index ($XOI -0.44%) and Oil Services Index ($OSX +0.54%) were mixed.
Charts courtesy www.stockcharts.com
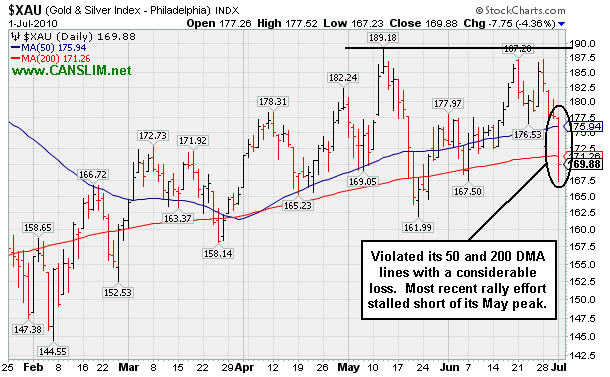
PICTURED: The Gold & Silver Index ($XAU -4.36%) was a standout decliner on Thursday, punishing "safe haven" investors while it violated its 50-day and 200-day moving average (DMA) lines with a considerable loss. Its most recent rally effort stalled short of its May peak.
| Oil Services |
$OSX |
165.02 |
+0.89 |
+0.54% |
-15.34% |
| Healthcare |
$HMO |
1,367.31 |
-32.17 |
-2.30% |
-7.17% |
| Integrated Oil |
$XOI |
879.71 |
-3.91 |
-0.44% |
-17.65% |
| Semiconductor |
$SOX |
333.11 |
+0.81 |
+0.24% |
-7.45% |
| Networking |
$NWX |
215.36 |
+0.02 |
+0.01% |
-6.79% |
| Internet |
$IIX |
220.83 |
-0.11 |
-0.05% |
-5.57% |
| Broker/Dealer |
$XBD |
96.04 |
-0.93 |
-0.96% |
-16.52% |
| Retail |
$RLX |
389.97 |
+4.15 |
+1.08% |
-5.14% |
| Gold & Silver |
$XAU |
169.88 |
-7.75 |
-4.36% |
+0.97% |
| Bank |
$BKX |
45.69 |
-0.43 |
-0.93% |
+6.98% |
| Biotech |
$BTK |
1,000.82 |
-22.27 |
-2.18% |
+6.23% |
|
|
|
 |
After Clearing Overhead Supply Latest Breakout Failed
Kenneth J. Gruneisen - Passed the CAN SLIM® Master's Exam
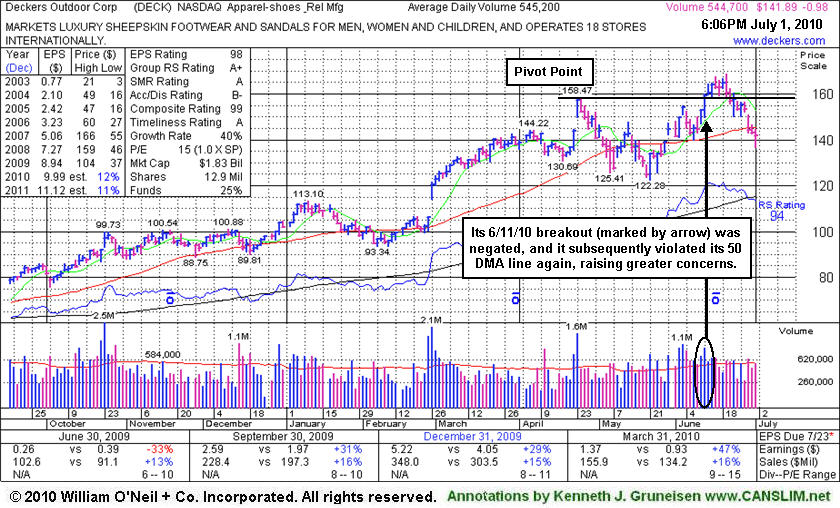
Deckers Outdoor Corp (DECK -$0.98 or -0.69% to $141.89) finished lower today on average volume for its 4th consecutive loss, slumping further below its 50-day moving average (DMA) line. Weak market (M criteria) action may be expected to drag 3 out of 4 stocks lower, meanwhile, caution is advised until another new confirmed rally begins.
DECK appeared in yellow in the 6/11/10 mid-day report (read here) and finished that session strong as it rallied to a new 52-week high with volume nearly 2 times average. Having cleared a choppy 7-week consolidation, it went on to challenge its 2007 all-time high ($166) and briefly traded even higher. Although it was unhindered by resistance due to overhead supply, it soon negated the breakout and began to weaken. Along with it, the major indices fell into another correction. For disciplined investors a major concern now is that, until another new confirmed rally with a solid follow-through day occurs, the negative M criteria argues against new buying efforts. Meanwhile, 3 out of 4 stocks typically follow the direction of the major averages, and their path of least Resistance appears to be heading lower for the time being.
Quarterly sales revenues increases have been in the +16% range while earnings increases were above the +25% minimum guideline in the 3 latest comparisons. This apparel firm has a great annual earnings history (A criteria). Earnings estimates are in the 11-12% range for FY '10 and '11, and its rather lackluster sales revenues growth rate also leaves some concerns, fundamentally.
|
|
|
Color Codes Explained :
Y - Better candidates highlighted by our
staff of experts.
G - Previously featured
in past reports as yellow but may no longer be buyable under the
guidelines.
***Last / Change / Volume data in this table is the closing quote data***
Symbol/Exchange
Company Name
Industry Group |
PRICE |
CHANGE
(%Change) |
Day High |
Volume
(% DAV)
(% 50 day avg vol) |
52 Wk Hi
% From Hi |
Featured
Date |
Price
Featured |
Pivot Featured |
|
Max Buy |
AAPL
-
NASDAQ
Apple Inc
COMPUTER HARDWARE - Personal Computers
|
$248.48
|
-3.05
-1.21% |
$254.80
|
36,507,958
126.65% of 50 DAV
50 DAV is 28,826,600
|
$279.01
-10.94%
|
6/17/2010
|
$270.95
|
PP = $272.56
|
|
MB = $286.19
|
Most Recent Note - 6/30/2010 5:23:33 PM
G - Down again today on lighter volume after a considerable loss on 6/28/10 with heavy volume while violating its 50 DMA line and triggering a technical sell signal. It was featured in the 6/17/10 mid-day report (read here).
>>> The latest Featured Stock Update with an annotated graph appeared on 6/17/2010. Click here.
View all notes |
Alert me of new notes |
CANSLIM.net Company Profile |
SEC |
Zacks Reports |
StockTalk |
News |
Chart |
Request a new note
C
A N
S L
I M


|
ABV
-
NYSE
Comp De Bebidas Adr
FOOD and BEVERAGE - Beverages - Brewers
|
$101.17
|
+0.16
0.16% |
$102.01
|
1,305,982
186.73% of 50 DAV
50 DAV is 699,400
|
$109.33
-7.46%
|
6/29/2010
|
$104.74
|
PP = $109.33
|
|
MB = $114.80
|
Most Recent Note - 6/30/2010 5:27:04 PM
G - Brazil-based beverage firm slumped toward its 50 DMA line today with above average volume behind its second consecutive loss. Color code is changed to green based on its deteriorating strength. A new FTD is needed before any buying efforts may be justifiable under the investment system's guidelines. It was featured in yellow in the 6/29/10 mid-day report (read here) with a note while - "perched near all-time highs after building an orderly base pattern and finding impressive support near its 200 DMA line in recent months. It has a great annual earnings (A criteria) history and its recent quarterly earnings and sales revenues increases have shown acceleration. A gain above its pivot point with heavy volume still needed to confirm a proper new technical buy signal."
>>> The latest Featured Stock Update with an annotated graph appeared on 6/29/2010. Click here.
View all notes |
Alert me of new notes |
CANSLIM.net Company Profile |
SEC |
Zacks Reports |
StockTalk |
News |
Chart |
Request a new note
C
A N
S L
I M
|
APEI
-
NASDAQ
American Public Educ Inc
DIVERSIFIED SERVICES - Education and Training Services
|
$42.42
|
-1.28
-2.93% |
$44.27
|
247,023
142.13% of 50 DAV
50 DAV is 173,800
|
$48.95
-13.34%
|
6/7/2010
|
$46.60
|
PP = $46.29
|
|
MB = $48.60
|
 Most Recent Note - 7/1/2010 5:35:01 PM
G - Volume increased today behind its 5th consecutive loss. Color code was changed to green while it slumped under its 50 DMA line, falling amid broad market (M criteria) weakness.
>>> The latest Featured Stock Update with an annotated graph appeared on 6/14/2010. Click here.
View all notes |
Alert me of new notes |
CANSLIM.net Company Profile |
SEC |
Zacks Reports |
StockTalk |
News |
Chart |
Request a new note
C
A N
S L
I M
|
BIDU
-
NASDAQ
Baidu Inc Ads
INTERNET - Internet Information Providers
|
$68.55
|
+0.47
0.69% |
$69.88
|
11,540,926
76.88% of 50 DAV
50 DAV is 15,011,600
|
$82.29
-16.70%
|
1/13/2010
|
$43.13
|
PP = $42.68
|
|
MB = $44.81
|
Most Recent Note - 6/30/2010 5:34:04 PM
G - Held its ground today. A considerable loss on 6/29/10 amid China-linked weakness and broad-based losses led to a violation of its 50 DMA line on heavier volume, triggering a worrisome technical sell signal. Now it is trading near prior chart lows in the $66 area that define the next level of important chart support.
>>> The latest Featured Stock Update with an annotated graph appeared on 6/21/2010. Click here.
View all notes |
Alert me of new notes |
CANSLIM.net Company Profile |
SEC |
Zacks Reports |
StockTalk |
News |
Chart |
Request a new note
C
A N
S L
I M
|
BRLI
-
NASDAQ
Bio Reference Labs Inc
HEALTH SERVICES - Medical Laboratories and Researc
|
$20.86
|
-1.31
-5.91% |
$22.17
|
525,205
269.47% of 50 DAV
50 DAV is 194,900
|
$24.67
-15.46%
|
6/15/2010
|
$23.57
|
PP = $24.77
|
|
MB = $26.01
|
Most Recent Note - 7/1/2010 11:26:27 AM
G - Considerable loss today amid broader market (M criteria) weakness, quickly approaching its 200 DMA line. That important long-term average may serve as a support level, and it comes into play just above prior chart highs that were once a stubborn resistance level.
>>> The latest Featured Stock Update with an annotated graph appeared on 6/15/2010. Click here.
View all notes |
Alert me of new notes |
CANSLIM.net Company Profile |
SEC |
Zacks Reports |
StockTalk |
News |
Chart |
Request a new note
C
A N
S L
I M
|
Symbol/Exchange
Company Name
Industry Group |
PRICE |
CHANGE
(%Change) |
Day High |
Volume
(% DAV)
(% 50 day avg vol) |
52 Wk Hi
% From Hi |
Featured
Date |
Price
Featured |
Pivot Featured |
|
Max Buy |
CISG
-
NASDAQ
Cninsure Inc Ads
INSURANCE - Insurance Brokers
|
$25.84
|
-0.10
-0.39% |
$26.18
|
309,079
100.32% of 50 DAV
50 DAV is 308,100
|
$28.62
-9.71%
|
6/16/2010
|
$27.20
|
PP = $27.75
|
|
MB = $29.14
|
Most Recent Note - 6/30/2010 5:40:09 PM
G - Held its ground today following a gap down on 6/29/10 amid widespread losses in China-based firms and weak action in the broader market. It has traded light volume as it slumped under its 50 DMA line. Featured in the 6/16/10 mid-day report (read here).
>>> The latest Featured Stock Update with an annotated graph appeared on 6/18/2010. Click here.
View all notes |
Alert me of new notes |
CANSLIM.net Company Profile |
SEC |
Zacks Reports |
StockTalk |
News |
Chart |
Request a new note
C
A N
S L
I M
|
CRM
-
NYSE
Salesforce.Com Inc
INTERNET - Internet Software and Services
|
$87.07
|
+1.25
1.46% |
$87.62
|
3,271,777
117.36% of 50 DAV
50 DAV is 2,787,700
|
$97.94
-11.10%
|
6/2/2010
|
$88.44
|
PP = $89.60
|
|
MB = $94.08
|
Most Recent Note - 6/30/2010 5:42:22 PM
G - Held its ground today following a considerable loss on 6/29/10 with above average volume after gapping down. Violations of prior highs in the $89 area and its 50 DMA line triggered technical sell signals and raised concerns.
>>> The latest Featured Stock Update with an annotated graph appeared on 6/22/2010. Click here.
View all notes |
Alert me of new notes |
CANSLIM.net Company Profile |
SEC |
Zacks Reports |
StockTalk |
News |
Chart |
Request a new note
C
A N
S L
I M
|
DECK
-
NASDAQ
Deckers Outdoor Corp
CONSUMER NON-DURABLES - Textile - Apparel Footwear
|
$141.89
|
-0.98
-0.69% |
$144.68
|
545,911
100.55% of 50 DAV
50 DAV is 542,900
|
$168.52
-15.80%
|
6/11/2010
|
$157.34
|
PP = $158.57
|
|
MB = $166.50
|
Most Recent Note - 7/1/2010 5:39:44 PM
G - Down today on average volume for its 4th consecutive loss, slumping further below its 50 DMA line. Weak market (M criteria) action may be expected to drag 3 out of 4 stocks lower, meanwhile, caution is advised until another new confirmed rally begins.
>>> The latest Featured Stock Update with an annotated graph appeared on 7/1/2010. Click here.
View all notes |
Alert me of new notes |
CANSLIM.net Company Profile |
SEC |
Zacks Reports |
StockTalk |
News |
Chart |
Request a new note
C
A N
S L
I M
|
FFIV
-
NASDAQ
F 5 Networks Inc
INTERNET - Internet Software and Services
|
$69.60
|
+1.03
1.50% |
$69.91
|
1,525,318
88.86% of 50 DAV
50 DAV is 1,716,600
|
$77.10
-9.73%
|
6/16/2010
|
$74.50
|
PP = $74.10
|
|
MB = $77.81
|
Most Recent Note - 7/1/2010 5:51:37 PM
G - Overcame early weakness today for a positive reversal and close near its 50 DMA line. A prompt rebound above its pivot point would be an encouraging sign to watch for, meanwhile the path of least resistance may lead it lower.
>>> The latest Featured Stock Update with an annotated graph appeared on 6/16/2010. Click here.
View all notes |
Alert me of new notes |
CANSLIM.net Company Profile |
SEC |
Zacks Reports |
StockTalk |
News |
Chart |
Request a new note
C
A N
S L
I M
|
MELI
-
NASDAQ
Mercadolibre Inc
INTERNET - Internet Software and; Services
|
$52.60
|
+0.05
0.10% |
$52.96
|
1,029,102
116.93% of 50 DAV
50 DAV is 880,100
|
$62.14
-15.35%
|
5/13/2010
|
$54.21
|
PP = $55.85
|
|
MB = $58.64
|
Most Recent Note - 7/1/2010 5:55:47 PM
G - Overcame early weakness today for a positive reversal. Closed near its session high and near its 50 DMA line, where prompt support is an encouraging sign.
>>> The latest Featured Stock Update with an annotated graph appeared on 6/30/2010. Click here.
View all notes |
Alert me of new notes |
CANSLIM.net Company Profile |
SEC |
Zacks Reports |
StockTalk |
News |
Chart |
Request a new note
C
A N
S L
I M
|
Symbol/Exchange
Company Name
Industry Group |
PRICE |
CHANGE
(%Change) |
Day High |
Volume
(% DAV)
(% 50 day avg vol) |
52 Wk Hi
% From Hi |
Featured
Date |
Price
Featured |
Pivot Featured |
|
Max Buy |
NEM
-
NYSE
Newmont Mining Corp
METALS and MINING - Gold
|
$58.99
|
-2.75
-4.45% |
$61.65
|
14,428,192
147.46% of 50 DAV
50 DAV is 9,784,600
|
$62.62
-5.80%
|
6/22/2010
|
$59.60
|
PP = $59.67
|
|
MB = $62.65
|
Most Recent Note - 7/1/2010 12:58:29 PM
Y - Pulling back today from its 52-week high and slumping below prior chart highs and its pivot point amid a mostly negative market (M criteria) environment. Volume behind recent gains has been below the minimum guidelines (since its mid-May breakout faltered). The America-based mining firm has very reassuring leadership (L criteria) from other Mining - Gold/Silver/Gems industry firms as a favorable backdrop. No overhead supply remains to act as resistance. Featured in a 6/22/10 Stock Bulletin with annotated graph (read here).
>>> The latest Featured Stock Update with an annotated graph appeared on 6/22/2010. Click here.
View all notes |
Alert me of new notes |
CANSLIM.net Company Profile |
SEC |
Zacks Reports |
StockTalk |
News |
Chart |
Request a new note
C
A N
S L
I M
|
ROVI
-
NASDAQ
Rovi Corp
COMPUTER SOFTWARE andamp; SERVICES - Security Software andamp; Services
|
$37.88
|
-0.03
-0.08% |
$38.07
|
859,054
61.98% of 50 DAV
50 DAV is 1,386,100
|
$40.06
-5.44%
|
6/3/2010
|
$38.70
|
PP = $40.16
|
|
MB = $42.17
|
Most Recent Note - 6/29/2010 4:41:56 PM
Y - Consolidating near its 50 DMA line amid broader market (M criteria) weakness, closing only -5.6 off its 52-week high. Color code was changed to yellow again, while disciplined investors will await a new FTD and a convincing gain above its pivot point with heavy volume to trigger a new buy signal. Prior lows near $35 area define support above its 200 DMA line.
>>> The latest Featured Stock Update with an annotated graph appeared on 6/28/2010. Click here.
View all notes |
Alert me of new notes |
CANSLIM.net Company Profile |
SEC |
Zacks Reports |
StockTalk |
News |
Chart |
Request a new note
C
A N
S L
I M
|
SUMR
-
NASDAQ
Summer Infant Inc
CONSUMER NON-DURABLES - Personal Products
|
$6.49
|
-0.06
-0.92% |
$6.60
|
57,975
54.85% of 50 DAV
50 DAV is 105,700
|
$8.42
-22.92%
|
5/4/2010
|
$6.85
|
PP = $7.09
|
|
MB = $7.44
|
Most Recent Note - 6/30/2010 5:56:39 PM
G - Holding its ground today after pulling back near recent chart lows in the $6.25 area that define important support to watch. Gains back above its 50 DMA line and above recent chart highs near $7.40 would be an encouraging technical improvement.
>>> The latest Featured Stock Update with an annotated graph appeared on 6/24/2010. Click here.
View all notes |
Alert me of new notes |
CANSLIM.net Company Profile |
SEC |
Zacks Reports |
StockTalk |
News |
Chart |
Request a new note
C
A N
S L
I M
|
THOR
-
NASDAQ
Thoratec Corp
HEALTH SERVICES - Medical Instruments and Supplies
|
$42.28
|
-0.45
-1.05% |
$42.78
|
1,184,500
100.22% of 50 DAV
50 DAV is 1,181,900
|
$47.93
-11.79%
|
6/3/2010
|
$44.38
|
PP = $45.35
|
|
MB = $47.62
|
Most Recent Note - 7/1/2010 11:36:26 AM
G - Today's 3rd consecutive loss on lighter volume has led to a 50 DMA line violation. Color code is changed to green as weakness has raised concerns.
>>> The latest Featured Stock Update with an annotated graph appeared on 6/23/2010. Click here.
View all notes |
Alert me of new notes |
CANSLIM.net Company Profile |
SEC |
Zacks Reports |
StockTalk |
News |
Chart |
Request a new note
C
A N
S L
I M
|
ULTA
-
NASDAQ
Ulta Salon Cosm & Frag
SPECIALTY RETAIL - Specialty Retail, Other
|
$23.00
|
-0.66
-2.77% |
$23.99
|
1,364,557
204.98% of 50 DAV
50 DAV is 665,700
|
$26.75
-14.02%
|
5/28/2010
|
$25.58
|
PP = $25.86
|
|
MB = $27.15
|
Most Recent Note - 7/1/2010 11:38:25 AM
G - Today's 3rd consecutive loss has it slumping further below its 50 DMA line again, with volume running at a higher pace today as well. Color code is changed to green after the latest technical deterioration and slump below its pivot point.
>>> The latest Featured Stock Update with an annotated graph appeared on 6/25/2010. Click here.
View all notes |
Alert me of new notes |
CANSLIM.net Company Profile |
SEC |
Zacks Reports |
StockTalk |
News |
Chart |
Request a new note
C
A N
S L
I M
|
Symbol/Exchange
Company Name
Industry Group |
PRICE |
CHANGE
(%Change) |
Day High |
Volume
(% DAV)
(% 50 day avg vol) |
52 Wk Hi
% From Hi |
Featured
Date |
Price
Featured |
Pivot Featured |
|
Max Buy |
|
|
|
THESE ARE NOT BUY RECOMMENDATIONS!
Comments contained in the body of this report are technical
opinions only. The material herein has been obtained
from sources believed to be reliable and accurate, however,
its accuracy and completeness cannot be guaranteed.
This site is not an investment advisor, hence it does
not endorse or recommend any securities or other investments.
Any recommendation contained in this report may not
be suitable for all investors and it is not to be deemed
an offer or solicitation on our part with respect to
the purchase or sale of any securities. All trademarks,
service marks and trade names appearing in this report
are the property of their respective owners, and are
likewise used for identification purposes only.
This report is a service available
only to active Paid Premium Members.
You may opt-out of receiving report notifications
at any time. Questions or comments may be submitted
by writing to Premium Membership Services 665 S.E. 10 Street, Suite 201 Deerfield Beach, FL 33441-5634 or by calling 1-800-965-8307
or 954-785-1121.
|
|
|


