You are not logged in.
This means you
CAN ONLY VIEW reports that were published prior to Monday, April 14, 2025.
You
MUST UPGRADE YOUR MEMBERSHIP if you want to see any current reports.
AFTER MARKET UPDATE - WEDNESDAY, JULY 1ST, 2009
Previous After Market Report Next After Market Report >>>
|
|
|
|
DOW |
+57.06 |
8,504.06 |
+0.68% |
|
Volume |
950,803,100 |
-28% |
|
Volume |
2,014,507,080 |
-8% |
|
NASDAQ |
+10.68 |
1,845.72 |
+0.58% |
|
Advancers |
2,213 |
71% |
|
Advancers |
1,824 |
65% |
|
S&P 500 |
+4.01 |
923.33 |
+0.44% |
|
Decliners |
766 |
25% |
|
Decliners |
891 |
32% |
|
Russell 2000 |
+9.18 |
517.46 |
+1.81% |
|
52 Wk Highs |
33 |
|
|
52 Wk Highs |
38 |
|
|
S&P 600 |
+5.91 |
274.23 |
+2.20% |
|
52 Wk Lows |
0 |
|
|
52 Wk Lows |
4 |
|
|
 |
Major Averages Rise With Quieter Volume Totals
Adam Sarhan, Contributing Writer,
US stocks rose after a slew of stronger-than-expected economic data was released on Wednesday. Volume totals were reported lower on the NYSE and on the Nasdaq exchange, which signaled a lack of buying from the institutional crowd. Advancers led decliners by nearly a 3-to-1 ratio on the NYSE and by a 2-to-1 ratio on the Nasdaq exchange. There were 15 high-ranked companies from the CANSLIM.net Leaders List that made a new 52-week high and appeared on the CANSLIM.net BreakOuts Page, higher than the 7 issues that appeared on the prior session. There has been a welcome improvement in recent days, yet an even greater expansion in the new highs list in the weeks ahead would offer more encouraging news for growth oriented investors.

The latest round of economic data released helped reaffirm the notion that the brunt of the recession is over. Before Wednesday's opening bell, the country's largest employment services firm, ADP, said employers cut -473,000 in June. This was about the same as May's adjusted reading of a -485,000 cut. The Labor Department is slated to release June's non-farm payrolls report on Thursday since the Market will be closed on Friday in observance of Independence Day.
A separate report showed that factory orders rose +0.7% in April. Elsewhere, the Institute for Supply Management's (ISM) manufacturing index continued to rise toward positive territory. The index rose to 42.8 in May from 40.1 in April. The good news for the economy is that as manufacturing expands inventories are falling which is a net positive for the economy. The National Association of Realtors released a report which showed that pending home sales was little changed in May, at 90.7. However, the index did rise on a year-over-year basis, gaining +3.2%. A pending sale is one in which a contract for a new home was signed, but not yet closed. Normally, it takes approximately four to six weeks to close a contracted sale.
Looking forward, earnings season is right around the corner and will officially begin next week. Remember that stocks during earnings season can be very volatile. A very simple, yet effective, way to gauge your stocks' health is to see how it reacts to its quarterly earnings. Historically, the best stocks produce strong sales and earnings every quarter, which translates into higher stock prices. PICTURED: The Nasdaq Composite Index has significant work to do before it might reach its multi-year downward trendline.
|
|
|
 |
Gold & Silver Index Finding Support Near 50-Day Average
Kenneth J. Gruneisen - Passed the CAN SLIM® Master's Exam
The Gold & Silver Index ($XAU +3.82%) was a standout gainer on Wednesday, meanwhile energy-related shares were mostly calm as the Oil Services ($OSX -0.19%) and Integrated Oil ($XOI +0.38%) indexes were mixed and little changed on the session. The Healthcare ($HMO +1.45%) group rose, and the Semiconductor ($SOX +1.47%) and Networking ($NWX +1.67%) indexes led the tech sector higher. However, the Internet Index ($IIX +0.18%) only posted a tiny gain, and the Biotechnology Index ($BTK -1.42%) sank. The major averages' ability to make much headway was hindered as the influential Retail Index ($RLX -0.29%) and the Bank Index ($BKX -0.71%) ended modestly lower and the Broker/Dealer Index ($XBD +0.13%) barely edged higher.
Charts courtesy www.stockcharts.com
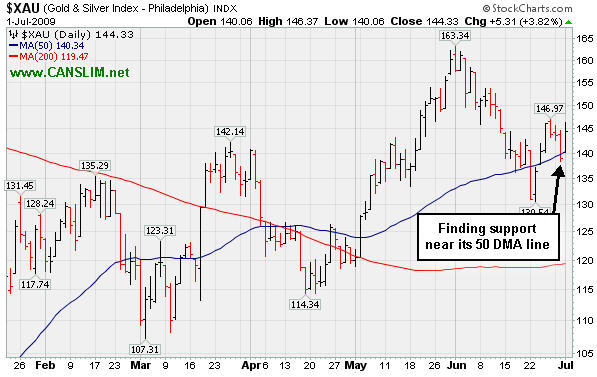
PICTURED: The Gold & Silver Index ($XAU +3.82%) has recently found support near its 50-day moving average (DMA) line, and it has generally trended higher since its 50 & 200 DMA lines crossed over in April.
| Oil Services |
$OSX |
159.35 |
-0.31 |
-0.19% |
+31.27% |
| Healthcare |
$HMO |
1,125.67 |
+16.14 |
+1.45% |
+17.24% |
| Integrated Oil |
$XOI |
922.43 |
+3.53 |
+0.38% |
-5.84% |
| Semiconductor |
$SOX |
267.02 |
+3.87 |
+1.47% |
+25.85% |
| Networking |
$NWX |
188.22 |
+3.10 |
+1.67% |
+30.81% |
| Internet |
$IIX |
187.08 |
+0.33 |
+0.18% |
+39.85% |
| Broker/Dealer |
$XBD |
98.86 |
+0.13 |
+0.13% |
+27.61% |
| Retail |
$RLX |
321.61 |
-0.94 |
-0.29% |
+15.17% |
| Gold & Silver |
$XAU |
144.33 |
+5.31 |
+3.82% |
+16.54% |
| Bank |
$BKX |
36.19 |
-0.26 |
-0.71% |
-18.34% |
| Biotech |
$BTK |
687.27 |
-9.90 |
-1.42% |
+6.20% |
|
|
|
 |
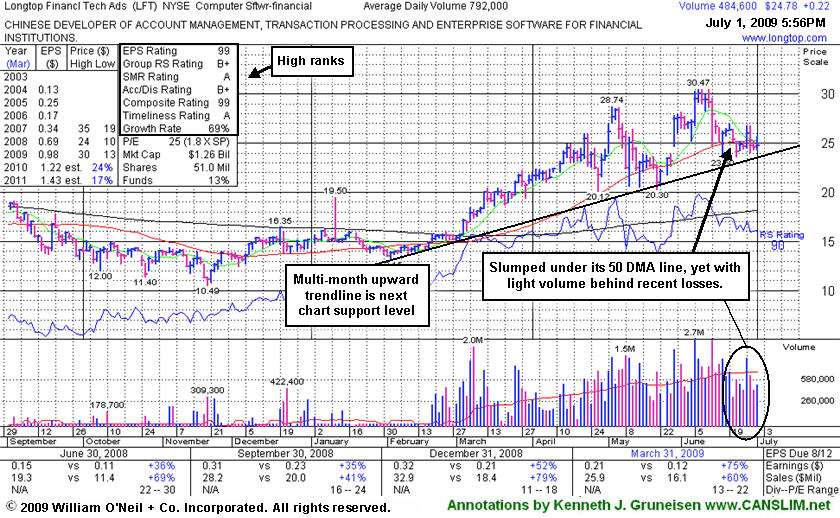
Upward Trendline Is Next Important Technical Support Level
Kenneth J. Gruneisen - Passed the CAN SLIM® Master's Exam
Longtop Financl Tech Ads (LFT +$0.22 or +0.90% to $24.78) recently slumped under its 50-day moving average (DMA) line, and its outlook gets increasingly questionable the longer it remains trading below that important short-term average. Any subsequent losses leading to deterioration below its multi-month upward trendline would raise additional concerns and trigger a more worrisome technical sell signal. Keep in mind that its progress could be hindered by future share offerings. This Chinese Computer Software firm recently filed a registration of approximately 16 million shares for resale, and it also revealed a planned acquisition of another Chinese service provider.
LFT was first featured at $22.19 on Thursday, April 02, 2009 in the CANSLIM.net Mid Day Breakouts Report (read here). Return on Equity of +20% is above the +17% guideline. It has reported strong annual and quarterly earnings increases (good concerning the C & A criteria) backed by strong sales revenues increases.
|
|
|
Color Codes Explained :
Y - Better candidates highlighted by our
staff of experts.
G - Previously featured
in past reports as yellow but may no longer be buyable under the
guidelines.
***Last / Change / Volume quote data in this table corresponds with the timestamp on the note***
Symbol/Exchange
Company Name
Industry Group |
Last |
Chg. |
Vol
% DAV |
Date Featured |
Price Featured |
Latest Pivot Point
Featured |
Status |
| Latest Max Buy Price |
GMCR
- NASDAQ
Green Mtn Coffee Roastrs
FOOD & BEVERAGE - Processed & Packaged Goods
|
$60.06
|
N/A
|
N/A
N/A
|
1/1/2008
(Date
Featured) |
$27.13
(Price
Featured) |
PP = $28.66 |
G |
| MB = $30.09 |
Most Recent Note - 7/1/2009 5:44:42 PM
G - Recently found support above its 50 DMA line -important support to watch. On 6/09/09 it reached a new all-time high with a gain on light volume as a 3:2 stock split took effect. GMCR traded up more than +144% since appearing with an annotated graph under the headline "It May Soon Be Time To Go Green" when featured in the January 2009 CANSLIM.net News (read here).
>>> The latest Featured Stock Update with an annotated graph appeared on 6/22/2009. click here.
|
|
C
A
S
I |
News |
Chart |
SEC
View all notes Alert
me of new notes
Company
Profile
|
HMSY
- NASDAQ
H M S Holdings Corp
COMPUTER SOFTWARE & SERVICES - Healthcare Information Service
|
$41.49
|
N/A
|
N/A
N/A
|
2/20/2009
(Date
Featured) |
$34.08
(Price
Featured) |
PP = $38.38 |
G |
| MB = $40.30 |
Most Recent Note - 7/1/2009 5:46:02 PM
G - A small gain on average volume today helped it hit a new all-time high above its "max buy" level. Color code was changed to green after rising up more than +5% from its latest base. Prior chart highs near $38 are an important support level to watch, where deterioration into its prior base would raise concerns. Gap up gain on 6/16/09 with heavy volume triggered a technical buy signal. No overhead supply is left to hinder the progress for this Commercial Services - Healthcare firm.
>>> The latest Featured Stock Update with an annotated graph appeared on 6/29/2009. click here.
|
|
C
A
S
I |
News |
Chart |
SEC
View all notes Alert
me of new notes
Company
Profile
|
LFT
-
|
$24.78
|
N/A
|
N/A
N/A
|
4/2/2009
(Date
Featured) |
$22.19
(Price
Featured) |
PP = $21.81 |
G |
| MB = $22.90 |
Most Recent Note - 7/1/2009 5:47:26 PM
G - Its outlook gets increasingly questionable the longer it remains treading under its 50 DMA line. Its progress could be hindered by future share offerings. This Chinese Computer Software firm recently filed a registration of approximately 16 million shares for resale, and it also revealed a planned acquisition of another Chinese service provider.
>>> The latest Featured Stock Update with an annotated graph appeared on 7/1/2009. click here.
|
|
C
A
S
I |
News |
Chart |
SEC
View all notes Alert
me of new notes
Company
Profile
|
NTES
- NASDAQ
Netease Inc Adr
INTERNET - Internet Information Providers
|
$34.63
|
N/A
|
N/A
N/A
|
5/21/2009
(Date
Featured) |
$31.19
(Price
Featured) |
PP = $32.75 |
G |
| MB = $34.39 |
Most Recent Note - 7/1/2009 5:49:45 PM
G - Ended near the middle of its intra-day range today with its third consecutive loss leading to a test of its 50 DMA line and upward trendline, important support to watch above its prior chart highs in the $32 area. Its 5/28/09 gap up and considerable gain with +79% above average volume confirmed a technical buy signal as it rose above its pivot point. Indications of institutional (the I criteria) buying demand have been noted after earnings news on 5/20/09 a shakeout tested support near its 50 DMA line. First featured at $26.75 in the 3/31/09 CANSLIM.net Mid-Day Breakouts Report (read here). This high-ranked Chinese Internet - Content firm was also summarized in greater detail including an annotated graph in the April 2009 issue of CANSLIM.net News (read here).
>>> The latest Featured Stock Update with an annotated graph appeared on 6/30/2009. click here.
|
|
C
A
S
I |
News |
Chart |
SEC
View all notes Alert
me of new notes
Company
Profile
|
NVEC
- NASDAQ
N V E Corp
ELECTRONICS - Semiconductor - Specialized
|
$49.50
|
N/A
|
N/A
N/A
|
3/13/2009
(Date
Featured) |
$33.85
(Price
Featured) |
PP = $45.50 |
G |
| MB = $47.78 |
Most Recent Note - 7/1/2009 5:50:46 PM
G - Small gain on light volume again today for another new high close above its "max buy" level. Color code was changed to green, and it is extended from a sound buy point. Its 6/19/09 gain with volume more than 2 times average helped it rise from an "ascending base" type pattern to a new 52-week high and multi-year high, triggering a technical buy signal. Sales increases in recent comparisons have been under the +25% guideline and still rather minuscule, leaving concerns, especially in the event of any hiccups. This is a reason to be especially disciplined about proper entries and exits.
>>> The latest Featured Stock Update with an annotated graph appeared on 6/23/2009. click here.
|
|
C
A
S
I |
News |
Chart |
SEC
View all notes Alert
me of new notes
Company
Profile
|
SNDA
-
|
$56.31
|
N/A
|
N/A
N/A
|
5/31/2009
(Date
Featured) |
$57.62
(Price
Featured) |
PP = $53.95 |
G |
| MB = $56.65 |
Most Recent Note - 7/1/2009 12:51:40 PM
G - Gapped up today after an analyst upgrade, repairing the prior session's 50 DMA line violation. Deterioration below its recent chart low near $50 would raise more serious concerns and trigger a worrisome technical sell signal. Detailed analysis was included when recently featured in the June 2009 issue of CANSLIM.net News. Be sure to review the "What to Look Out For" section and entire detailed summary - read here).
>>> The latest Featured Stock Update with an annotated graph appeared on 6/25/2009. click here.
|
|
C
A
S
I |
News |
Chart |
SEC
View all notes Alert
me of new notes
Company
Profile
|
SYNA
- NASDAQ
Synaptics Inc
COMPUTER SOFTWARE & SERVICES - Information Technology Service
|
$38.46
|
N/A
|
N/A
N/A
|
5/18/2009
(Date
Featured) |
$32.58
(Price
Featured) |
PP = $34.52 |
G |
| MB = $36.25 |
Most Recent Note - 7/1/2009 5:51:59 PM
G - Volume has been drying up while consolidating in a tight range within close striking distance of all-time highs. Its August 2008 chart highs ($36), its 50 DMA line, and recent chart highs coincide to define an important support level. First featured in yellow in the May 18, 2009 mid-day report (read here). The number of top-rated funds owning its shares rose from 123 in June '08 to 197 in March '09, which is good news concerning the I criteria. Its annual earnings (the A criteria) history showed a dowturn in 2006, leaving concerns, but it followed that up with strong growth the next 2 years. Its small supply of shares (the S criteria) outstanding could contribute to especially great volatility in the event of institutional accumulation or distribution.
>>> The latest Featured Stock Update with an annotated graph appeared on 6/26/2009. click here.
|
|
C
A
S
I |
News |
Chart |
SEC
View all notes Alert
me of new notes
Company
Profile
|
TNDM
- NASDAQ
Tandem Diabetes Care Inc
TELECOMMUNICATIONS - Wireless Communications
|
$30.06
|
N/A
|
N/A
N/A
|
3/2/2009
(Date
Featured) |
$18.89
(Price
Featured) |
PP = $29.85 |
G |
| MB = $31.34 |
Most Recent Note - 7/1/2009 5:52:49 PM
G - Quietly consolidating after recently rebounding above its 50 DMA line. Its choppy chart offers no sound base per the investment system's guidelines. It traded up as much as +72.42% since first featured at $18.89 in the 3/02/09 Mid-Day BreakOuts Report (read here).
>>> The latest Featured Stock Update with an annotated graph appeared on 6/24/2009. click here.
|
|
C
A
S
I |
News |
Chart |
SEC
View all notes Alert
me of new notes
Company
Profile
|
|
|
|
THESE ARE NOT BUY RECOMMENDATIONS!
Comments contained in the body of this report are technical
opinions only. The material herein has been obtained
from sources believed to be reliable and accurate, however,
its accuracy and completeness cannot be guaranteed.
This site is not an investment advisor, hence it does
not endorse or recommend any securities or other investments.
Any recommendation contained in this report may not
be suitable for all investors and it is not to be deemed
an offer or solicitation on our part with respect to
the purchase or sale of any securities. All trademarks,
service marks and trade names appearing in this report
are the property of their respective owners, and are
likewise used for identification purposes only.
This report is a service available
only to active Paid Premium Members.
You may opt-out of receiving report notifications
at any time. Questions or comments may be submitted
by writing to Premium Membership Services 665 S.E. 10 Street, Suite 201 Deerfield Beach, FL 33441-5634 or by calling 1-800-965-8307
or 954-785-1121.
|
|
|


